#cdc change data capture
Explore tagged Tumblr posts
Visit Tumblr Blog
Explore Tumblr blogs with no restrictions, modern design and the best experience.
Last Seen Tumblr Blogs


Fun Fact
The total number of visits Tumblr.com received during January 2021 is 327 million.
Text
#Change Data Capture (CDC)#Real-time data synchronization#CDC with Apache Kafka#CDC integration with Apache Spark#Apache Kafka for data streaming#Spotify
0 notes
Text
Tracking Changes in SQL Server 2022
In the latest update of SQL Server 2022, keeping an eye on database table alterations has gotten a bit easier for the folks who build and maintain our databases. This piece is all about giving you the lowdown on how to make the most of SQL Server’s built-in goodies for change tracking. We’re zeroing in on Change Data Capture (CDC) and Temporal Tables, which are like superheroes for making sure…
View On WordPress
#CDC SQL Server#Change Data Capture#Data Auditing SQL Server#System-Versioned Temporal Tables#Temporal Tables SQL Server
1 note
·
View note
Text
While you were sleeping ...
Federal judge puts back funding to USAID
Federal judge demands US put back health related federal websites
Judge Tanya Chutkan investigating Elon Musk's ability to run DOGE
The Department of Energy blocks firings of hundreds of employees who work for a key agency maintaining the U.S. nuclear weapons stockpile
Federal judge stops Trump from sending detainees to Cuba
Federal judge stops Trump from shutting down Consumer Protection Agency
DOGE now at CMS which covers Medicare, Medicaid, the Children's Health Insurance Program, and the Health Insurance Marketplace and are allied with Rachel Riley who worked at privatizing healthcare under Trump's first term.
Trump seeks to gut the National Oceanic and Atmospheric Administration and privatize the nation's weather reports and news
Judge blocks DOGE from sensitive Treasury Dept payment system, system being studied and re-programmed after DOGE invasion. expected to finish in August 25.
DOGE database on DOGE site found compromised, anyone can open and edit
Hundreds of federal workers illegally 'fired' from FEMA, DHS, CIS, CPA, the Coast Guard, USCIS, DHS' Science and Technology Directorate, the VA, Education and the US Forestry Service as well as half of the CDC Epidemic Intelligence Service, The Indian (Native American) Health Service. Centers for Medicare and Medicaid Services and the National Institutes for Health, HUD and NOAA.
There have been illegal mass firings of 'probationary' federal employees, those who have just taken on jobs up to those who have were hired 2 years ago.
After seven prosecutors quit refusing to give a Trump deal to NYC mayor, prosecutors put into room and all told they would be fired unless a prosecutor signed off on the deal - Eric Adams case has been dropped and as a result, Adams is allowing Trump immigration to invade NYC.
Trump signs order to block funding for schools that mandate Covid vaccines
Trump has already captured funds to house the homeless in NYC that were disbursed by FEMA
Elon Musk has charged the US gov 16 million to hack at government departments so far.
Elon Musk was granted a 400million deal to sell the US gov cybertrucks
Elon Musk is now going after NASA, despite being a contractor for NASA, Trump says Musk will 'police' his own conflicts of interest.
Trump inserts himself into 'negotiations' between Russia and Ukraine, siding with Russia and not guaranteeing that Ukraine will return to pre-war borders.
Apparently at negotiations, US handed President Zelenskyy a note (mafia style) seeking half of Ukraine's mineral rights, which Zelenskyy refused to acknowlege.
at Munich Security Conference VP Vance pushes the right-wing in Europe, shocking and angering NATO allies, changing US policy towards Putin and China. Trump now says there is no US intent to 'beat China'.
FAKE DOGE 'employees' appear in San Francisco city hall demanding access to state systems and data, leaving when confronted.
Trump makes himself head of the Kennedy Center for the Arts many staff resign and many artist pull out of sold-out shows.
#trump administration#illegal federal firings#federal employees#doge#elon musk#donald trump#jd vance#ukraine#russia#china#while you were sleeping#fuck this timeline#democracy#trump overreach#shitler youth#nato#news#federal judges
241 notes
·
View notes
Text
Also preserved in our archive
A large multistate study, conducted by the Centers for Disease Control and Prevention's (CDC's) VISION Network, has found that COVID-19 vaccination given during pregnancy offered 52% protection, cutting risk of a COVID-19-associated emergency department or urgent care visit in half. This is especially significant because there is an increased risk of severe COVID-19 during pregnancy requiring hospitalization and potentially causing adverse pregnancy outcomes.
However, if received less than six months prior to pregnancy, vaccination effectiveness declined providing only moderate protection against COVID (28%). If received more than six months prior to pregnancy, vaccination provided little protection (6%) against COVID. The research is published in the journal Open Forum Infectious Diseases.
Similar to findings in previous VISION studies of those who were not pregnant, protection provided by vaccination against COVID for those who were pregnant waned over four to six months. Also, similar to COVID vaccines for individuals who are not pregnant, effectiveness was comparable to that of the flu vaccine.
The study looked at geographically and racially diverse data from electronic medical records captured during routine health care delivery. There was no difference in the protection provided by COVID vaccination by age or race in the study population of 7,677 pregnant 18- to 45-year-olds.
The authors of this study note that their findings, derived from real-world data, indicate the protection provided by either monovalent or bivalent COVID vaccination for those who were pregnant or became pregnant was lower as compared with previous studies, likely due to changes in virus subvariant predominance in 2022-23. Other VISION Network studies have had similar findings in non-pregnant populations.
"The VISION Network did this study to examine the effectiveness of the COVID-19 vaccine for individuals who were pregnant, because there have been a lot of questions as to whether pregnant people should be vaccinated or not," said study co-author Brian Dixon, Ph.D., MPA.
"Our data show that for COVID-19, vaccines are protective of pregnant persons, supporting CDC guidelines that recommend COVID vaccination." Dr. Dixon is director and a research scientist with the Clem McDonald Center for Biomedical Informatics at Regenstrief Institute and a professor at the Indiana University Indianapolis Richard M. Fairbanks School of Public Health.
Significantly, deidentified data contributed to the study by Regenstrief Institute indicated that pregnant persons in Indiana were half as likely to be vaccinated for COVID-19 than pregnant persons in the other states, including California, Colorado, Minnesota, Oregon, Utah, Washington and Wisconsin, from which data was analyzed. Approximately 65% of those in Indiana who were pregnant were unvaccinated, compared to 30 to 45% in the other states.
"COVID-19 vaccination remains essential for pregnant women's health," said study co-author Shaun Grannis, M.D., M.S., vice president for data and analytics at the Regenstrief Institute and professor of family medicine at the Indiana University School of Medicine.
"As a physician and data scientist, I encourage women to discuss with their doctors the benefits of getting vaccinated or revaccinated to stay protected during pregnancy. Our findings aim to spark vital conversations between physicians and pregnant women and those planning a pregnancy about the safety and protection that the COVID vaccine provides.
"We also hope this work will inspire public health leaders and policymakers in Indiana and across the nation to promote vaccination, reaching women, families, and communities. Ultimately, it's crucial for pregnant individuals to remain current with CDC-recommended COVID-19 vaccinations to safeguard their health."
The study was a collaboration among CDC and seven geographically diverse U.S. health care systems and research centers with integrated medical, laboratory and vaccination records—all members of the CDC's VISION Network.
In addition to Regenstrief Institute, which contributed both data and scientific expertise, VISION sites participating in the study were Columbia University, Health Partners, Intermountain Health, Kaiser Permanente Northern California, Kaiser Permanente Northwest and University of Colorado.
More information: Allison Avrich Ciesla et al, Effectiveness of the Original Monovalent and Bivalent COVID-19 Vaccines Against COVID-19–Associated Emergency Department and Urgent Care Encounters in Pregnant Persons Who Were Not Immunocomprom
#mask up#public health#wear a mask#pandemic#wear a respirator#covid#covid 19#still coviding#coronavirus#sars cov 2#covid vaccines#covid vaccine#covid vax
67 notes
·
View notes
Text
Why Every Parent Should Use a Child Growth Calculator to Monitor Development
Understanding a child's physical development is more than tracking height and weight. It's about ensuring optimal health during their most critical years. A child growth calculator is an essential digital tool for modern parenting, enabling consistent monitoring of your child’s physical development based on global standards like the WHO and CDC growth charts.

What is a Child Growth Calculator?
A child growth calculator helps track a child’s growth metrics like height, weight, and BMI compared with standard percentiles. It assesses whether a child is growing normally relative to their age and gender. Most calculators present results visually, allowing parents to track progress over time and identify any concerns early.
Unique Fact: Early Growth Patterns Predict Future Health
Studies suggest that abnormal growth patterns in the first two years of life can predict chronic health conditions in adulthood, such as cardiovascular disease or type 2 diabetes. This emphasizes the importance of tools like the child growth calculator in early intervention and lifelong health planning.
Key Benefits of Using a Child Growth Calculator
Instant Feedback: Know immediately if your child's growth falls within a healthy range.
Visual Tracking: See trends with easy-to-understand graphs and percentile charts.
Supports Pediatric Decisions: Provides valuable input during check-ups.
Improved Nutrition Planning: Adjust diet and lifestyle as needed.
Peace of Mind: Helps reduce anxiety with clear, data-driven insights.
Related High-Volume Keywords Used in This Blog
Baby weight chart by age
Child BMI calculator
Infant growth tracker
Toddler height calculator
Healthy weight for kids
Growth milestones for babies
CDC growth charts for children
Baby development chart
Pediatric assessment tools
Track baby growth online
Using the Child Growth Calculator at Different Stages
Infants (0–12 months)
Measurements: Weight, length, and head circumference
Frequency: Monthly
Tools: WHO Infant Growth Standards
Toddlers (1–3 years)
Add height and BMI to growth metrics
Frequency: Every 3–6 months
Children (4–10 years)
Focus on height, weight, and BMI
Frequency: Bi-annual or annual checkups
Adolescents (11–18 years)
Track changes in growth spurts during puberty
BMI tracking becomes more important
How to Use a Child Growth Calculator Effectively
Accurate Measurements: Use a reliable scale and stadiometer.
Use Correct Age: Round off to the nearest month for better accuracy.
Choose a Trusted Calculator: Prefer tools that use WHO or CDC standards.
Track Over Time: One-time use is not enough. Use consistently for best results.
Consult a Pediatrician: Use results as a discussion point with healthcare providers.
Real-Life Application Example
Suppose your 2-year-old daughter weighs 12 kg and is 86 cm tall. Inputting this data into a child growth calculator, you discover she falls in the 75th percentile for height and 60th percentile for weight. This indicates healthy growth, reducing worry and guiding balanced nutrition planning.
Limitations of Growth Calculators
While a child growth calculator is extremely useful, it doesn’t capture:
Cognitive and emotional development
Individual body types or familial height tendencies
Temporary issues like illness or medication effects
It should be used as a supporting tool, not a replacement for professional evaluation.
Digital Tools vs. Manual Charts
Although traditional paper growth charts are still valid, digital calculators are gaining popularity for their convenience, automatic plotting, and the ability to store and retrieve past data. Many mobile health apps now integrate child growth calculators, making it easy to track on the go.
FAQs About Child Growth Calculators
1. Are child growth calculators different for boys and girls? Yes, boys and girls grow at different rates and require gender-specific charts.
2. What percentile is considered ‘normal’? Between the 5th and 85th percentile is generally considered normal.
3. Should I be worried if my child is in a low percentile? Not necessarily. It depends on consistency over time and parental genetics. A doctor can best assess this.
4. Can these tools replace doctor visits? No, they are supplementary and not a substitute for professional healthcare.
5. Do calculators account for premature babies? Some do. Make sure to input the corrected age for more accurate results.

Conclusion: A Smarter Way to Support Your Child’s Growth
By regularly using a child growth calculator, you take a proactive role in your child’s health and development. It's an empowering tool that provides clarity, supports better parenting decisions, and ensures timely medical attention when necessary. Combine it with regular pediatric visits and a balanced lifestyle to keep your child thriving at every age.
0 notes
Text
Monolith to Microservices – How Database Architecture Must Evolve

The journey from monolith to microservices is like switching from a one-size-fits-all outfit to a tailored wardrobe—each piece has a purpose, fits perfectly, and works well on its own or with others. But here's the catch: while many teams focus on refactoring application code, they often forget the backbone that supports it all - database architecture.
If you're planning a monolithic to microservices migration, your database architecture can't be an afterthought. Why? Because traditional monolithic architectures often tie everything to one central data store. When you break your app into microservices, you can't expect all those services to keep calling back to a single data source. That would kill performance and create tight coupling. That’s the exact problem microservices are meant to solve.

What does evolving database architecture really mean?
In a monolithic setup, one large relational database holds everything—users, orders, payments; you name it. It's straightforward, but it creates bottlenecks as your app scales. Enter microservices database architecture, where each service owns its data. Without this, maintaining independent services and scaling seamlessly becomes difficult.
Here is how Microservices Database Architecture looks like:

Microservices Data Management: Strategies for Smarter Database Architecture
Each microservice might use a different database depending on its needs—NoSQL, relational, time-series, or even a share database architecture to split data horizontally across systems.
Imagine each service with its own custom toolkit, tailored to handle its unique tasks. However, this transition isn't plug-and-play. You’ll need solid database migration strategies. A thoughtful data migration strategy ensures you're not just lifting and shifting data but transforming it to fit your new architecture.
Some strategies include:
· strangler pattern
· change data capture (CDC)
· dual writes during migration
You can choose wisely based on your service’s data consistency and availability requirements.

What is the one mistake teams often make? Overlooking data integrity and synchronization. As you move to microservices database architecture, ensuring consistency across distributed systems becomes tricky. That’s why event-driven models and eventual consistency often become part of your database architecture design toolkit.
Another evolving piece is your data warehouse architecture. In a monolith, it's simple to extract data for analytics. But with distributed data, you’ll need pipelines to gather, transform, and load data from multiple sources—often in real-time.
Wrapping Up
Going from monolith to microservices isn’t just a code-level transformation—it’s a paradigm shift in how we design, access, and manage data. So, updating your database architecture is not optional; it's foundational. From crafting a rock-solid data migration strategy to implementing a flexible microservices data management approach, the data layer must evolve in sync with the application.
So, the next time you’re planning that big monolithic to microservices migration, remember: the code is only half the story. Your database architecture will make or break your success.---
Pro Tip: Start small. Pick one service, define its database boundaries, and apply your database migration strategies thoughtfully. In the world of data, small, strategic steps work better than drastic shifts.
Contact us at Nitor Infotech to modernize your database architecture for a seamless move to microservices.
0 notes
Text
Pass AWS SAP-C02 Exam in First Attempt
Crack the AWS Certified Solutions Architect - Professional (SAP-C02) exam on your first try with real exam questions, expert tips, and the best study resources from JobExamPrep and Clearcatnet.
How to Pass AWS SAP-C02 Exam in First Attempt: Real Exam Questions & Tips
Are you aiming to pass the AWS Certified Solutions Architect – Professional (SAP-C02) exam on your first try? You’re not alone. With the right strategy, real exam questions, and trusted study resources like JobExamPrep and Clearcatnet, you can achieve your certification goals faster and more confidently.
Overview of SAP-C02 Exam
The SAP-C02 exam validates your advanced technical skills and experience in designing distributed applications and systems on AWS. Key domains include:
Design Solutions for Organizational Complexity
Design for New Solutions
Continuous Improvement for Existing Solutions
Accelerate Workload Migration and Modernization
Exam Format:
Number of Questions: 75
Type: Multiple choice, multiple response
Duration: 180 minutes
Passing Score: Approx. 750/1000
Cost: $300
AWS SAP-C02 Real Exam Questions (Real Set)
Here are 5 real-exam style questions to give you a feel for the exam difficulty and topics:
Q1: A company is migrating its on-premises Oracle database to Amazon RDS. The solution must minimize downtime and data loss. Which strategy is BEST?
A. AWS Database Migration Service (DMS) with full load only B. RDS snapshot and restore C. DMS with CDC (change data capture) D. Export and import via S3
Answer: C. DMS with CDC
Q2: You are designing a solution that spans multiple AWS accounts and VPCs. Which AWS service allows seamless inter-VPC communication?
A. VPC Peering B. AWS Direct Connect C. AWS Transit Gateway D. NAT Gateway
Answer: C. AWS Transit Gateway
Q3: Which strategy enhances resiliency in a serverless architecture using Lambda and API Gateway?
A. Use a single Availability Zone B. Enable retries and DLQs (Dead Letter Queues) C. Store state in Lambda memory D. Disable logging
Answer: B. Enable retries and DLQs
Q4: A company needs to archive petabytes of data with occasional access within 12 hours. Which storage class should you use?
A. S3 Standard B. S3 Intelligent-Tiering C. S3 Glacier D. S3 Glacier Deep Archive
Answer: D. S3 Glacier Deep Archive
Q5: You are designing a disaster recovery (DR) solution for a high-priority application. The RTO is 15 minutes, and RPO is near zero. What is the most appropriate strategy?
A. Pilot Light B. Backup & Restore C. Warm Standby D. Multi-Site Active-Active
Answer: D. Multi-Site Active-Active
Click here to Start Exam Recommended Resources to Pass SAP-C02 in First Attempt
To master these types of questions and scenarios, rely on real-world tested resources. We recommend:
✅ JobExamPrep
A premium platform offering curated practice exams, scenario-based questions, and up-to-date study materials specifically for AWS certifications. Thousands of professionals trust JobExamPrep for structured and realistic exam practice.
✅ Clearcatnet
A specialized site focused on cloud certification content, especially AWS, Azure, and Google Cloud. Their SAP-C02 study guide and video explanations are ideal for deep conceptual clarity.Expert Tips to Pass the AWS SAP-C02 Exam
Master Whitepapers – Read AWS Well-Architected Framework, Disaster Recovery, and Security best practices.
Practice Scenario-Based Questions – Focus on use cases involving multi-account setups, migration, and DR.
Use Flashcards – Especially for services like AWS Control Tower, Service Catalog, Transit Gateway, and DMS.
Daily Review Sessions – Use JobExamPrep and Clearcatnet quizzes every day.
Mock Exams – Simulate the exam environment at least twice before the real test.
🎓 Final Thoughts
The AWS SAP-C02 exam is tough—but with the right approach, you can absolutely pass it on the first attempt. Study smart, practice real exam questions, and leverage resources like JobExamPrep and Clearcatnet to build both confidence and competence.
#SAPC02#AWSSAPC02#AWSSolutionsArchitect#AWSSolutionsArchitectProfessional#AWSCertifiedSolutionsArchitect#SolutionsArchitectProfessional#AWSArchitect#AWSExam#AWSPrep#AWSStudy#AWSCertified#AWS#AmazonWebServices#CloudCertification#TechCertification#CertificationJourney#CloudComputing#CloudEngineer#ITCertification
0 notes
Text
How to Optimize ETL Pipelines for Performance and Scalability

As data continues to grow in volume, velocity, and variety, the importance of optimizing your ETL pipeline for performance and scalability cannot be overstated. An ETL (Extract, Transform, Load) pipeline is the backbone of any modern data architecture, responsible for moving and transforming raw data into valuable insights. However, without proper optimization, even a well-designed ETL pipeline can become a bottleneck, leading to slow processing, increased costs, and data inconsistencies.
Whether you're building your first pipeline or scaling existing workflows, this guide will walk you through the key strategies to improve the performance and scalability of your ETL pipeline.
1. Design with Modularity in Mind
The first step toward a scalable ETL pipeline is designing it with modular components. Break down your pipeline into independent stages — extraction, transformation, and loading — each responsible for a distinct task. Modular architecture allows for easier debugging, scaling individual components, and replacing specific stages without affecting the entire workflow.
For example:
Keep extraction scripts isolated from transformation logic
Use separate environments or containers for each stage
Implement well-defined interfaces for data flow between stages
2. Use Incremental Loads Over Full Loads
One of the biggest performance drains in ETL processes is loading the entire dataset every time. Instead, use incremental loads — only extract and process new or updated records since the last run. This reduces data volume, speeds up processing, and decreases strain on source systems.
Techniques to implement incremental loads include:
Using timestamps or change data capture (CDC)
Maintaining checkpoints or watermark tables
Leveraging database triggers or logs for change tracking
3. Leverage Parallel Processing
Modern data tools and cloud platforms support parallel processing, where multiple operations are executed simultaneously. By breaking large datasets into smaller chunks and processing them in parallel threads or workers, you can significantly reduce ETL run times.
Best practices for parallelism:
Partition data by time, geography, or IDs
Use multiprocessing in Python or distributed systems like Apache Spark
Optimize resource allocation in cloud-based ETL services
4. Push Down Processing to the Source System
Whenever possible, push computation to the database or source system rather than pulling data into your ETL tool for processing. Databases are optimized for query execution and can filter, sort, and aggregate data more efficiently.
Examples include:
Using SQL queries for filtering data before extraction
Aggregating large datasets within the database
Using stored procedures to perform heavy transformations
This minimizes data movement and improves pipeline efficiency.
5. Monitor, Log, and Profile Your ETL Pipeline
Optimization is not a one-time activity — it's an ongoing process. Use monitoring tools to track pipeline performance, identify bottlenecks, and collect error logs.
What to monitor:
Data throughput (rows/records per second)
CPU and memory usage
Job duration and frequency of failures
Time spent at each ETL stage
Popular tools include Apache Airflow for orchestration, Prometheus for metrics, and custom dashboards built on Grafana or Kibana.
6. Use Scalable Storage and Compute Resources
Cloud-native ETL tools like AWS Glue, Google Dataflow, and Azure Data Factory offer auto-scaling capabilities that adjust resources based on workload. Leveraging these platforms ensures you’re only using (and paying for) what you need.
Additionally:
Store intermediate files in cloud storage (e.g., Amazon S3)
Use distributed compute engines like Spark or Dask
Separate compute and storage to scale each independently
Conclusion
A fast, reliable, and scalable ETL pipeline is crucial to building robust data infrastructure in 2025 and beyond. By designing modular systems, embracing incremental and parallel processing, offloading tasks to the database, and continuously monitoring performance, data teams can optimize their pipelines for both current and future needs.
In the era of big data and real-time analytics, even small performance improvements in your ETL workflow can lead to major gains in efficiency and insight delivery. Start optimizing today to unlock the full potential of your data pipeline.
0 notes
Text
Informatica Training in Ameerpet | Best Informatica
How to Optimize Performance in Informatica (CDI)
Informatica Cloud Data Integration (CDI) is a powerful ETL and ELT tool used for cloud-based data integration and transformation. Optimizing performance in Informatica CDI is crucial for handling large datasets efficiently, reducing execution time, and ensuring seamless data processing. Below are the key strategies for optimizing performance in Informatica CDI.

1. Use Pushdown Optimization (PDO)
Pushdown Optimization (PDO) enhances performance by offloading transformation logic to the target or source database, reducing the amount of data movement. There are three types of pushdown optimization:
Source Pushdown: Processes data at the source level before extracting it.
Target Pushdown: Pushes the transformation logic to the target database.
Full Pushdown: Pushes all transformations to either the source or target system.
To enable PDO, configure it in the Mapping Task under the "Advanced Session Properties" section. IICS Online Training
2. Use Bulk Load for High-Volume Data
When working with large datasets, using bulk load instead of row-by-row processing can significantly improve performance. Many cloud-based data warehouses, such as Snowflake, Amazon Redshift, and Google BigQuery, support bulk loading.
Enable Bulk API in target settings.
Use batch mode for processing instead of transactional mode.
3. Optimize Data Mapping and Transformations
Well-designed mappings contribute to better performance. Some best practices include: Informatica Cloud Training
Minimize the use of complex transformations like Joiner, Lookup, and Aggregator.
Filter data as early as possible in the mapping to reduce unnecessary data processing.
Use sorted input for aggregations to enhance Aggregator transformation performance.
Avoid unnecessary type conversions between string, integer, and date formats.
4. Optimize Lookup Performance
Lookup transformations can slow down processing if not optimized. To improve performance:
Use cached lookups instead of uncached ones for frequently used data.
Minimize lookup data by using a pre-filter in the source query.
Index the lookup columns in the source database for faster retrieval.
Use Persistent Cache for static lookup data. Informatica IICS Training
5. Enable Parallel Processing
Informatica CDI allows parallel execution of tasks to process data faster.
Configure Concurrent Execution in the Mapping Task Properties to allow multiple instances to run simultaneously.
Use Partitioning to divide large datasets into smaller chunks and process them in parallel.
Adjust thread pool settings to optimize resource allocation.
6. Optimize Session and Task Properties
In the session properties of a mapping task, make the following changes:
Enable high-throughput mode for better performance.
Adjust buffer size and cache settings based on available system memory.
Configure error handling to skip error records instead of stopping execution.
7. Use Incremental Data Loads Instead of Full Loads
Performing a full data load every time increases processing time. Instead:
Implement Change Data Capture (CDC) to load only changed records.
Use Last Modified Date filters to process only new or updated data.
8. Reduce Network Latency
When working with cloud environments, network latency can impact performance. To reduce it: Informatica Cloud IDMC Training
Deploy Secure Agents close to the data sources and targets.
Use direct database connections instead of web services where possible.
Compress data before transfer to reduce bandwidth usage.
9. Monitor and Tune Performance Regularly
Use Informatica Cloud’s built-in monitoring tools to analyze performance:
Monitor Task Logs: Identify bottlenecks and optimize accordingly.
Use Performance Metrics: Review execution time and resource usage.
Schedule Jobs During Off-Peak Hours: To avoid high server loads.
Conclusion
Optimizing performance in Informatica Cloud Data Integration (CDI) requires a combination of efficient transformation design, pushdown optimization, bulk loading, and parallel processing. By following these best practices, organizations can significantly improve the speed and efficiency of their data integration workflows, ensuring faster and more reliable data processing in the cloud.
Trending Courses: Artificial Intelligence, Azure AI Engineer, Azure Data Engineering,
Visualpath stands out as the best online software training institute in Hyderabad.
For More Information about the Informatica Cloud Online Training
Contact Call/WhatsApp: +91-7032290546
Visit: https://www.visualpath.in/informatica-cloud-training-in-hyderabad.html
#Informatica Training in Hyderabad#IICS Training in Hyderabad#IICS Online Training#Informatica Cloud Training#Informatica Cloud Online Training#Informatica IICS Training#Informatica IDMC Training#Informatica Training in Ameerpet#Informatica Online Training in Hyderabad#Informatica Training in Bangalore#Informatica Training in Chennai#Informatica Training in India#Informatica Cloud IDMC Training
0 notes
Text
Trends in Data Integration: How Azure Data Factory Fits In

Trends in Data Integration: How Azure Data Factory Fits In
The landscape of data integration is undergoing a rapid transformation. With the increasing demand for real-time insights, intelligent automation, and scalable architectures, organizations need robust tools to manage their data effectively. Azure Data Factory (ADF) stands out as a leading data integration service that is continuously evolving to meet these emerging trends.
Real-Time Data Processing and Analytics
Organizations are moving away from batch processing and toward real-time data analytics. This trend is driven by the need to respond swiftly to market changes and customer behaviors. Azure Data Factory supports real-time data integration through features such as change data capture (CDC) and event-driven triggers. By facilitating the near-instantaneous movement and transformation of data, ADF enables businesses to unlock actionable insights faster and drive more agile decision-making.
Integration of AI and Machine Learning
The integration of AI and machine learning into data workflows is another significant trend. By embedding advanced analytics and predictive capabilities directly into the data pipeline, companies can automate complex tasks, detect anomalies, and generate forecasts. ADF’s seamless integration with Azure Machine Learning and other cognitive services allows users to incorporate intelligent data transformations and analytics into their workflows. This capability not only enhances data quality but also streamlines operations and reduces manual intervention.
Adoption of Serverless Architectures
The shift toward serverless architectures has redefined how organizations build and deploy data solutions. Serverless platforms eliminate the need for managing underlying infrastructure, thereby reducing operational overhead and costs. Azure Data Factory, as a fully managed, serverless service, enables data engineers to design, orchestrate, and monitor data pipelines without worrying about server maintenance or scaling issues. This allows teams to focus on delivering business value while ADF handles the heavy lifting in the background.
Emphasis on Data Governance and Quality
As data volumes continue to grow, maintaining data quality and ensuring compliance have become paramount. Effective data governance requires robust metadata management and lineage tracking, ensuring that data remains reliable and secure throughout its lifecycle. ADF integrates with Azure Purview to offer comprehensive data governance capabilities, helping organizations track data movement, manage data cataloging, and enforce compliance policies. This integration ensures that data remains trustworthy and audit-ready, even as it traverses complex pipelines.
Edge Computing and Distributed Data Sources
In today’s connected world, data is generated not only in centralized data centers but also at the network edge. Edge computing is becoming critical for industries that require low latency and real-time analytics — such as manufacturing, healthcare, and transportation. While Azure Data Factory primarily operates as a cloud-based service, it seamlessly integrates with Azure IoT services to ingest and process data from edge devices. This hybrid approach allows organizations to combine the power of cloud analytics with the immediacy of edge computing.
Conclusion
The future of data integration lies in embracing real-time processing, intelligent automation, and scalable, serverless architectures. Azure Data Factory is at the forefront of this evolution, continuously adapting to new trends and challenges in the data landscape. By integrating advanced analytics, supporting modern architectures, and ensuring robust data governance, ADF empowers organizations to harness the full potential of their data.
As data integration trends continue to evolve, staying updated with the latest features in ADF is essential for maintaining a competitive edge. Keep an eye on our blog for regular updates and insights into how Azure Data Factory is driving innovation in the world of data integration.
WEBSITE: https://www.ficusoft.in/azure-data-factory-training-in-chennai/
0 notes
Text
Understanding Change Data Capture (CDC) in MySQL and PostgreSQL: BinLog vs. WAL + Logical Decoding
#DataScientist #DataEngineering #Innovation https://towardsdatascience.com/understanding-change-data-capture-cdc-in-mysql-and-postgresql-binlog-vs-wal-logical-decoding-ac76adb0861f?source=rss----7f60cf5620c9--data_engineering&utm_source=dlvr.it&utm_medium=tumblr
0 notes
Text
Boomi Boosts Data Management Capabilities With Acquisition of Modern Data Integration Provider Rivery
PHILIPPINES — Boomi™, the intelligent integration and automation leader, today announced a definitive agreement to acquire Rivery, a modern data integration provider that offers cutting-edge Change Data Capture (CDC) for real-time, efficient data movement. Rivery’s skilled data management team will join Boomi, strengthening the company’s ability to deliver world-class solutions to customers and…
0 notes
Text
Streamlining Data Integration with SAP CDC
Efficient data integration is a cornerstone of modern business success. SAP Change Data Capture (CDC) ensures real-time synchronization and data accuracy across platforms, improving decision-making and operational efficiency.
What is SAP CDC?
SAP CDC is a mechanism to track changes—like inserts, updates, and deletes—in SAP and non-SAP systems. These changes are captured and made available to downstream applications, ensuring data consistency.
Advantages of SAP CDC
Real-Time Data Sync: Keeps all systems updated instantly.
Improved ETL Processes: Reduces latency and improves pipeline efficiency.
Lower Overhead: Operates with minimal impact on system performance.
Enhanced Reporting: Provides up-to-date data for analytics tools.
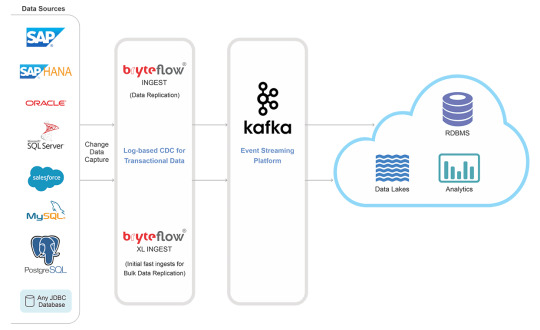
How SAP CDC Works
Log-Based Capture: Monitors changes via database logs.
Event Streaming: Sends change events to target systems in real time.
ETL Integration: Integrates seamlessly with data pipelines for further processing.
Applications of SAP CDC
Data Replication: Keep multiple databases synchronized.
Data Lakes and Warehousing: Feed real-time data into analytical environments.
Cloud Migration: Smoothly transfer data from legacy systems to modern platforms.
Advanced Use Cases
SAP CDC is especially valuable for companies operating across multiple regions. By ensuring data consistency and real-time availability, businesses can support global operations more effectively. SAP CDC also plays a vital role in machine learning workflows, providing up-to-date training data for AI models.
Getting Started with SAP CDC
Begin by identifying the source systems and changes you want to capture. Set up the integration using SAP tools or connectors, then test the pipeline to ensure accuracy. Focus on configuring alerts for failures to ensure continuous operations.
SAP CDC transforms how businesses manage data, providing a foundation for agile, data-driven operations. It’s the perfect solution for organizations seeking to stay ahead in today’s fast-paced digital landscape. Its real-time capabilities and flexibility make it indispensable for modern enterprises.
0 notes
Text
Using Amazon Data Firehose For Iceberg Table Replication

Amazon Data Firehose
Dependable real-time stream loading into analytics services, data lakes, and warehouses.
Capturing, transforming, and loading streaming data is simple. With a few clicks, you can create a delivery stream, choose your destination, and begin streaming data in real time.
Provide and scale network, memory, and processing resources automatically without constant management.
Without creating your own processing pipelines, you may dynamically segment streaming data and convert raw streaming data into formats like Apache Parquet.
How it operates
The simplest method for obtaining, transforming, and sending data streams to analytics services, data lakes, and data warehouses in a matter of seconds is offered by Amazon Data Firehose. Setting up a stream with a source, destination, and necessary modifications is necessary in order to use Amazon Data Firehose. The stream is continuously processed by Amazon Data Firehose, which scales automatically according to the volume of data available and provides it in a matter of seconds.
Source
Choose your data stream’s source, such as a stream in Kinesis Data Streams, a topic in Amazon Managed Streaming for Kafka (MSK), or write data using the Firehose Direct PUT API. You can build up a stream from sources like Amazon CloudWatch Logs, AWS WAF web ACL logs, AWS Network Firewall Logs, Amazon SNS, or AWS IoT because Amazon Data Firehose is connected into more than 20 AWS services.
Data Transformation (optional)
Choose whether you wish to decompress the data, execute custom data transformations using your own AWS Lambda function, convert your data stream into formats like Parquet or ORC, or dynamically partition input records based on attributes to send into separate places.
The destination
Choose a destination for your stream, such as Splunk, Snowflake, Amazon Redshift, Amazon OpenSearch Service, Amazon S3, or a custom HTTP endpoint.
Use cases
Flow into warehouses and data lakes
Without creating processing pipelines, stream data into Amazon S3 and transform it into the formats needed for analysis.
Increase security
Use supported Security Information and Event Management (SIEM) solutions to keep an eye on network security in real time and generate warnings when possible threats materialize.
Create applications for ML streaming
To evaluate data and forecast inference endpoints as streams go to their destination, enhance your data streams with machine learning (ML) models.
Use Amazon Data Firehose to replicate database updates to Apache Iceberg tables (in preview)
A new feature in Amazon Data Firehose that records modifications made to databases like PostgreSQL and MySQL and replicates the changes to Apache Iceberg tables on Amazon Simple Storage Service (Amazon S3) is being made available in preview today.
An excellent open-source table format for large data analytics is Apache Iceberg. Open-source analytics engines like Apache Spark, Apache Flink, Trino, Apache Hive, and Apache Impala can operate with the same data simultaneously with Apache Iceberg, which also adds the simplicity and dependability of SQL tables to S3 data lakes.
This new feature offers a straightforward, end-to-end way to stream database updates without affecting database applications’ transaction performance. To transmit change data capture (CDC) updates from your database, you can quickly set up a Data Firehose stream. Data from various databases can now be readily replicated into Iceberg tables on Amazon S3, allowing you to access current data for machine learning (ML) and large-scale analytics applications.
Typical Enterprise clients of Amazon Web Services (AWS) utilize hundreds of databases for transactional applications. They wish to record database changes, such as the addition, modification, or deletion of records in a table, and send the updates to their data warehouse or Amazon S3 data lake in open source table formats like Apache Iceberg so that they can do large-scale analytics and machine learning on the most recent data.
Many clients create extract, transform, and load (ETL) processes to read data from databases on a regular basis in order to accomplish this. However, batch tasks can cause many hours of delay before data is ready for analytics, and ETL readers affect database transaction speed. Customers seek the option to stream database changes in order to lessen the impact on database transaction performance. A change data capture (CDC) stream is the name given to this stream.
Installing and configuring several open-source components is necessary for the initial setup and testing of such systems. Days or weeks may pass. The operational overhead is increased by the engineers’ need to validate and implement open source updates, monitor and manage clusters after setup.
CDC streams from databases can now be continuously replicated to Apache Iceberg tables on Amazon S3 using Amazon Data Firehose’s new data streaming feature. A Data Firehose stream is created by defining its source and destination. An initial data snapshot and all ensuing modifications made to the chosen database tables are captured and continuously replicated by Data Firehose as a data stream. Data Firehose minimizes the impact on database transaction performance by using the database replication log to obtain CDC streams.
AWS Data Firehose automatically splits the data and keeps records until they are sent to their destination, regardless of how frequently the number of database updates changes. Cluster management and fine-tuning, as well as capacity provisioning, are optional. As part of the initial Data Firehose stream creation, Data Firehose can automatically generate Apache Iceberg tables with the same schema as the database tables in addition to the data itself. It can also dynamically develop the target schema, adding additional columns, for example, in response to changes in the source schema.
You don’t need to use open source components, install software upgrades, or pay for overhead because Data Firehose is a fully managed service.
Amazon Data Firehose offers a straightforward, scalable, end-to-end managed solution for delivering CDC streams into your data lake or data warehouse, where you can execute extensive analysis and machine learning applications. It does this by continuously replicating database updates to Apache Iceberg tables in Amazon S3.
Things to be aware of
Here are some other things to be aware of.
The following databases on Amazon RDS and self-managed PostgreSQL and MySQL databases on Amazon EC2 are supported by this new feature:
Amazon Aurora PostgreSQL-Compatible Edition with Amazon RDS for PostgreSQL
Amazon Aurora MySQL-Compatible Edition with Amazon RDS for MySQL
Throughout the trial period and beyond general availability, the team will keep adding support for other databases. They informed me that support for MongoDB, Oracle, and SQL Server databases is already in the works.
Data Firehose connects to databases in your Amazon Virtual Private Cloud (Amazon VPC) via AWS PrivateLink.
You have two options when configuring an Amazon Data Firehose delivery stream: you may define a class of tables and columns using wildcards, or you can specify particular tables and columns. When using wildcards, Data Firehose will automatically construct new tables and columns in the destination if they match the wildcard and are added to the database after the Data Firehose stream is created.
Accessibility
With the exception of the Asia Pacific (Malaysia), AWS GovCloud (US), and China regions, all AWS regions now offer the new data streaming feature.
Amazon Data Firehose pricing
At the start of the preview, there are no fees for your use. In the future, the price will be determined by your actual usage, such as the number of bytes read and supplied. There are no upfront costs or obligations. To learn more, be sure to read the pricing page.
Read more on Govindhtech.com
#AmazonDataFirehose#IcebergTable#Apache#AmazonData#AmazonS3#machinelearning#ML#Cloudcomputing#AWSservices#News#Technews#Technology#Technologynews#Technologytrends#Govindhtech
1 note
·
View note