#comparing multiple columns SQL
Explore tagged Tumblr posts
Visit Tumblr Blog
Explore Tumblr blogs with no restrictions, modern design and the best experience.
Last Seen Tumblr Blogs


Fun Fact
Tumblr Inc. has $15.1M in annual revenue.
Text
Finding the Maximum Value Across Multiple Columns in SQL Server
To find the maximum value across multiple columns in SQL Server 2022, you can use several approaches depending on your requirements and the structure of your data. Here are a few methods to consider: 1. Using CASE Statement or IIF You can use a CASE statement or IIF function to compare columns within a row and return the highest value. This method is straightforward but can get cumbersome with…
View On WordPress
#comparing multiple columns SQL#SQL CROSS APPLY technique#SQL Server aggregate functions#SQL Server date comparison#SQL Server maximum value
0 notes
Text
Accounting Data Disasters: Common Mistakes and How to Avoid Them
Ever feel like you're drowning in spreadsheets? You're not alone. As financial data grows more complex, even seasoned accountants make critical errors that can ripple through an entire business.
The Data Danger Zone: 5 Common Accounting Mistakes
1. Trusting Data Without Verification
We recently worked with a London retailer who based an entire quarter's strategy on sales projections from unreconciled data. The result? A £45,000 inventory mistake that could have been prevented with basic data validation.
Quick Fix: Implement a "trust but verify" protocol—cross-reference data from multiple sources before making significant decisions. At Flexi Consultancy, we always triangulate data from at least three sources before presenting insights to clients.
2. Excel as Your Only Tool
Excel is brilliant, but it's not designed to be your only data analysis tool when working with large datasets. Its limitations become dangerous when handling complex financial information.
Quick Fix: Supplement Excel with specialized data tools like Power BI, Tableau, or industry-specific financial analytics platforms. Even basic SQL knowledge can transform how you handle large datasets.
3. Ignoring Data Visualization
Numbers tell stories, but only if you can see the patterns. Too many accountants remain stuck in endless rows and columns when visual representation could instantly reveal insights.
Quick Fix: Learn basic data visualization principles and create dashboard summaries for all major reports. Your clients will thank you for making complex data digestible.
4. Overlooking Metadata
The context around your data matters just as much as the numbers themselves. When was it collected? Who entered it? What methodology was used?
Quick Fix: Create standardized metadata documentation for all financial datasets. Something as simple as "last modified" timestamps can prevent major reporting errors.
5. Manual Data Entry (Still!)
We're shocked by how many London accounting firms still manually transfer data between systems. Beyond being inefficient, this practice introduces errors at an alarming rate.
Quick Fix: Invest in proper API connections and automated data transfer protocols between your accounting systems. The upfront cost is nothing compared to the errors you'll prevent.
The Real Cost of Data Mistakes
These aren't just technical issues—they're business killers. One of our clients came to us after their previous accountant's data analysis error led to a six-figure tax miscalculation. Another lost investor confidence due to inconsistent financial reporting stemming from poor data management.
Beyond immediate financial implications, data mistakes erode trust, which is the currency of accounting.
Beyond Fixing: Building a Data-Strong Accounting Practice
Creating reliable financial insights from large datasets requires more than avoiding mistakes—it demands a systematic approach:
Document your data journey: Track every transformation from raw data to final report
Create repeatable processes: Standardize data handling procedures across your practice
Build data literacy: Ensure everyone touching financial information understands basic data principles
Implement peer reviews: Fresh eyes catch mistakes others miss
Need Help Navigating Your Data Challenges?
If you're struggling with financial data management or want to elevate your approach, reach out to our team. We specialize in helping London businesses transform financial data from a headache into a strategic asset.
This post was brought to you by the data nerds at Flexi Consultancy who believe financial insights should be both accurate AND actionable. Follow us for more practical accounting and financial management tips for London SMEs and startups.
0 notes
Text
Types of Data Models: A Detailed Explanation
Data models explain how data is structured, stored, and manipulated within a database. It serves as an organizing and understanding framework for the data relationship and, in this way, provides consistency and efficiency in managing the database. There are many types of data models. Some of these data models are best suited for particular applications. In this blog, we'll look at some of the most common types of data models and their applications.
1. Hierarchical Data Model
Description
The hierarchical data model is a tree-like structure, where every record (parent) has one or more child records. This model follows a one-to-many relationship.
Characteristics
-Data is structured in a hierarchy (tree format).
-Each child node has only one parent, but a parent can have multiple children.
-Navigation is done using predefined paths.
Use Cases
-Early database systems
-File systems (e.g., Windows Registry)
-Banking and telecommunication applications
2. Network Data Model
Overview
The network data model extends the hierarchical model by allowing multiple parent-child relationships (many-to-many relationships). Data is represented using a graph structure, where records are connected through links.
Characteristics
-More flexible than the hierarchical model.
-Supports complex relationships.
-Uses pointers to establish relationships.
Use Cases
-Large-scale applications like airline reservation systems
-Manufacturing and supply chain databases
-Telecommunications networks
3. Relational Data Model
Overview
The relational data model organizes data into tables (relations) consisting of rows (records) and columns (attributes). Relationships between tables are defined using primary keys and foreign keys.
Characteristics
-Uses structured query language (SQL) for data management.
-Provides high flexibility and scalability.
-Ensures data integrity through normalization.
Use Cases
-Web applications and enterprise software
-Customer relationship management (CRM) systems
-Banking and financial databases
4. Entity-Relationship (E-R) Model
Overview
The entity-relationship model represents data using entities (objects) and their relationships. It is used typically for database design even before the actual implementation of a relational database.
Characteristics
-Uses ER diagrams that are built up with entities, attributes, and relationships.
-Helps in conceptualizing and visualizing data.
-Provision of a high-level view of database structure.
Use Cases
-Database design and modeling
-Business process modeling
-Software engineering
5. Object-Oriented Data Model
Overview
The object-oriented data model integrates object-oriented programming (OOP) concepts into databases. Data is stored as objects, similar to classes in OOP languages like Java and C++.
Characteristics
-Supports complex data types.
-Enables inheritance, encapsulation, and polymorphism.
-Ideal for applications that require handling multimedia and complex data.
Use Cases
-Multimedia databases (e.g., images, videos)
-Computer-aided design (CAD) systems
-Artificial intelligence and machine learning applications
6. Document-Oriented Data Model
Overview
This model is commonly used in NoSQL databases, where data is stored as JSON or BSON documents instead of tables. Each document contains key-value pairs and can have a flexible schema.
Characteristics
-Schema-less and highly flexible.
-Supports nested and hierarchical data structures.
-Efficient for handling semi-structured and unstructured data.
Use Cases
-Content management systems (CMS)
-Big data applications
-E-commerce and real-time analytics
7. Key-Value Data Model
Overview
A simple data model where data is stored as key-value pairs. Each key is unique, and its associated value can be any type of data (string, number, object, etc.).
Characteristics
-High-speed data retrieval.
-Best suited for caching and session management.
-Minimal structure compared to relational databases.
Use Cases
-Distributed caching (e.g., Redis, Memcached)
-Shopping cart data storage
-Real-time recommendation systems
8. Graph Data Model
Overview
Graph data model. This model depicts data as nodes and edges, that is, as entities and relationships. This is very efficient in complex queries related to the relationship.
Characteristics
-Graphs are used when data is interlinked.
-Queries are based on graph traversal.
-Efficient in social networks and recommendation systems.
Choosing the right data model depends on the application's requirements, data complexity, and scalability needs. While relational models dominate traditional databases, NoSQL models like document-oriented and graph databases are gaining popularity for handling large-scale, complex data. Understanding different data models helps in designing efficient databases that best suit the business needs.
What type of data model do you use in your applications? Let us know in the comments!
TOPIC : TYPES OF DATA MODEL IN DBMS
1. Vidhanshu Kohale
2.Yash Waghamare
3.Yogesh Meherkar
4.Sumit Gone
5.Shreya Ingle
1 note
·
View note
Text

Best Power BI Course in Delhi - Empower Your Data Journey
Best Power BI Course in Delhi: Unlock Your Data-Driven Potential
In today’s data-driven world, businesses are leveraging data more than ever to make informed decisions. Power BI, a powerful business analytics tool by Microsoft, allows organizations to turn raw data into meaningful insights. With its ability to connect to multiple data sources and create compelling visualizations, Power BI has become a crucial skill for professionals looking to stay ahead in the competitive job market.
If you're based in Delhi and looking to enhance your data analysis skills, enrolling in the best Power BI course in the city is an essential step toward career growth. At High Technologies Solutions, we offer a comprehensive, hands-on Power BI course designed to equip you with the skills you need to excel in the world of data analytics.
Why Choose Power BI?
Before we dive into the course details, let’s take a quick look at why Power BI is an essential tool for professionals:
Intuitive Interface: Power BI is known for its user-friendly interface, making it accessible for beginners while offering powerful features for advanced users.
Data Visualization: With interactive dashboards and reports, Power BI helps you visualize complex data trends, allowing businesses to make more informed, data-driven decisions.
Seamless Integration: Power BI can connect to a variety of data sources, including Excel, SQL Server, and even cloud-based platforms like Google Analytics and Salesforce.
Cost-Effective: Compared to other BI tools, Power BI offers a great price-to-performance ratio, especially for small and medium-sized enterprises.
Why High Technologies Solutions?
At High Technologies Solutions, we provide the best Power BI course in Delhi, designed for both beginners and experienced professionals. Here's why our course stands out:
Expert Trainers: Learn from industry experts with years of hands-on experience. Our trainers are not only knowledgeable but also passionate about teaching and helping students grow in their careers.
Comprehensive Curriculum: Our Power BI course covers everything from basic concepts to advanced techniques. You’ll learn how to connect to data sources, create interactive reports, use DAX formulas, and more.
Real-World Projects: Gain practical experience by working on real-world projects. This ensures that you not only understand the theory but also have the skills to apply Power BI in real business scenarios.
Flexible Learning Options: Whether you prefer in-person sessions or online classes, we offer flexible learning options to fit your schedule.
Certification: Upon successful completion of the course, you will receive a certification that is recognized by top companies, giving you a competitive edge in the job market.
What Will You Learn in Our Power BI Course?
Power BI Desktop: Learn how to create stunning reports and dashboards using Power BI Desktop.
Data Transformation: Master the art of data cleaning and transformation using Power Query.
Data Modeling: Understand how to build relationships between different data tables and optimize your models.
DAX Functions: Gain in-depth knowledge of DAX (Data Analysis Expressions) to create powerful calculated columns and measures.
Publishing and Sharing Reports: Learn how to publish reports to the Power BI Service and share them with colleagues or clients.
Power BI Mobile: Understand how to access and interact with reports on mobile devices.
Career Opportunities with Power BI
Power BI professionals are in high demand across industries like finance, healthcare, retail, and more. By completing the best Power BI course in Delhi, you open doors to various job roles such as:
Business Intelligence Analyst
Data Analyst
Power BI Developer
Financial Analyst
Data Scientist
The salary potential for Power BI professionals is also lucrative, with many organizations offering competitive compensation packages to individuals with the right skills.
Take the First Step Toward Mastering Power BI Today!
Ready to take your career to the next level? Enroll in the best Power BI course in Delhi at High Technologies Solutions and unlock your data-driven potential. Whether you’re looking to enhance your current skill set or pivot into a new career, our expert-led training will give you the tools you need to succeed.
Call to Action (CTA)
Don't wait! Contact us today to learn more about our Power BI course and start your journey toward becoming a data analytics expert. Call us at [Insert Phone Number] or visit [Insert Website URL] to enroll now! Don’t miss out on the opportunity to shape your future with Power BI.
0 notes
Text
Database change management tools are of great help to developers and database administrators. These tools increase the efficiency of their work. Earlier database administrators used command lines to delete, create and edit databases. However now with the introduction of Database Change Management tools, the work load of the DBA’s has reduced considerably. Below are given different types of open source database change management tools which are of great help to the DBA’s: LIQUIBASE Liquibase is an open source (Apache 2.0 Licensed), database-independent library for tracking, managing and applying database changes. LIQUIBASE is used by developers in locating and making amendments in the database. The track of all these changes are maintained in an XML file (database changelog file) which serves to overview the list of changes made. It is compatible with any database which java can easily connect to. Key Features Efficiently manage multiple databases Extensible to make changes Able to keep a track record of database changes Execution can take place through Maven, command line, Ant etc. Download is available at https://www.liquibase.org/download DBDeploy Designed by a team of professionals at “Thoughworks”, this database change management tool is basically used by developers to manage and enhance their database designs. It is much more useful for those who refactor their database more often. Dbdeploy has employed java for its code construction and unifies with Sybase and Hypersonic SQL databases, Apache Ant build tool supporting Oracle. Key Features Simple to use Works well with Ant Download is available at http://code.google.com/p/dbdeploy/downloads/list Ruckusing This database tool is a frame of reference written in PHP5. Its use is to create and manage “database migrations”. These “database migrations” are files that define the present status of a database like its indexes, columns etc. The salient feature of this database is that multiple users can simultaneously work on the same application. In case of a crash by an individual the other users shall not be disrupted. The idea of the framework was influenced from the migration system built into Ruby on Rails. Any one who is familiar with Migrations in RoR will be able to use this quickly Key Features Portability: The migration files are initially written in PHP5 which are further translated to appropriate SQL during runtime. Thus providing an option of supporting any RDBMS with a single migration file. The ability to move (up and down) to particular migration state Download is available at DBSource Tools This database management tool is in there in form of a GUI service. Its use is to bring SQL server database under source control. Key Features Can be used to compare schemas Strong database scripter Download is available at Nextep Open Designer This IDE is used as a remedial measure for the deployment and development of the database as well as automating you test processes and your deployment. This software is available for free and its installation has many advantages. NeXtep Open Designer uses a centralized version control repository to track any change you make on your database model, source code (PL/SQL, T-SQL, etc.) and reference data. This repository is a simple database schema that can be automatically deployed to any supported database. Key Features Ease of merging database during development Helps in integrating deployment processes Download is available at http://www.nextep-softwares.com/index.php/products Tasks like maintaining and updating the relational databases are done by these tools very quickly and efficiently. These tools also help in maintaining the complex projects thus making the task easier for developers. Thus if you wish to increase your efficiency then these Database Management Tools are highly recommended. Hope you found this list useful! What are the tools you have used for database management? Please don't forget to share with us in comments.
Article Updates Article Updated on September 2021. Some HTTP links are updated to HTTPS. Updated broken links with latest URLs. Some minor text updates done. Content validated and updated for relevance in 2021.
0 notes
Text
Unlock Efficient Data Filtering in PowerApps with Power-FX: A Complete Guide

Filtering a gallery in PowerApps is a common task when building applications, as it allows users to view only the data that is relevant to them. With the power of PowerFX, PowerApps’ formula language, you can create dynamic, responsive filters that enhance the user experience. In this blog, we will explore the steps to properly filter a gallery using PowerFX, ensuring your filters are both efficient and user-friendly.
Step 1: Understand Your Data Source
Before applying any filters, it’s crucial to understand the structure of your data source. Whether you’re working with a SharePoint list, a SQL database, or any other connector, knowing the fields and data types will help you create effective filters.
For example, if you have a SharePoint list with fields like Title, Status, and CreatedDate, these will be the basis for your filtering.
Step 2: Basic Filtering with PowerFX
To begin with, let’s look at how to apply a basic filter to a gallery. Suppose you have a gallery displaying items from a SharePoint list, and you want to filter this gallery to show only items where the Status is “Completed”.
Here’s the PowerFX formula you would use:
Filter(YourDataSource, Status = “Completed”)
This formula filters the gallery by comparing the Status field in your data source to the string “Completed”. Only items that meet this condition will be displayed in the gallery.
Step 3: Using User Input for Dynamic Filtering
Often, you’ll want to allow users to input their own criteria for filtering. This can be done using a TextInput or Dropdown control in combination with the Filter function.
For example, if you have a TextInput control where users can enter a title, and you want to filter the gallery based on the Title field-
Add a TextInput control to your screen and name it txtSearchTitle.
Modify your gallery’s Items property with the following PowerFX formula:
Filter(YourDataSource, StartsWith(Title, txtSearchTitle.Text))
This formula filters the gallery to show only items where the Title field starts with the text entered by the user.
Step 4: Combining Multiple Filters
You can combine multiple filters to refine your results even further. For instance, if you want to filter items based on both Status and a partial match on Title, you can combine conditions using the && (AND) operator:
Filter(YourDataSource, Status = “Completed” && StartsWith(Title, txtSearchTitle.Text))
This formula will show only those items that have a Status of “Completed” and a Title that starts with the text provided by the user.
Step 5: Optimizing Filter Performance
When dealing with large data sets, performance can become an issue. Here are some tips to optimize filter performance:
Minimize Delegation Warnings: PowerFX supports delegation for certain data sources and functions. Delegation allows PowerApps to offload data processing to the data source, rather than retrieving all records and processing them locally. Always check for delegation warnings and adjust your formulas accordingly.
Use Indexed Columns: If you’re filtering a SharePoint list, ensure the fields used in your filters are indexed. This can significantly speed up queries.
Limit the Number of Items: Use the FirstN function to limit the number of items returned, especially in cases where displaying only the top results is sufficient.
FirstN(Filter(YourDataSource, Status = “Completed”), 100)
Step 6: Handling Empty Filters
Sometimes, users might not enter any criteria, and you’ll want to display all items or handle empty filters gracefully. You can handle this scenario by modifying your filter logic.
If(IsBlank(txtSearchTitle.Text), YourDataSource, Filter(YourDataSource, StartsWith(Title, txtSearchTitle.Text)))
This formula checks if the txtSearchTitle is blank. If it is, the gallery displays all items; otherwise, it applies the filter.
How We Can Help?
We are a team of professionals specializing in Power Apps development. With extensive experience in building custom applications tailored to specific business needs, we can help you unlock the full potential of Power Apps for your organization.
Whether you need to create complex data-driven applications, streamline processes, or enhance user experience, Memetic Solutions experts are here to guide you every step of the way. Join us in your journey and Experience more Technologies like this.
#PowerApps#PowerFX#AppDevelopment#LowCode#MicrosoftPowerApps#PowerPlatform#GalleryFiltering#BusinessApps#DataDrivenApps#AppBuilding#PowerAppsTips#PowerFXGuide#AppDevelopmentTools#TechInnovation#BusinessSolutions
0 notes
Text
SQL and NoSQL: Differences, Use cases and Databases
SQL and NoSQL are counter technologies meant to accomplish the same business goals. The difference mainly exists in the autonomy to ‘explore data deeply’ and ‘ease of scalability’
SQL has existed as a widely accepted industry standard for so long now. Its counterpart; NoSQL, emerged almost 12 years ago when the world needed a disparate system that could process unstructured data as well as comply with increasing storage and power requirements.
The rise of NoSQL almost diminished the decade old SQL paradigm of relational database management system (RDBMS) giving rise to non relational database systems.
Now as we see, SQL didn’t go away, instead its potential to manipulate data in databases is increasingly realized.
In this article, we explore sql and nosql difference, sql vs. nosql use cases, and comparison of databases.
SQL and NoSQL Difference
The differences in SQL and NoSQL exist among four key parameters: Language, Scalability, Structure, and Transaction Processing.
Language
SQL is used to query structured data only. Structured data exists in the form of rows and columns (2D tables) and therefore exert the constraint for a carefully built schema before querying data.
That’s because for data whose structure could not be defined; data from mobile applications, and SAP systems with a lot of varying fields where new fields occur every now and then, SQL fails given its syntax and control flow that works only for table based data.
Apart from the structure constraint on data, SQL has been well nurtured in the past 40 years to offer wide functionality for complex queries, and is secure in usage.
The learning curve of SQL is also short compared to other programming languages (including NoSQL). Moreover, all the variants of SQL including for example SQL server, and MySQL have a great amount of similarity in usage and therefore are easily learnt across the globe.
NoSQL has its own advantages over SQL. It offers the flexibility to query unstructured data (with a dynamic schema not limited to representing data in rows and columns). This means now each type of data could have alternate structure all stored beside each other in a single database.
NoSQL was introduced some 12 years ago with the aim of utilization of unstructured or loosely structured data in database applications.
There’s freedom from rigorous data engineering before the storage to use the data for BI and ML applications. NoSQL offers greater exploration of data in that the raw data is directly fed to the system for storage and after that the BI and ML engineers could build schemas as they like.
The spotlight on NoSQL waned when its users realized it lacked standardization and wide documentation leading to difficulty in carrying out complex queries.
Moreover, NoSQL language varies across databases where each database (MongoDB, Cassandra, etc) have their completely varying versions of noSQL.CategorySQLNoSQLLanguageStructured data onlyStructured and unstructuredScalabilityVerticalHorizontalStructureTable format4 Types incl. columnar formatTransactionsACID complianceCAP theoremSQL vs. NoSQL Difference
Scalability
Scalability is one of the most distinctive features of SQL and NoSQL databases. For the scope of this article, we define scalability as the capacity of a system to process a number of concurrent queries.
The ease of adding and removing processing resources for the purpose of supporting concurrent users determines the effectiveness of scalability.
SQL supports vertical scalability that means new processing resources could be added within the same server. It’s based on the actor model that uses multiple CPU cores. All the processor cores participate in processing over the same data.
NoSQL adopts the horizontal scalability that instead of adding cores to CPU adds new servers in parallel to old ones. It uses a master/slave architecture where a master processor divides data among slave processors.
In essence, horizontal scaling is more desirable due to its ability to divide data across parallel machines. This way it enables faster processing from utilization of all resources in less time. Whereas vertical scaling, although much easier to implement, lacks the kind of linear scalability as in horizontal scaling.
Learn more about differences in horizontal scalability and vertical scalability here.
Structure
SQL databases store data in rows and columns where a column represents a specific data type only. While making these tables some rules are defined to maintain the integrity of data as well as making it efficient for the querying process.
NoSQL databases don’t conform to this tabular structure, and don’t require data engineering such as above. Instead they use other formats that are more flexible to add any kind of data desired. These formats are:
Column-oriented structure: Data resides in columns however these columns support any kind of data type. It results in high dimensional data.
Key-Value structure: Data objects are defined and a unique key is assigned to each object.
Document stores: specifically holds semi-structured data where some of the data is structured, while it may contain other data that has no defined column category.
Graph databases: It uses nodes and relationships to structure data instead of a table or a document. Nodes present data elements while relationships present how they are related to each other.
Learn more about Graph databases in this comprehensive article.
Transaction Processing
As you may be well aware that SQL databases process transactions in such a way as to minimize the erroneous events that might affect the data. For this, it uses the ACID rules. These are the:
Atomicity of a transaction prevents it from getting saved when it’s incomplete. A transaction is either saved when it’s completed only or failed otherwise.
Consistency prevents data from being corrupted by following rules at each step of transactional processing.
Isolation keeps away multiple users to change the same data at same time.
Durability records a transaction once it is made. No roll back can be done after a transaction is saved.
In distributed systems as a copy of data is stored on all distributed nodes through replication the transactional processing is a little different. NoSQL uses the CAP theorem that is specifically designed for successful transaction processing on distributed systems.
Consistency ensures the delivery of latest results where sometimes in case of a node separated from the system due to a network failure might not receive the updated information. An error message must be sent to the user instead of an unlatest value fetched from a node.
Availability, unlike a consistent system, ensures that a transaction is always successful (returning a non-error result) even when there’s network failure.
Partition Tolerance is a phenomenon for uninterruptible system performance in case of a network failure between parallel systems. More than one link is created among nodes such that if a link fails, there are other links that duplicate data to other nodes.
In NoSQL databases, only two properties are fulfilled at a time, that is, either CA, CP, or AP.
Learn more about the CAP theorem with example cases in this insightful article.
SQL vs NoSQL Use Cases
SQL databases are preferred when scalability requirements are not very large. This simply means it won’t support concurrent requests from a large number of users such as those in big data applications.
Big data applications demand storage of huge sized and highly varied data that arrives very frequently on databases. These applications require processing of both structured and unstructured data as well as require high scalability needs.
For big data applications, NoSQL databases have immense use cases and are preferred over SQL based solutions.
Quite surprisingly, today we see some unique database solutions that leverage the SQL language to query ‘big data’ stored across the distributed systems in the cloud. Examples include Snowflake’s relational database that is scalable as well as capable of storing semi-structured data.
Learn more about Snowflake’s unique approach in this comprehensive article.
Databases
Today the old SQL based databases have started to invent NoSQL like features to compete against the rising technology.
We call it ‘Combined Strength’ that uses the good points of both technologies to enable rich and more flexible database experience.
Today MySQL of Oracle has evolved to support semi-structured data such as JSON and document based files along with support for horizontal scaling
Meanwhile, on the non-relational end, NoSQL databases such as MongoDB also offer relational features such as indexing, aggregation queries, and ACID compliance in its document based data format.
Moreover, the noSQL databases have increasingly adopted a SQL-based syntax for attracting data analysts and data scientists who have extensive SQL experience and limited programing knowhow.
Adding to that, Cassandra has CQL, Spark developed SparkQL, and JIRA developed JQL.
Although the NoSQL databases have a lot to offer through its support for programming languages, building a SQL-like support can empower those with SQL know-how to use the best of their knowledge.
Conclusion
The SQL vs. NoSQL debate has evolved from a clear-cut dichotomy to a more nuanced understanding of their strengths and weaknesses. Modern databases often blend elements of both approaches, offering flexibility and scalability.
Dicecamp's Data Engineering Course Using SQL Server Tools could be a valuable resource for individuals looking to master SQL and its applications in the modern data landscape. By focusing on SQL Server tools, the course likely equips students with practical skills to work with relational databases and potentially explore their integration with NoSQL technologies.
Would you like to learn more about specific SQL Server tools or how they can be used in conjunction with NoSQL databases.
0 notes
Text
Creating an Effective Power BI Dashboard: A Comprehensive Guide

Introduction to Power BI Power BI is a suite of business analytics tools that allows you to connect to multiple data sources, transform data into actionable insights, and share those insights across your organization. With Power BI, you can create interactive dashboards and reports that provide a 360-degree view of your business.
Step-by-Step Guide to Creating a Power BI Dashboard
1. Data Import and Transformation The first step in creating a Power BI dashboard is importing your data. Power BI supports various data sources, including Excel, SQL Server, Azure, and more.
Steps to Import Data:
Open Power BI Desktop.
Click on Get Data in the Home ribbon.
Select your data source (e.g., Excel, SQL Server, etc.).
Load the data into Power BI.
Once the data is loaded, you may need to transform it to suit your reporting needs. Power BI provides Power Query Editor for data transformation.
Data Transformation:
Open Power Query Editor.
Apply necessary transformations such as filtering rows, adding columns, merging tables, etc.
Close and apply the changes.
2. Designing the Dashboard After preparing your data, the next step is to design your dashboard. Start by adding a new report and selecting the type of visualization you want to use.
Types of Visualizations:
Charts: Bar, Line, Pie, Area, etc.
Tables and Matrices: For detailed data representation.
Maps: Geographic data visualization.
Cards and Gauges: For key metrics and KPIs.
Slicers: For interactive data filtering.
Adding Visualizations:
Drag and drop fields from the Fields pane to the canvas.
Choose the appropriate visualization type from the Visualizations pane.
Customize the visual by adjusting properties such as colors, labels, and titles.
3. Enhancing the Dashboard with Interactivity Interactivity is one of the key features of Power BI dashboards. You can add slicers, drill-throughs, and bookmarks to make your dashboard more interactive and user-friendly.
Using Slicers:
Add a slicer visual to the canvas.
Drag a field to the slicer to allow users to filter data dynamically.
Drill-throughs:
Enable drill-through on visuals to allow users to navigate to detailed reports.
Set up drill-through pages by defining the fields that will trigger the drill-through.
Bookmarks:
Create bookmarks to capture the state of a report page.
Use bookmarks to toggle between different views of the data.

Different Styles of Power BI Dashboards Power BI dashboards can be styled to meet various business needs. Here are a few examples:
1. Executive Dashboard An executive dashboard provides a high-level overview of key business metrics. It typically includes:
KPI visuals for critical metrics.
Line charts for trend analysis.
Bar charts for categorical comparison.
Maps for geographic insights.
Example:
KPI cards for revenue, profit margin, and customer satisfaction.
A line chart showing monthly sales trends.
A bar chart comparing sales by region.
A map highlighting sales distribution across different states.
2. Sales Performance Dashboard A sales performance dashboard focuses on sales data, providing insights into sales trends, product performance, and sales team effectiveness.
Example:
A funnel chart showing the sales pipeline stages.
A bar chart displaying sales by product category.
A scatter plot highlighting the performance of sales representatives.
A table showing detailed sales transactions.
3. Financial Dashboard A financial dashboard offers a comprehensive view of the financial health of an organization. It includes:
Financial KPIs such as revenue, expenses, and profit.
Financial statements like income statement and balance sheet.
Trend charts for revenue and expenses.
Pie charts for expense distribution.
Example:
KPI cards for net income, operating expenses, and gross margin.
A line chart showing monthly revenue and expense trends.
A pie chart illustrating the breakdown of expenses.
A matrix displaying the income statement.
Best Practices for Designing Power BI Dashboards To ensure your Power BI dashboard is effective and user-friendly, follow these best practices:
Keep it Simple:
Avoid cluttering the dashboard with too many visuals.
Focus on the most important metrics and insights.
2. Use Consistent Design:
Maintain a consistent color scheme and font style.
Align visuals properly for a clean layout.
3. Ensure Data Accuracy:
Validate your data to ensure accuracy.
Regularly update the data to reflect the latest information.
4. Enhance Interactivity:
Use slicers and drill-throughs to provide a dynamic user experience.
Add tooltips to provide additional context.
5. Optimize Performance:
Use aggregations and data reduction techniques to improve performance.
Avoid using too many complex calculations.
Conclusion Creating a Power BI dashboard involves importing and transforming data, designing interactive visuals, and applying best practices to ensure clarity and effectiveness. By following the steps outlined in this guide, you can build dashboards that provide valuable insights and support data-driven decision-making in your organization. Power BI’s flexibility and range of visualizations make it an essential tool for any business looking to leverage its data effectively.
#Dynamic Data Visualization#Business Analytics#Interactive Dashboards#Data Insights#Data Transformation#KPI Metrics#Real-time Reporting#Data Connectivity#Trend Analysis#Visual Analytics#Performance Metrics#Data Modeling#Executive Dashboards#Sales Performance#Financial Reporting#Data Interactivity#Data-driven Decisions#Power Query#Custom Visuals#Data Integration
0 notes
Text
re: tags on that other post
the most bullshit column to deal with in our database is the one that contains sales order modifications. so when the order description is changed, there's a stupid little HTML formatted old value and new value in this column.
normally this sort of thing is saved in json format, which is easy to work with. but someone tried to do a sneaky workaround here to avoid making our website do this so now I have to deal with bullshit.
btw every value type has a header to label it, and when multiple value types are edited in one go multiple stupid little tables are contained in the html and appear together as a single value.
what makes this suck the worst is that line item changes/reductions are in this mess. there can be upward of a dozen per edit which makes individual SQL values difficult to review and compare. this is how our sales team fucks us. they reduce item qtys or swap items with other items. then we have unallocated crap on hand. the sales team will then lie and says they didn't do anything that would create excess inventory.
when an item is completely removed from an order there's no way to link the excess inventory back to that order btw. the part number might exist somewhere in the order edit data, but this is not searchable. the little tables are collapsed by default as well, open in small bubbles on the page when "expand details" is clicked, and opening an additional detail bubble closes the first
limited visibility of multiple edits and the difficulty in comparing edits makes it easy for sales to do this bullshit where they have like one order for 500 units of something and then claim they split that into 17 smaller orders. but if you actually check where allocations went, the original order was reduced by all 500 units yet the 17 new orders only contained 400 units total.
they just hope that the confusion of 17 individual edits over a period of 2 or so days makes things too hard for anyone to fact check. then they say they did everything perfectly, supply chain is just bad at their jobs and ordered too much. (really the customer wanted to cancel 100 units despite being long past the cancellation window so the sales team did this shit just to keep them happy even if it screws over the company).
at least I have a way to display order edits cleanly in excel now. but I'm the only one who knows how to do this, so I'm dragged into this shit and my time is wasted every time there's unexpected excess inventory.
1 note
·
View note
Text
ORACLE APEX GRAPH

Oracle APEX Graphs: Visualize Your Data with Ease
Oracle APEX (Application Express) is a fantastic low-code development platform for creating web applications with Oracle databases. One of its powerful features is the ability to create visually appealing and informative graphs directly within your applications. In this blog post, we’ll delve into the world of Oracle APEX graphs, exploring what they are and why you should consider using them.
What are Oracle APEX Graphs?
Oracle APEX Graphs are built using Oracle JET (JavaScript Extension Toolkit) data visualization components. They offer a variety of chart types to suit your data presentation needs, including:
Bar Charts: Perfect for comparing values across categories.
Line Charts: Ideal for showcasing trends over time.
Pie Charts: Excellent for displaying proportions or parts of a whole.
Scatter Charts: These are useful for visualizing the relationship between two variables.
Combination Charts: This allows you to combine multiple chart types for sophisticated visualization.
And more!
Why Use Oracle APEX Graphs
Here’s why Oracle APEX graphs are a great addition to your applications:
Ease of Use: You can create graphs directly within the APEX development environment with minimal coding. Use SQL queries to define your data source.
Customization: APEX graphs are highly customizable. You can adjust colors, legends, labels, axis formatting, and more to tailor the visuals to your preferences.
Interactivity: Users can interact with your graphs by hovering for details, zooming, panning, and sometimes even filtering data directly on the graph.
Integration: Graphs integrate seamlessly into your APEX applications, enriching data presentation and aiding decision-making.
Getting Started with Oracle APEX Graphs
Here’s a basic outline of how to create a graph in APEX:
Create a Chart Region: In your APEX page, add a new region and select the ‘Chart’ region type.
Select Chart Type: Choose the desired chart type from the options available.
Define Data Source: Specify a SQL query that fetches the data you want to visualize.
Map Data: Map columns from your query result set to the appropriate chart elements (e.g., X-axis, Y-axis, series).
Customize: Adjust the chart’s appearance, labels, formatting, and other attributes.
Example: Creating a Sales Trend Graph
Let’s imagine you want to visualize your monthly sales trends. Here’s a sample SQL query and the setup process:
SQL
SELECT to_char(order_date, ‘Y-MM’) as month_year,
SUM(order_total) as total_sales
FROM orders
GROUP BY to_char(order_date, ‘Y-MM’)
ORDER BY month_year;
Use code with caution.
content_copy
Within your APEX chart region, you’d:
Select ‘Line Chart’ as the chart type.
Use the SQL query as your data source.
Map the month_year column to the X-axis and total_sales to the Y-axis.
Beyond the Basics
Oracle APEX graphs offer much more than this simple introduction. You can delve into advanced features like:
Multiple Series: Display numerous data sets within a single chart.
Drill-Downs: Allow users to drill down into specific data points for more details.
Graph Plug-in: The APEX Graph Visualization plug-in can access network graphs and other specialized chart types.
Transform Your Data With Oracle APEX Graphs
If you’re building applications with Oracle APEX, embrace the power of graphs. They add a new dimension to your data presentations, making complex information easier to understand and enabling better decision-making insights.
youtube
You can find more information about Oracle Apex in this Oracle Apex Link
Conclusion:
Unogeeks is the No.1 IT Training Institute for Oracle Apex Training. Anyone Disagree? Please drop in a comment
You can check out our other latest blogs on Oracle Apex here – Oarcle Apex Blogs
You can check out our Best In Class Oracle Apex Details here – Oracle Apex Training
Follow & Connect with us:
———————————-
For Training inquiries:
Call/Whatsapp: +91 73960 33555
Mail us at: [email protected]
Our Website ➜ https://unogeeks.com
Follow us:
Instagram: https://www.instagram.com/unogeeks
Facebook: https://www.facebook.com/UnogeeksSoftwareTrainingInstitute
Twitter: https://twitter.com/unogeeks
0 notes
Text
ORACLE APEX 22.2

Oracle APEX 5.1: Building Modern Web Applications with Ease
Oracle Application Express (APEX) is a robust low-code development environment designed to help developers quickly build sophisticated, data-driven web applications. Version 5.1 further refined the APEX experience, introducing exciting features and improvements. Let’s dive into what makes APEX 5.1 stand out.
Exciting Capabilities Introduced in APEX 5.1
Interactive Grids: This powerful new component revolutionizes your interaction with tabular data. It provides inline editing, column sorting, filtering, row actions, and much more—directly within your web application.
Universal Theme: Thanks to its new Universal Theme, APEX 5.1 features a modern, responsive design. Your applications seamlessly adapt to different screen sizes, ensuring an optimal user experience across desktop, tablet, and mobile devices.
Faceted Search: This feature empowers users to refine search results more quickly. It allows intuitive filtering based on multiple criteria, providing a more guided browsing experience.
Enhanced Page Designer: The Page Designer interface received a significant revamp in version 5.1. This upgrade offers a more intuitive and streamlined approach to application development.
Packaged Applications: APEX 5.1 includes new and improved packaged applications. These productivity-focused apps serve as excellent starting points or can inspire your own custom creations.
Why Choose APEX 5.1?
Rapid Development: APEX’s low-code approach accelerates development time significantly compared to traditional programming frameworks. You work primarily with visual tools and wizards, reducing the need to write extensive code.
Built on Oracle Database: APEX runs natively within the Oracle Database. This tight integration leverages SQL and PL/SQL power while ensuring maximum performance, security, and scalability.
Cost-Effective: APEX is included in the Oracle Database license. This provides tremendous value, eliminating the need for additional middleware or costly development tools.
Highly Customizable: Although APEX streamlines development, it doesn’t restrict your creativity. You can easily tailor applications with custom code and integrate external JavaScript libraries.
Considerations
Database Dependency: APEX is built on the Oracle Database, so your application will be tied to this platform.
Learning Curve: While APEX simplifies development, some familiarity with database concepts, SQL, and PL/SQL is beneficial for making the most of the framework.
Conclusion
Oracle APEX 5.1 is a compelling choice for efficient web application development, primarily where your data resides in an Oracle Database. Its ease of use, rich features, and integration with Oracle technologies make it an attractive option for businesses of all sizes.
youtube
You can find more information about Oracle Apex in this Oracle Apex Link
Conclusion:
Unogeeks is the No.1 IT Training Institute for Oracle Apex Training. Anyone Disagree? Please drop in a comment
You can check out our other latest blogs on Oracle Apex here – Oarcle Apex Blogs
You can check out our Best In Class Oracle Apex Details here – Oracle Apex Training
Follow & Connect with us:
———————————-
For Training inquiries:
Call/Whatsapp: +91 73960 33555
Mail us at: [email protected]
Our Website ➜ https://unogeeks.com
Follow us:
Instagram: https://www.instagram.com/unogeeks
Facebook: https://www.facebook.com/UnogeeksSoftwareTrainingInstitute
Twitter: https://twitter.com/unogeeks
0 notes
Text
Merging in Data Analyst
Data Analyst Course Online, Merging, or data merging, is a critical process in data analysis where multiple datasets are combined to create a unified and comprehensive dataset. This is often necessary because data may be collected and stored in different sources or formats. Here's an overview of data merging in data analysis:
Why Data Merging is Important:
Completeness: Merging data from various sources can help fill gaps and provide a more complete picture of the phenomenon or topic being studied.
Enrichment: Combining different datasets can enhance the information available for analysis by adding new variables or dimensions.
Comparative Analysis: Merging allows for the comparison of data from different sources, such as sales data from multiple regions or years.
Common Methods of Data Merging:
Joining: In relational databases and tools like SQL, merging is often achieved through joins. Common join types include inner join, left join, right join, and full outer join. These operations link rows in one dataset with rows in another based on a specified key or common attribute.
Concatenation: When merging datasets with the same structure vertically, concatenation is used. This is common in scenarios where data is collected over time and stored in separate files or tables.
Merging in Statistical Software: Tools like R and Python offer functions (e.g., merge() in R or pd.merge() in Python) that facilitate dataset merging based on specified keys or columns.
Data Integration Tools: For large and complex data integration tasks, specialized data integration tools and platforms are available, which offer more advanced capabilities for data merging and transformation.
Challenges in Data Merging:
Data Consistency: Inconsistent data formats, missing values, or conflicting information across datasets can pose challenges during merging.
Data Quality: Data quality issues in one dataset can affect the quality of the merged dataset, making data cleaning and preprocessing crucial.
Key Identification: Identifying the correct keys or columns to merge datasets is essential. Choosing the wrong key can result in incorrect merging.
Data Volume: Merging large datasets can be computationally intensive and may require efficient techniques to handle memory and performance constraints.
Data merging is a fundamental step in data analysis, as it allows analysts to work with a more comprehensive dataset that can yield deeper insights and support informed decision-making. However, it requires careful planning, data preparation, and attention to data quality to ensure accurate and meaningful results.
0 notes
Text
What are joins in SQL?
Structured Query Language (SQL) is a widely used language for managing and querying databases. One of the fundamental concepts in SQL is the "join" operation. Joins allow us to combine data from multiple tables based on common columns, enabling powerful data analysis and retrieval capabilities. In this blog post, we will explore the world of SQL joins, understand their types, and discover how they can unlock the full potential of database relationships.
What is a Join?
A join in SQL is an operation that combines rows from two or more tables based on a related column between them. It allows us to fetch data from multiple tables as if they were a single unified table. By utilizing joins, we can create meaningful connections and retrieve data that spans across different entities within a database.
Types of Joins
Inner Join:
The inner join returns only the matching rows between the tables involved. It selects records where the join condition is satisfied in both tables. In other words, it returns the intersection of the two tables. Inner joins are commonly used when we want to combine data that exists in both tables.
Left Join:
The left join returns all the rows from the left table and the matching rows from the right table. If there is no match, it includes NULL values for the right table's columns. This type of join ensures that all records from the left table are included, regardless of whether they have corresponding matches in the right table.
Also Read: What are the 10 Most Important SQL Interview Questions?
Right Join:
The right join is the opposite of a left join. It returns all the rows from the right table and the matching rows from the left table. If there is no match, it includes NULL values for the left table's columns. Right joins are less commonly used than left joins but are essential in scenarios where the right table's data is of primary importance.
Full Outer Join:
The full outer join combines the results of both the left and right joins. It returns all the rows from both tables, including unmatched records from both sides. If a match exists, the join operation links the corresponding rows; otherwise, it includes NULL values for the non-matching columns.
Cross Join:
The cross join, also known as a Cartesian join, produces the Cartesian product of the two tables. It returns all possible combinations of rows between the two tables, resulting in a large result set. Cross joins can be resource-intensive and should be used with caution.
Self Join:
A self join is a join operation performed on a single table. It allows us to establish a relationship between different rows within the same table. Self joins are useful when we need to compare records or retrieve hierarchical information from a single table.
How to Use Joins
To utilize joins effectively, we must define the relationship between tables using appropriate columns. These columns act as the bridge that connects the tables together. The join condition is typically specified in the ON clause, where we define the matching criteria based on common columns.
SELECT orders.order_id, customers.customer_name FROM orders INNER JOIN customers ON orders.customer_id = customers.customer_id;
In this example, we are selecting the order ID and the customer name by joining the "orders" and "customers" tables based on the common column "customer_id."
Conclusion
Joins in SQL empower us to combine data from multiple tables, enabling powerful data analysis and retrieval capabilities. By understanding the different types of joins, such as inner join, left join, right join, full outer join, cross join, and self join, we can manipulate data efficiently and establish meaningful relationships between tables.
Being well-versed in SQL joins is essential for success in database management and data analysis roles. When preparing for sql interview questions, it is crucial to practice writing queries involving joins and understand the nuances of each join type. By mastering joins, you'll be well-equipped to tackle SQL interview questions and showcase your proficiency in working with complex data structures.
0 notes
Text
Why Should You Migrate Database SQL Server to Snowflake
The focus of today’s data-driven business ecosystem is to a great extent on formatting, processing, and analyzing terabyte volumes of data, both from within the organization and externally. Hence, the goal is not only to ensure efficiency but also to operate the databases at minimum costs. One of the best ways to do so is to move databases from traditional in-house systems to the cloud. A method that is very favored among users is migrating databases from SQL Server to Snowflake.
The point now is why Snowflake and what does this cloud-based data warehousing solution bring to the table? It is primarily because soon after its launch, Snowflake was able to solve a whole lot of problems that the then databases faced. This aspect along with the many benefits of this cloud-based platform makes organizations want to shift their databases from SQL Server to Snowflake.
Here are some of the benefits of Snowflake.
· A wide range of cloud vendors is supported by Snowflake as its architecture is compatible with them. Hence, users do not have to use separate tools to work in one or all of them.
· In traditional databases, computing and storage facilities were in one silo, making it very difficult to estimate the cost of operating any one of them. In Snowflake, they are maintained separately, and hence, it is very easy to estimate the costs of operations of any one of them individually. Further, users can seamlessly scale up and down in data storage facilities by paying only for the quantum of resources used. When compared to previous databases that charged flat fees, this aspect is a huge cost-saving option and a motivation for wanting to move databases from SQL Server to Snowflake.
· Apart from unlimited storage space, Snowflake offers high computing powers. Users do not face any drop in speeds or performance lag even when multiple users carry out several intricate queries simultaneously. This, coupled with storage-on-call make Snowflake a popular data warehousing option.
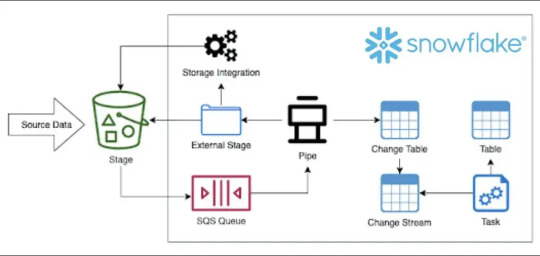
· A critical benefit provided by Snowflake and a reason for organizations to migrate databases from SQL Server to Snowflake is that data in any form can be stored in this data warehousing platform. It includes data in its native format – unstructured, semi-structured, or structured – an attribute that is not present in other databases. Snowflake also offers built-in support to JSON, Parquet, Avro, and XML data.
· A major advantage of Snowflake is that the platform provides support for clustering data and there is no need for defining indexes. Some tasks like computing and encoding of columns are carried out automatically. However, users have to manually use the clustering keys of Snowflake to co-locate table data of very large tables.
These are reasons why this data warehousing solution encourages businesses to migrate databases from SQL Server to Snowflake.
4 notes
·
View notes
Text
Top Sql Interview Questions And Responses
It offers its own query language (Hibernate Inquiry Language/ HQL) that fills out where SQL fails when handling items. Candidates are nearly assured to be asked a series of inquiries related to a acquiring data from a supplied set of tables. It is a collection of schemas, tables, procedures, code functions, and also various other objects. Different query languages are utilized to gain access to and also adjust information. In SQL Web server, a table is an item that stores information in a tabular kind. Here is a checklist of the most prominent SQL Server interview inquiries and also their answers with thorough explanations and SQL query examples. MERGE statement is utilized to integrate insert, erase and also update operations into one declaration. A Trigger is a Data source object similar to a kept treatment or we can state it is a special kind of Stored Procedure which fires when an event takes place in a database. It is a data source item that is bound to a table and is implemented automatically. Triggers give information honesty as well as used to accessibility and check information before as well as after modification utilizing DDL or DML query. Normalization is the procedure of organizing data into a related table. It also gets rid of redundancy as well as increases stability which improves the efficiency of the query. To stabilize a data source, we separate the data source right into tables and develop connections in between the tables. Several columns can join the main trick. The primary secret is the column or set of columns utilized to distinctly recognize the products in a table. A international secret is utilized to distinctively determine the items in a different table, enabling sign up with procedures to happen. An Index is an optional structure related to a table. It is made use of to accessibility rows directly as well as can be created to raise the efficiency of information retrieval. The index can be developed on one or more columns of a table. DML enables you to collaborate with the information that enters into the data source. It is additionally utilized to synchronize two tables and make the adjustments in one table based on worths matched from one more. SQL stipulation is used to filter some rows from the whole collection of records with the help of different conditional statements. A version is a container for all things that define the structure of the master data. A design consists of at the very least one entity, which is comparable to a table in a relational database. An entity contains participants, which resemble the rows in a table, as shown in Figure 7-1. Members are the master information that you are taking care of in MDS. Each leaf participant of the entity has multiple characteristics, which represent table columns in the example. Now to develop 3 tables in the Master data source called Table1, Table2, as well as Table3. Information Control Language commands adjust data saved in items like tables, views and so forth. Or else, all documents in the table will certainly be updated. But you can not start until the called for example information is not in position. The one-of-a-kind secret is the team of one or more areas or columns that distinctively identifies the data source document. The unique secret coincides as a main essential however it approves the void worth. Although it isn't clearly essential to recognize the internal functions of data sources, it assists to have a high level understanding of standard ideas in Data sources and also Systems. Data sources refers not to particular ones yet more so how they run at a high degree and also what style decisions and also compromises are made throughout construction as well as inquiring. " Solutions" is a wide term but describes any collection of structures or tools whereby evaluation of huge quantities of data relies on. You can take a look at the tables below that we've offered technique. So first of all, you need to develop the examination information in your database software application. But the solution to such concerns from SQL interviews ought to be more in-depth. Clear up later UPDATEwhich documents should be updated. For example, a usual interview topic is the MapReduce structure which is greatly used at lots of business for parallel processing of big datasets. The CREATE TABLE statement is used to create a brand-new table in a data source. It is an vital command when developing brand-new database. A stabilized database is usually composed of numerous tables. Joins are, for that reason, required to query throughout multiple tables. The UPDATE statement is used to customize the existing documents in a table as well as is just one of one of the most pre-owned operations for dealing with the data source. Hibernate is an object-relational mapping library that takes Java things and also maps them into relational database tables. So, an SQL join is a device that allows you to build a partnership in between objects in your database. As a result, a sign up with shows a outcome collection consisting of areas derived from two or more tables. SQL is an acronym for Structured Query Language. It is a programs language especially made for working with data sources. An internal join is when you integrate rows from 2 tables as well as produce a result collection based upon the predicate, or joining problem. The internal join only returns rows when it finds a match in both tables. An external join will certainly additionally return unrivaled rows from one table if it is a single external sign up with, or both tables if it is a complete outer sign up with. With the help of these commands, you can conveniently change, insert as well as erase your information. Using these commands, you can develop any items like tables, sights, databases, causes, and so on. An index is a data source object that is created and maintained by the DBMS. Indexed columns are bought or sorted to make sure that information looking is extremely quick. An index can be put on a column or a sight. The clustered index specifies the order in which data is literally kept in a database table as well as made use of for simple retrieval by modifying the manner in which the records are stored. As the name indicates, sign up with is the name of incorporating columns from one or several tables by using common values per. Whenever the signs up with are utilized, the tricks play a vital role. DML is used to place, choose, update, and erase records in the data source. The driver is UPDATEused to customize existing documents. The MERGE declaration permits conditional upgrade or insertion of information into a database table. It executes an UPDATE if the rows exists, or an INSERT if the row does not exist. https://geekinterview.net
You can try placing values to go against these problems as well as see what takes place. Several columns can participate in the primary crucial column. After that the individuality is thought about among all the individual columns by combining their worths. Most tasks in MDS revolve around models as well as the objects they consist of. A strong instance of this will plainly show the distinction and also show just how well the programmer recognizes signs up with. With more business depending on huge data analytics than in the past, employees with strong SQL abilities are very searched for. SQL is utilized in several tasks such as business analysts, software application designer, systems managers, data scientists, and a lot more. Currently, this column does not permit void worths and duplicate values.
1 note
·
View note