#data prediction
Explore tagged Tumblr posts
Visit Tumblr Blog
Explore Tumblr blogs with no restrictions, modern design and the best experience.
Last Seen Tumblr Blogs


Fun Fact
Tumblr has been banned in Indonesia for providing people with access to pornographic content.
Text
How to Install Analyser Max: Step-by-Step Guide for Smarter Predictions!
📊 Analyser Max is here to revolutionize how you predict outcomes in games and manage financial investments. This tool provides real-time insights and powerful forecasting with an easy-to-follow installation process. 🔧 In this video, we’ll guide you on how to install Analyser Max on your Android device. Whether you’re looking to make better financial decisions or improve your predictions in color-based games, Analyser Max is the solution! 🔗 Install it now: https://analysermax.onl/
#AnalyserMax#InstallTutorial#PredictionTool#FinancialAnalysis#AIAnalysis#GamingTools#SmartInvesting#analytics#data prediction#prediction
0 notes
Text
I don’t have a posted DNI for a few reasons but in this case I’ll be crystal clear:
I do not want people who use AI in their whump writing (generating scenarios, generating story text, etc.) to follow me or interact with my posts. I also do not consent to any of my writing, posts, or reblogs being used as inputs or data for AI.
#not whump#whump community#ai writing#beans speaks#blog stuff#:/ stop using generative text machines that scrape data from writers to ‘make your dream scenarios’#go download some LANDSAT data and develop an AI to determine land use. use LiDAR to determine tree crown health by near infrared values.#thats a good use of AI (algorithms) that I know and respect.#using plagiarized predictive text machines is in poor taste and also damaging to the environment. be better.
292 notes
·
View notes
Text


[Image ID: There are three images. The first one is similar to a title card and shows a screenshot froom the show supernatural. Dean and Castiel stand facing each other. The screenshot is faded and superimposed with a blue background from a news show. In the front is a logo which says 'Destiel News Channel'. The second is a screenshot of Castiel from the same confession scene. At the bottom is a headline which reads 'Irish Unification?' and a subline which says 'Let's hope this Star Trek prediction comes true'. The top right corner shows a screenshot from Star Trek. It shows Data (an android in a yellow uniform with pale skin) talking to Picard, who is wearing a red uniform and is shown from behind. Subtitles read 'the Irish Unification of 2024,'. The third image is a screenshot of Dean from the same scene edited so that a text looking like subtitles spells out 'I love you'. /End ID]
Happy New Year y'all!
#predictions#star trek#star trek next gen#star trek picard#star trek data#ireland#irish unification#irish politics#destiel#destiel news channel#destiel meme#2024#queued#happy new year#new year
478 notes
·
View notes
Text
They're taking all our government data to train AI's
#doge#politics#conspiracy#intuition#elon musk#trump#fuck trump#fuck elon musk#fuck jeff bezos#fuck mark zuckerberg#fuck google#fuck the system#doom scrolling#prediction#I'm thinking they made a deal telling trump they would make american ai the most powerful by training it on America's government data#thats why musk was allowed in all these agencies#to steal the data#to train#ai#so they could supposedly create an ai that can advise and govern#edward snowden
24 notes
·
View notes
Text
wait i wanna cause problems on purpose too (inspired by @commanderofthegrey's poll on the architect vs. solas)
#anders#solas#dragon age#da2#da:i#i have my own predictions for this but i wanna collect the data. for Science#these two also have very similar goals and chaotic executions of those goals#the main difference is scale and who is directly helped/harmed#i love problematic men sorry
26 notes
·
View notes
Text
y'all stop saying fyodor has never looked so sincerely angry before. he has.
I know this because, and this is not an exaggeration, the vast majority of my manga revisits are to enjoy his expressions of anger, disdain, and malcontent. i shit you not, several of my bsd meta posts wholly unrelated to fyodor were written because I happened to notice something else while flipping through to imbibe fedya's hissy fits. I don't reread the manga when I do this, just those scenes, unless something else catches my attention.
anyway, stop disrespecting my beloved pastime.
#bsd#bungou stray dogs#bsd fyodor#most people are remarkably bad at reading expressions#not me though#this isnt a bit i fixated on how emotions are nonverbally communicated so that i could lie better and to develop a pleading face#for most of elementary school i studied people's faces and workshopped my own by getting feedback from others and testing them in the field#then in 8th grade my gifted program teacher made us take an assessment on how well we could read faces#to debunk body language expertise#and demonstrate the fact that most people think they can read faces but most of us cant#emphasizing why trials and presumptions based on assumptions that we can are harmful#everyone predictably failed real hard#except for me. i made an 80%#my teacher made me take it again and explain to her my process.#then she asked where i learned it and i explained to her that i never got stickers at naptime in kindergarten because i never slept#so i began obsessively refining my fake sleep#it took months but i figured out how to coordinate all of the tells and it worked i started getting stickers#so then i started to practice other states of mind#and she marked me an outlier and removed me from the data 😭#anyway. all im saying is. i love fedya's face.
36 notes
·
View notes
Text

bonus horse brought to you by mental illness today
#sometimes you start to feel like your skin fits very poorly and you gotta go do something to ignore it right#and sometimes a nice shittily drawn pegasus will do the trick#bonus horse#i like how i can use this blog as an indicator of mental illness acting up actually#good to use as data to predict the next time my brain will make my life a shit show i guess
12 notes
·
View notes
Text
I've Seen the Triangle
#i have to do a two-day procedure to process my data enough to be able to check whether the positive control for a given experiment worked#if it didn't i have to throw out everything i collected that week#if it did work then when i graph it it makes a nice blue right triangle on the graph.#today i have seen the triangle#box opener#this is especially nice because i was up until 1am last night to get as much data as possible formatted for the overnight step#and then it crashed halfway which is. predictable#but i got the first half! and my last dataset of the week's positive control was in that first half! so i Have The Triangle!!!
17 notes
·
View notes
Text
I do genuinely hate how trusting simple shit on the internet is starting to become a russian roulette game. Even if AI wasn't based on maybe one of the biggest heists of human history, it would still be a massive L to the culture that we are expected to become paranoid about any interaction we have with other human beings, our appreciation for art, our trust of the images we see, etc. This is just making everything so much worse, and there is no justification for it that holds any water.
#thoughts#fuck generative content#I unfortunately do predict the internet will become borderline unusable in less than 10 years if that's not managed real fast#like that will murder social media or the concept of internet as something social#why would you want to wander a ghost town full of information you can't trust and people who aren't real#all of those trying to suck even more of your soul to create more ghouls hellbent on harassing you and take money/data from you#and prevent you from getting actual human connection#like at some point you are going to self-cannibalize#and it's going to be a stupid ass tragedy and none of the people responsible will ever be held accountable#it's hard to be enthusiastic about the world and life and the future in goddamn 2024!!#when literally everything good and interesting about humanity and the natural world is being systematically destroyed!!#anyway.
21 notes
·
View notes
Text
Apparently I'm doing something right because even with the market crashes, my investment portfolio has ONLY gained value since the beginning of the year, what the fuck man
#the answer is that I play stocks the same way I play politics and actually consider economic data OUTCOME rather than INPUT data#so instead of reading market trends or stock exchange reports or stockholder meeting minutes#I read about the ethnographic socio-cultural data and try to predict which investments are about to rise based on that#i am.....very good at this.
11 notes
·
View notes
Text
How to Download Analyser Max: Your Key to Smarter Predictions and Financial Planning!
📈 Analyser Max is the ultimate tool for predicting game outcomes and improving your financial strategies. This tool provides real-time insights, AI-driven forecasts, and graphical data representations to help you make informed decisions. 🔧 In this video, we’ll show you how to easily download Analyser Max and start leveraging its advanced data analysis tools for accurate predictions and better investments. 🔗 Download Analyser Max today and get started with smarter forecasting: https://analysermax.onl/
#AnalyserMax#AIAnalysis#DataAnalytics#FreeGame#FinancialTools#PredictionSoftware#MobileApps#SmartInvesting#GameEnhancement#analytics#data prediction#prediction
1 note
·
View note
Text
WOOO now that i'm done with my rewatch i can post my little side project :]
below the cut is my personal record of invincible's rate of adaptation with episodes vs issues and pages bc im super normal about this kind of stuff (not fussing too much with it so some pages might slip through the cracks here and there):
SEASON ONE
s1 episode 1: #1 (19 pages), #2 (9 pages), #6 (3 pages), #7 (21 pages), #16 (2 pages)
TOTAL ADAPTED: 54 pages from 5 different issues
s1 episode 2: #2 (7ish pages), #3 (16 pages), #4 (3 pages), #5 (21 pages), #8 (1 page), #14 (5 pages)
TOTAL ADAPTED: 53 pages from 6 different issues
s1 episode 3: #6 (2 pages), #8 (14 pages), #9 (13 pages), #10 (7 pages), #21 (1 page)
TOTAL ADAPTED: 37 pages from 5 different issues
s1 episode 4: #15 (2 pages), #18 (18 pages), #21 (2 pages), #25 (2 pages), #26 (2 pages)
TOTAL ADAPTED: 26 pages from 5 different issues
s1 episode 5: #14 (1 page), #18 (5 pages), #19 (16 pages), #30 (1 page)
TOTAL ADAPTED: 23 pages from 4 different issues
s1 episode 6: #6 (13 pages), #8 (3 pages), #20 (15 pages), #21 (2 pages), #22 (9 pages), #25 (2), #30 (1 page), #31 (4 pages), #32 (1 page), #36 (9 pages), #37 (7 pages)
TOTAL ADAPTED: 66 pages from 11 different issues
s1 episode 7: #9 (3 pages), #10 (9 pages), #26 (1 page), #34 (6 pages), #35 (2 pages)
TOTAL ADAPTED: 21 pages from 5 different issues
s1 episode 8: #11 (21 pages), #12 (20 pages), #13 (20 pages), #14 (7ish pages), #22 (1 page)
TOTAL ADAPTED: 69 pages from 5 different issues
(season total 349 pages)
SEASON TWO
s2 episode 1: #13 (1 page), #14 (3 pages), #16 (11 pages), #17 (3 pages), #18 (1 page), #20 (1 page), #21 (1 page), #22 (1 page), #24 (16 pages)
TOTAL ADAPTED: 38 pages from 9 different issues
s2 episode 2: #9 (2 pages), #14 (2 pages), #15 (12 pages), #17 (3 pages), #19 (3 pages), #21 (12 pages), #22 (1 page), #25 (1 page), #31 (4 pages), #38 (2 pages)
TOTAL ADAPTED: 42 pages from 10 different issues
s2 episode 3: #20 (3 pages), #23 (20 pages), #24 (1 page), #25 (14 pages), #36 (1 page), #37 (2 pages)
TOTAL ADAPTED: 41 pages from 6 different issues
s2 episode 4: #26 (16 pages), #27 (10 pages), #28 (15 pages), #29 (17 pages)
TOTAL ADAPTED: 58 pages from 4 different issues
s2 episode 5: #22 (4 pages), #28 (7 pages), #29 (1 page), #30 (16 pages), #31 (9 pages) #38 (6 pages), #39 (17 pages), #40 (19 pages)
TOTAL ADAPTED: 79 pages from 8 different issues
s2 episode 6: #24 (2 pages), #28 (3 pages), #35 (15 pages), #41 (16 pages), #43 (13 page)
TOTAL ADAPTED: 49 pages from 5 different issues
s2 episode 7: #10 (2 pages), #25 (4 pages), #32 (3 pages), #37 (4 pages), #38 (3 pages), #41 (2 pages), #43 (1 page), #44 (10 pages), #45 (13 pages), #47 (2 pages), #48 (2 pages),
TOTAL ADAPTED: 46 pages from 11 different issues
s2 episode 8: #33 (20 pages), #34 (14 pages), #43 (2 pages), #45 (2 pages), #46 (5 pages), #47 (2 pages)
TOTAL ADAPTED: 45 pages from 6 different issues
(season total 398 pages)
#may or may not use this data to try and get a more accurate season count prediction eventually#invincible#willow whispers
20 notes
·
View notes
Note
hi peanut!!! just wanted to tell you that I REALLY REALLY like your art!!! There's something about your art style and the way you draw dogman characters that makes me kick my feet and giggle in a very giddy way, it's really nice!!!💖💖💖💖💖BUT I ESPECIALLY GET A KICK WHENEVER I SEE YOUR POSTS ALSO BECAUSE OF YOUR TAGS AND CAPTIONS, cause I can totally understand the Dogman Disease™, omg, it's terminal and I'm totally sick with it as well, it's so bad I infected my bff with it too after he witnessed me descending to madness on call while rambling about it😭😭😭so whenever you scream about them, I always think "SEE, SHE GETS IT,,,,SHE TOTALLY GETS IT" and giggle a lot about it, PFFFF-💖💖💖
I also love all your aus, they're so cool!!! AND I DIDN'T KNOW YOU WROTE FICS, I had read them before knowing you were the author, and when I realized you had written them I got really excited, THEY'RE SOOOOOO CUTEEEEGEHWBWHHWHWJWHWJA😭😭😭💖💖💖💖💖💖💖
UHHHHH, THAT'S IT, I THINK, hope you have an absolutely amazing day/night, whatever your time zone is, take care peanut!!!💖💖💖💖
OMG THANK YOU?!?!?!!??!?!?!?!! THIS IS SO SWEET yeah im really deep in this hyperfix i fear. this is actually my longest lasting hyperfix so i have no idea when it will end . GHANK YOU AGAIN this ask was so sweet 😭😭😭😭
#smth smth the length of my dmhyperfix is out of the range of my data now so i cant rlly extrapolate + predict. so im 100% in fuck it we ball#territory .#ask
17 notes
·
View notes
Text
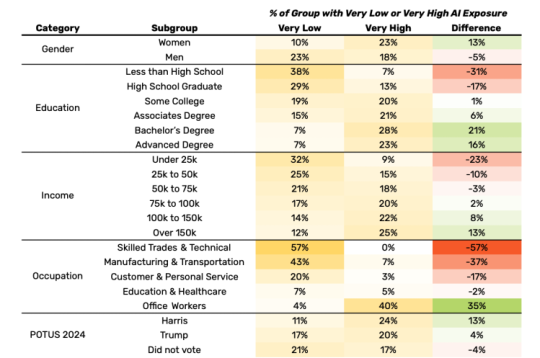
I think when you try to speculate about something like this [the impact that AI technologies will have on the job market in the near future], it’s important to recognize that nothing like this has ever really happened before, so it’s hard to make predictions. But we worked with two economists, Jonathan Hersh and Daniel Rock, who have made fine-grained estimates of which jobs are going to be the most affected by AI and which the least. And their work indicates that this will impact college-educated people more than working-class people for the simple reason that LLMs are advancing more quickly than robotics is. And AI will also have a bigger impact on employment in cities and suburbs than in rural areas. And it will impact women more than men.
(from this article)
#dont love the implication that for women getting a college degree was a waste of time after all :)#i would like to see the data this prediction is based on obviously but it also aligns with everything else i've read
8 notes
·
View notes
Text
If 6 hours ago you’d told me Max Verstappen was going to win the 2024 Brazilian Grand Prix, I would’ve laughed in your face
#yet#here we are#what a freaking race#potentially one of the most frustrating ones of the season#or funny if that’s the perspective we want to take#in a season of eventful races#max verstappen#formula 1#brazilian gp 2024#to be clear it’s not max I doubt#it’s red bull’s car#I know he’s capable#but the race conditions even the experts and teams with millions of data points couldn’t have predicted
14 notes
·
View notes
Text
The first presidential election in which every state picked their electors via statewide popular vote was 1868. Before that, at least one state had the legislature pick the winner (South Carolina was the last holdout). Back then, only white men over 21 could vote, but the electorate saw significant boosts in 1920 with the passage of the 19th amendment (white women) and 1972 following the civil rights movement (black men and women) and the passage of the 26th amendment (18 year olds).
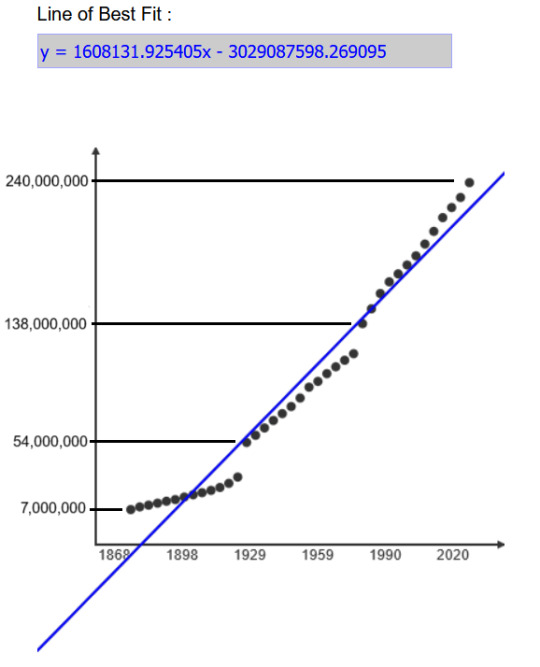
The total number of eligible voters grows with the overall population of the country, and looking at the data since 1972 we can predict that there will be about 244 million eligible voters this year.
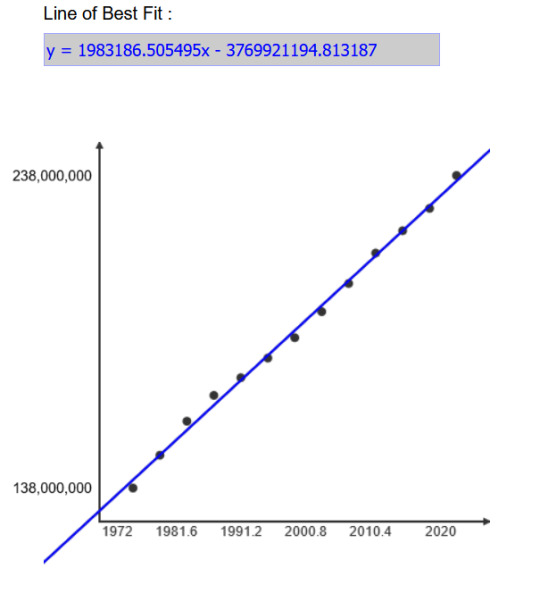
But eligibility is only half the equation. Actual voter turnout never even comes close to 100%. Since 1972, it has never gone above 66.6% (in 2020), averaging 57.2%
57.2% of 244 million voters would mean we'd see 140 million votes cast in November, but that's actually way lower than we would expect. Let's ignore turnout percentage (which fluctuates wildly between 50% and 60%) and look instead at the actual number of votes cast:

There were over 158 million votes cast in 2020, and given that we saw record turnout of 66.6% due to a number of simultaneous crises, it makes perfect sense that the total number of votes cast in 2024 would fall, but not all the way down to 140 million. Between 1984 and 1988, the popular vote dropped by 1 million. Between 1992 and 1996, the popular vote dropped by 8 million. Between 2008 and 2012, the popular vote dropped by 2 million. No polls seem to indicate an 18 million dropoff in voter turnout this year; that would be unprecedented. According to the line of best fit, it is much more likely that we'll see ballpark 150 million votes cast, probably closer to 151 million. That would indicate a voter turnout of around 62%, which is higher than average but more realistic.
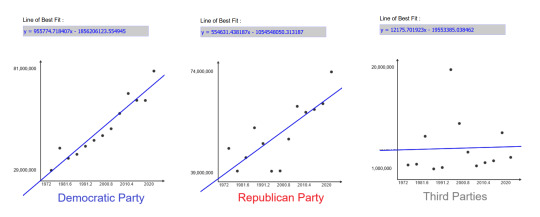
Since 1972, the two major parties combine to win an average of 95.5% of the popular vote per election. Third party candidates do well in waves, with considerable showings (over 5%) in 1980, 1992, 1996, and 2016. Since Kennedy dropped out of the race and neither the Libertarians nor the Greens are making waves as spoilers this year, we can assume that the Democrats and Republicans will have a better than average showing. Looking at the trend lines for major and third party percentages, it would show Kamala Harris receiving 51.7% of the vote (about 78 million), Donald Trump receiving 45.0% (about 68 million), and third party candidates combining for 3.3% (about 5 million).
To scale:
I do not believe that the actual final results will be anywhere close to this prediction. I think that these extrapolations show Kamala Harris overperforming by a considerable amount. She will almost certainly win the popular vote, I don't doubt that, but I think she will win a plurality instead of a majority (under 50%). Donald Trump is not wildly more or less popular than he was the last two times, in which he received 46.1% and 46.8% of the vote, so I do not think it is unreasonable to assume he will receive a minimum of 47% this year, given demographic shifts among suburban voters, black men and Hispanics. He may even perform better than that, but not better than Harris. I would bet my life on that fact. Democrats have won the popular vote in 7 of the last 8 elections, and polls do not show Trump magically coming up from behind on his third try.
When we exclude years with exceptionally high third party turnout, the major parties average 98.3% instead of 95.5% since 1972, but we can't just pick and choose what data to include. At this point, I'm deviating from the hard numbers and am operating more on vibes. Third party turnout will be lower than in 2016 (5.7%), but probably higher than in 2020 (1.8%). If we take the 3.3% figure from the trend lines, that would mean Harris and Trump would receive a combined 96.7% (146 million votes). If we assume Trump has a floor of 47% support (about 71 million votes), then the best Harris could do is 49.7% (about 75 million votes). There is no conceivable scenario where Trump wins the popular vote, so his ceiling (and Harris's floor) is something like 48.35% (73 million votes each).
The only president to win two non-consecutive terms was Grover Cleveland, but he actually won the popular vote all three times he ran, 1884 (48.8%), 1888 (48.6%, lost the electoral college), and 1892 (46.0%). Trump is the exact opposite, having NEVER won the popular vote but still won the electoral college regardless. Franklin Roosevelt won four times in a row, 1932 (57.4%), 1936 (60.8%), 1940 (54.7%), and 1944 (53.4%). There was a major dropoff between his second and third bid, even though he was ridiculously popular. Trump is NOT ridiculously popular, but I don't think he's going to perform worse this time. Cleveland performed worse because there was a significant third party challenger, and FDR was the first sitting incumbent to run for a third term (at a time when WW2 was ramping up and voters were afraid of America joining). Trump does not have either of these disadvantages, so while it's possible he could perform worse than in 2020, I think Harris has so much baggage attached to her name (real and imaginary) that Trump will do better than he did against Clinton or Biden. A lot of voters are fed up with him, but that doesn't mean they will support Harris.
I have no real data to confirm these confidence intervals, but this what I would expect next month
47.0% to 48.3% for Trump (71 million to 73 million), I'd say 48.0% (72.5 million)
48.4% to 49.7% for Harris (73 million to 75 million), I'd say 48.7% (73.5 million)
Now, the electoral college is anybody's guess! Who fuckin knows?
#2024#election#politics#political#2024 election#presidential election#math#numbers#data#graphs#election polls#polls#polling#prediction#election prediction#2024 predictions#kamala harris#donald trump#harris#trump#god help us all#electoral college
9 notes
·
View notes