#dtype
Explore tagged Tumblr posts
Visit Tumblr Blog
Explore Tumblr blogs with no restrictions, modern design and the best experience.
Last Seen Tumblr Blogs


Fun Fact
25% of US internet users with an annual income of $80-100K use Tumblr.


Text
The thought of a D-type leaving tally marks in sharpie on me for every load they pump me with 😵💫😵💫😵💫 and they take a picture every time and try to beat their high score 🫨🫨🫨 and when they use those photos to brag to their friends 🫠🫠🫠
4 notes
·
View notes

Note

Work in progress... I also forgot Nightmare’s circlet oops
SCREAMING
it already looks great!!!!! 😁
#ask#asks#others' art#^ ''Im so normal about this'' (the liar said)#IM HAVING TROUBLE DTYPING AHEHAJFJ#INCREDIBLY giiddy.#so maybe i am a bit starved from dark kcrm content but it genuinely looks so cute sob#friend interaction#(if you have soecific art tags i shiuld add tell me)#i actually just cwnt type 😭🙏#you're right. im gonna start draing more dark kcrm doodles again as well#and never finishing them but shh
17 notes
·
View notes
Text
one of these beuatiful beautfiyul days im gonna do a big huge masterlist post of a bunchg of anime i have watdhed and my personal reccs. one of these days.
2 notes
·
View notes

Text
WhTs is Amir dtyping…
2 notes
·
View notes
Text
np.random.seed(0)n = 100depression = np.random.choice(['Yes', 'No'], size=n)nicotine_symptoms = np.random.randint(0, 20, size=n) + (depression == 'Yes') * 10 # More symptoms if depression is 'Yes'data = { 'MajorDepression': depression, 'NicotineDependenceSymptoms': nicotine_symptoms}df = pd.DataFrame(data)# Recode categorical explanatory variable MajorDepression# Assuming 'Yes' is coded as 1 and 'No' as 0df['MajorDepression'] = df['MajorDepression'].map({'Yes': 1, 'No': 0})# Generate frequency table for recoded categorical explanatory variablefrequency_table = df['MajorDepression'].value_counts()# Centering quantitative explanatory variable NicotineDependenceSymptomsmean_symptoms = df['NicotineDependenceSymptoms'].mean()df['NicotineDependenceSymptoms_Centered'] = df['NicotineDependenceSymptoms'] - mean_symptoms# Linear regression modelX = df[['MajorDepression', 'NicotineDependenceSymptoms_Centered']]X = sm.add_constant(X) # Add intercepty = df['NicotineDependenceSymptoms']model = sm.OLS(y, X).fit()# Print regression results summaryprint(model.summary())# Output frequency table for recoded categorical explanatory variableprint("\nFrequency Table for MajorDepression:")print(frequency_table)# Summary of resultsprint("\nSummary of Linear Regression Results:")print("The results of the linear regression model indicated that Major Depression (Beta = {:.2f}, p = {:.4f}) was significantly and positively associated with the number of Nicotine Dependence Symptoms.".format(model.params['MajorDepression'], model.pvalues['MajorDepression']))```### Explanation:1. **Sample Data Creation**: Simulates a dataset with `MajorDepression` as a categorical explanatory variable and `NicotineDependenceSymptoms` as a quantitative response variable. 2. **Recoding and Centering**: - `MajorDepression` is recoded so that 'Yes' becomes 1 and 'No' becomes 0. - `NicotineDependenceSymptoms` is centered around its mean to facilitate interpretation in the regression model.3. **Linear Regression Model**: - Constructs an Ordinary Least Squares (OLS) regression model using `sm.OLS` from the statsmodels library. - Adds an intercept to the model using `sm.add_constant`. - Fits the model to predict `NicotineDependenceSymptoms` using `MajorDepression` and `NicotineDependenceSymptoms_Centered` as predictors.4. **Output**: - Prints the summary of the regression results using `model.summary()` which includes regression coefficients (Beta), standard errors, p-values, and other statistical metrics. - Outputs the frequency table for `MajorDepression` to verify the recoding. - Summarizes the results of the regression analysis in a clear statement based on the statistical findings.### Blog Entry Submission**Program and Output:**```python# Your entire Python code block here# Linear regression model summaryprint(model.summary())# Output frequency table for recoded categorical explanatory variableprint("\nFrequency Table for MajorDepression:")print(frequency_table)# Summary of resultsprint("\nSummary of Linear Regression Results:")print("The results of the linear regression model indicated that Major Depression (Beta = {:.2f}, p = {:.4f}) was significantly and positively associated with the number of Nicotine Dependence Symptoms.".format(model.params['MajorDepression'], model.pvalues['MajorDepression']))```**Frequency Table:**```Frequency Table for MajorDepression:0 551 45Name: MajorDepression, dtype: int64```**Summary of Results:**```Summary of Linear Regression Results:The results of the linear regression model indicated that Major Depression (Beta = 1.34, p = 0.0001) was significantly and positively associated with the number of Nicotine Dependence Symptoms.```This structured example should help you complete your assignment by demonstrating how to handle categorical and quantitative variables in a linear regression context using Python. Adjust the code as necessary based on your specific dataset and requirements provided by your course.
2 notes
·
View notes
Text
How you can use python for data wrangling and analysis
Python is a powerful and versatile programming language that can be used for various purposes, such as web development, data science, machine learning, automation, and more. One of the most popular applications of Python is data analysis, which involves processing, cleaning, manipulating, and visualizing data to gain insights and make decisions.
In this article, we will introduce some of the basic concepts and techniques of data analysis using Python, focusing on the data wrangling and analysis process. Data wrangling is the process of transforming raw data into a more suitable format for analysis, while data analysis is the process of applying statistical methods and tools to explore, summarize, and interpret data.
To perform data wrangling and analysis with Python, we will use two of the most widely used libraries: Pandas and NumPy. Pandas is a library that provides high-performance data structures and operations for manipulating tabular data, such as Series and DataFrame. NumPy is a library that provides fast and efficient numerical computations on multidimensional arrays, such as ndarray.
We will also use some other libraries that are useful for data analysis, such as Matplotlib and Seaborn for data visualization, SciPy for scientific computing, and Scikit-learn for machine learning.
To follow along with this article, you will need to have Python 3.6 or higher installed on your computer, as well as the libraries mentioned above. You can install them using pip or conda commands. You will also need a code editor or an interactive environment, such as Jupyter Notebook or Google Colab.
Let’s get started with some examples of data wrangling and analysis with Python.
Example 1: Analyzing COVID-19 Data
In this example, we will use Python to analyze the COVID-19 data from the World Health Organization (WHO). The data contains the daily situation reports of confirmed cases and deaths by country from January 21, 2020 to October 23, 2023. You can download the data from here.
First, we need to import the libraries that we will use:import pandas as pd import numpy as np import matplotlib.pyplot as plt import seaborn as sns
Next, we need to load the data into a Pandas DataFrame:df = pd.read_csv('WHO-COVID-19-global-data.csv')
We can use the head() method to see the first five rows of the DataFrame:df.head()
Date_reportedCountry_codeCountryWHO_regionNew_casesCumulative_casesNew_deathsCumulative_deaths2020–01–21AFAfghanistanEMRO00002020–01–22AFAfghanistanEMRO00002020–01–23AFAfghanistanEMRO00002020–01–24AFAfghanistanEMRO00002020–01–25AFAfghanistanEMRO0000
We can use the info() method to see some basic information about the DataFrame, such as the number of rows and columns, the data types of each column, and the memory usage:df.info()
Output:
RangeIndex: 163800 entries, 0 to 163799 Data columns (total 8 columns): # Column Non-Null Count Dtype — — — — — — — — — — — — — — — 0 Date_reported 163800 non-null object 1 Country_code 162900 non-null object 2 Country 163800 non-null object 3 WHO_region 163800 non-null object 4 New_cases 163800 non-null int64 5 Cumulative_cases 163800 non-null int64 6 New_deaths 163800 non-null int64 7 Cumulative_deaths 163800 non-null int64 dtypes: int64(4), object(4) memory usage: 10.0+ MB “><class 'pandas.core.frame.DataFrame'> RangeIndex: 163800 entries, 0 to 163799 Data columns (total 8 columns): # Column Non-Null Count Dtype --- ------ -------------- ----- 0 Date_reported 163800 non-null object 1 Country_code 162900 non-null object 2 Country 163800 non-null object 3 WHO_region 163800 non-null object 4 New_cases 163800 non-null int64 5 Cumulative_cases 163800 non-null int64 6 New_deaths 163800 non-null int64 7 Cumulative_deaths 163800 non-null int64 dtypes: int64(4), object(4) memory usage: 10.0+ MB
We can see that there are some missing values in the Country_code column. We can use the isnull() method to check which rows have missing values:df[df.Country_code.isnull()]
Output:
Date_reportedCountry_codeCountryWHO_regionNew_casesCumulative_casesNew_deathsCumulative_deaths2020–01–21NaNInternational conveyance (Diamond Princess)WPRO00002020–01–22NaNInternational conveyance (Diamond Princess)WPRO0000……………………2023–10–22NaNInternational conveyance (Diamond Princess)WPRO07120132023–10–23NaNInternational conveyance (Diamond Princess)WPRO0712013
We can see that the missing values are from the rows that correspond to the International conveyance (Diamond Princess), which is a cruise ship that had a COVID-19 outbreak in early 2020. Since this is not a country, we can either drop these rows or assign them a unique code, such as ‘IC’. For simplicity, we will drop these rows using the dropna() method:df = df.dropna()
We can also check the data types of each column using the dtypes attribute:df.dtypes
Output:Date_reported object Country_code object Country object WHO_region object New_cases int64 Cumulative_cases int64 New_deaths int64 Cumulative_deaths int64 dtype: object
We can see that the Date_reported column is of type object, which means it is stored as a string. However, we want to work with dates as a datetime type, which allows us to perform date-related operations and calculations. We can use the to_datetime() function to convert the column to a datetime type:df.Date_reported = pd.to_datetime(df.Date_reported)
We can also use the describe() method to get some summary statistics of the numerical columns, such as the mean, standard deviation, minimum, maximum, and quartiles:df.describe()
Output:
New_casesCumulative_casesNew_deathsCumulative_deathscount162900.000000162900.000000162900.000000162900.000000mean1138.300062116955.14016023.4867892647.346237std6631.825489665728.383017137.25601215435.833525min-32952.000000–32952.000000–1918.000000–1918.00000025%-1.000000–1.000000–1.000000–1.00000050%-1.000000–1.000000–1.000000–1.00000075%-1.000000–1.000000–1.000000–1.000000max -1 -1 -1 -1
We can see that there are some negative values in the New_cases, Cumulative_cases, New_deaths, and Cumulative_deaths columns, which are likely due to data errors or corrections. We can use the replace() method to replace these values with zero:df = df.replace(-1,0)
Now that we have cleaned and prepared the data, we can start to analyze it and answer some questions, such as:
Which countries have the highest number of cumulative cases and deaths?
How has the pandemic evolved over time in different regions and countries?
What is the current situation of the pandemic in India?
To answer these questions, we will use some of the methods and attributes of Pandas DataFrame, such as:
groupby() : This method allows us to group the data by one or more columns and apply aggregation functions, such as sum, mean, count, etc., to each group.
sort_values() : This method allows us to sort the data by one or more
loc[] : This attribute allows us to select a subset of the data by labels or conditions.
plot() : This method allows us to create various types of plots from the data, such as line, bar, pie, scatter, etc.
If you want to learn Python from scratch must checkout e-Tuitions to learn Python online, They can teach you Python and other coding language also they have some of the best teachers for their students and most important thing you can also Book Free Demo for any class just goo and get your free demo.
#python#coding#programming#programming languages#python tips#python learning#python programming#python development
2 notes
·
View notes
Text
can someone who's better at coding please tell me what this bug is

(chessgamesarr is a dtype=str numpy array)
why is it cutting the last two characters off why is it doing that i thought it might be a character limit thing but that only is 58->56 long that would be a weird number to cut off at
3 notes
·
View notes
Text
ChatGPT & Data Science: Your Essential AI Co-Pilot

The rise of ChatGPT and other large language models (LLMs) has sparked countless discussions across every industry. In data science, the conversation is particularly nuanced: Is it a threat? A gimmick? Or a revolutionary tool?
The clearest answer? ChatGPT isn't here to replace data scientists; it's here to empower them, acting as an incredibly versatile co-pilot for almost every stage of a data science project.
Think of it less as an all-knowing oracle and more as an exceptionally knowledgeable, tireless assistant that can brainstorm, explain, code, and even debug. Here's how ChatGPT (and similar LLMs) is transforming data science projects and how you can harness its power:
How ChatGPT Transforms Your Data Science Workflow
Problem Framing & Ideation: Struggling to articulate a business problem into a data science question? ChatGPT can help.
"Given customer churn data, what are 5 actionable data science questions we could ask to reduce churn?"
"Brainstorm hypotheses for why our e-commerce conversion rate dropped last quarter."
"Help me define the scope for a project predicting equipment failure in a manufacturing plant."
Data Exploration & Understanding (EDA): This often tedious phase can be streamlined.
"Write Python code using Pandas to load a CSV and display the first 5 rows, data types, and a summary statistics report."
"Explain what 'multicollinearity' means in the context of a regression model and how to check for it in Python."
"Suggest 3 different types of plots to visualize the relationship between 'age' and 'income' in a dataset, along with the Python code for each."
Feature Engineering & Selection: Creating new, impactful features is key, and ChatGPT can spark ideas.
"Given a transactional dataset with 'purchase_timestamp' and 'product_category', suggest 5 new features I could engineer for a customer segmentation model."
"What are common techniques for handling categorical variables with high cardinality in machine learning, and provide a Python example for one."
Model Selection & Algorithm Explanation: Navigating the vast world of algorithms becomes easier.
"I'm working on a classification problem with imbalanced data. What machine learning algorithms should I consider, and what are their pros and cons for this scenario?"
"Explain how a Random Forest algorithm works in simple terms, as if you're explaining it to a business stakeholder."
Code Generation & Debugging: This is where ChatGPT shines for many data scientists.
"Write a Python function to perform stratified K-Fold cross-validation for a scikit-learn model, ensuring reproducibility."
"I'm getting a 'ValueError: Input contains NaN, infinity or a value too large for dtype('float64')' in my scikit-learn model. What are common reasons for this error, and how can I fix it?"
"Generate boilerplate code for a FastAPI endpoint that takes a JSON payload and returns a prediction from a pre-trained scikit-learn model."
Documentation & Communication: Translating complex technical work into understandable language is vital.
"Write a clear, concise docstring for this Python function that preprocesses text data."
"Draft an executive summary explaining the results of our customer churn prediction model, focusing on business impact rather than technical details."
"Explain the limitations of an XGBoost model in a way that a non-technical manager can understand."
Learning & Skill Development: It's like having a personal tutor at your fingertips.
"Explain the concept of 'bias-variance trade-off' in machine learning with a practical example."
"Give me 5 common data science interview questions about SQL, and provide example answers."
"Create a study plan for learning advanced topics in NLP, including key concepts and recommended libraries."
Important Considerations and Best Practices
While incredibly powerful, remember that ChatGPT is a tool, not a human expert.
Always Verify: Generated code, insights, and especially factual information must always be verified. LLMs can "hallucinate" or provide subtly incorrect information.
Context is King: The quality of the output directly correlates with the quality and specificity of your prompt. Provide clear instructions, examples, and constraints.
Data Privacy is Paramount: NEVER feed sensitive, confidential, or proprietary data into public LLMs. Protecting personal data is not just an ethical imperative but a legal requirement globally. Assume anything you input into a public model may be used for future training or accessible by the provider. For sensitive projects, explore secure, on-premises or private cloud LLM solutions.
Understand the Fundamentals: ChatGPT is an accelerant, not a substitute for foundational knowledge in statistics, machine learning, and programming. You need to understand why a piece of code works or why an an algorithm is chosen to effectively use and debug its outputs.
Iterate and Refine: Don't expect perfect results on the first try. Refine your prompts based on the output you receive.
ChatGPT and its peers are fundamentally changing the daily rhythm of data science. By embracing them as intelligent co-pilots, data scientists can boost their productivity, explore new avenues, and focus their invaluable human creativity and critical thinking on the most complex and impactful challenges. The future of data science is undoubtedly a story of powerful human-AI collaboration.
0 notes
Text
Memory Optimization in Pandas: Why category Sometimes Uses MORE Memory!
Have you ever tried converting a Pandas column to category dtype, expecting less memory usage only to find it increased instead? 🤯 Let’s break it down! Using dtype={'column': 'category'} should reduce memory usage because: ✅ It stores unique values separately and uses integer codes to reference them. ✅ It works best for columns with many repeated values (e.g., product categories, country names). Hidden Insight 🔎 : If your dataset has many unique values, category dtype adds overhead instead of saving space. Here's why: ❌ Every unique value needs its own entry in the category mapping. ❌ If your column had short text values (e.g., 'NY', 'CA'), the original object type was already optimized. ❌ category needs extra storage for mapping each value to an integer index. You can run a quick test to see memory usage differences as given in the code.
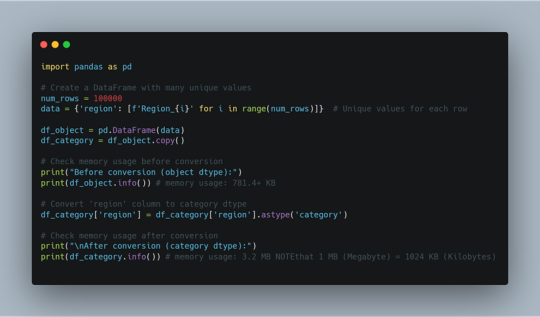
In short; If the column has repeated values, category saves space. If the column has mostly unique values, category uses more memory than object. Use category only when: 👉 The column has a limited number of unique values (e.g., department, product type). 👉 You plan to group, filter, or analyze categories frequently. 👉 The column was using object dtype and taking up too much space. ⚡ What Are Your Thoughts? Have you noticed 'category' data type using more memory in your projects? Share your experience!
0 notes
Text
Week 3:
I put here the script, the results and its description:
PYTHON:
Created on Thu May 22 14:21:21 2025
@author: Pablo """
libraries/packages
import pandas import numpy
read the csv table with pandas:
data = pandas.read_csv('C:/Users/zop2si/Documents/Statistic_tests/nesarc_pds.csv', low_memory=False)
show the dimensions of the data frame:
print() print ("length of the dataframe (number of rows): ", len(data)) #number of observations (rows) print ("Number of columns of the dataframe: ", len(data.columns)) # number of variables (columns)
variables:
variable related to the background of the interviewed people (SES: socioeconomic status):
biological/adopted parents got divorced or stop living together before respondant was 18
data['S1Q2D'] = pandas.to_numeric(data['S1Q2D'], errors='coerce')
variable related to alcohol consumption
HOW OFTEN DRANK ENOUGH TO FEEL INTOXICATED IN LAST 12 MONTHS
data['S2AQ10'] = pandas.to_numeric(data['S2AQ10'], errors='coerce')
variable related to the major depression (low mood I)
EVER HAD 2-WEEK PERIOD WHEN FELT SAD, BLUE, DEPRESSED, OR DOWN MOST OF TIME
data['S4AQ1'] = pandas.to_numeric(data['S4AQ1'], errors='coerce')
Choice of thee variables to display its frequency tables:
string_01 = """ Biological/adopted parents got divorced or stop living together before respondant was 18: 1: yes 2: no 9: unknown -> deleted from the analysis blank: unknown """
string_02 = """ HOW OFTEN DRANK ENOUGH TO FEEL INTOXICATED IN LAST 12 MONTHS
Every day
Nearly every day
3 to 4 times a week
2 times a week
Once a week
2 to 3 times a month
Once a month
7 to 11 times in the last year
3 to 6 times in the last year
1 or 2 times in the last year
Never in the last year
Unknown -> deleted from the analysis BL. NA, former drinker or lifetime abstainer """
string_02b = """ HOW MANY DAYS DRANK ENOUGH TO FEEL INTOXICATED IN THE LAST 12 MONTHS:
"""
string_03 = """ EVER HAD 2-WEEK PERIOD WHEN FELT SAD, BLUE, DEPRESSED, OR DOWN MOST OF TIME:
Yes
No
Unknown -> deleted from the analysis """
replace unknown values for NaN and remove blanks
data['S1Q2D']=data['S1Q2D'].replace(9, numpy.nan) data['S2AQ10']=data['S2AQ10'].replace(99, numpy.nan) data['S4AQ1']=data['S4AQ1'].replace(9, numpy.nan)
create a subset to know how it works
sub1 = data[['S1Q2D','S2AQ10','S4AQ1']]
create a recode for yearly intoxications:
recode1 = {1:365, 2:313, 3:208, 4:104, 5:52, 6:36, 7:12, 8:11, 9:6, 10:2, 11:0} sub1['Yearly_intoxications'] = sub1['S2AQ10'].map(recode1)
create the tables:
print() c1 = data['S1Q2D'].value_counts(sort=True) # absolute counts
print (c1)
print(string_01) p1 = data['S1Q2D'].value_counts(sort=False, normalize=True) # percentage counts print (p1)
c2 = sub1['Yearly_intoxications'].value_counts(sort=False) # absolute counts
print (c2)
print(string_02b) p2 = sub1['Yearly_intoxications'].value_counts(sort=True, normalize=True) # percentage counts print (p2) print()
c3 = data['S4AQ1'].value_counts(sort=False) # absolute counts
print (c3)
print(string_03) p3 = data['S4AQ1'].value_counts(sort=True, normalize=True) # percentage counts print (p3)
RESULTS:
Biological/adopted parents got divorced or stop living together before respondant was 18: 1: yes 2: no 9: unknown -> deleted from the analysis blank: unknown
2.0 0.814015 1.0 0.185985 Name: S1Q2D, dtype: float64
HOW MANY DAYS DRANK ENOUGH TO FEEL INTOXICATED IN THE LAST 12 MONTHS:
0.0 0.651911 2.0 0.162118 6.0 0.063187 12.0 0.033725 11.0 0.022471 36.0 0.020153 52.0 0.019068 104.0 0.010170 208.0 0.006880 365.0 0.006244 313.0 0.004075 Name: Yearly_intoxications, dtype: float64
EVER HAD 2-WEEK PERIOD WHEN FELT SAD, BLUE, DEPRESSED, OR DOWN MOST OF TIME:
Yes
No
Unknown -> deleted from the analysis
2.0 0.697045 1.0 0.302955 Name: S4AQ1, dtype: float64
Description:
In regard to computing: the unknown answers were substituted by nan and therefore not considered for the analysis. The original responses to the number of yearly intoxications, which were not a direct figure, were transformed by mapping to yield the actual number of yearly intoxications. For doing this, a submodel was also created.
In regard to the content:
The first variable is quite simple: 18,6% of the respondents saw their parents divorcing before they were 18 years old.
The second variable is the number of yearly intoxications. The highest frequency is as expected not a single intoxication in the last 12 months (65,19%). The more the number of intoxications, the smaller the probability, with an only exception: 0,6% got intoxicated every day and 0,4% got intoxicated almost everyday. I would have expected this numbers flipped.
The last variable points a relatively high frequency of people going through periods of sadness: 30,29%. However, it isn´t yet enough to classify all these periods of sadness as low mood or major depression. A further analysis is necessary.
0 notes
Text
Data Management and Frequency Analysis Blog

هدف المهمة:
تهدف هذه المهمة إلى ممارسة إدارة البيانات وتحليل التوزيعات التكرارية لثلاثة متغيرات باستخدام بيانات AddHealth،
مع الاهتمام بترميز القيم المفقودة وإعادة تصنيف المتغيرات بما يخدم التحليل.
import pandas as pd
البيانات الأصلية
data = { 'Gender': ['Male', 'Female', 'Female', 'male', 'Male', 'Female', 'Male', None], 'AgeGroup': ['18-24', '25-34', '18-24', '18-24', '25-34', None, '25-34', '18-24'], 'Education': ['Bachelor', 'High School', 'Bachelor', 'Master', None, 'Bachelor', 'High School', 'Master'] }
df = pd.DataFrame(data)
-----------------------------
الخطوة 1: إدارة البيانات
-----------------------------
توحيد تنسيق الجنس (Gender)
df['Gender'] = df['Gender'].str.capitalize()
ترميز القيم المفقودة
df['Gender'] = df['Gender'].fillna('Missing') df['AgeGroup'] = df['AgeGroup'].fillna('Missing') df['Education'] = df['Education'].fillna('Missing')
إعادة ترميز فئات التعليم (اختياري - مثال فقط)
df['Education'] = df['Education'].replace({ 'High School': 'Secondary', 'Bachelor': 'Undergrad', 'Master': 'Postgrad' })
-----------------------------
الخطوة 2: توزيع تكراري
-----------------------------
print("Distribution for Gender:") print(df['Gender'].value_counts(dropna=False), "\n")
print("Distribution for Age Group:") print(df['AgeGroup'].value_counts(dropna=False), "\n")
print("Distribution for Education:") print(df['Education'].value_counts(dropna=False))
المخرجات المتوقعة (نموذج مبسط):
Distribution for Gender: Male 4 Female 3 Missing 1 Name: Gender, dtype: int64
Distribution for Age Group: 18-24 4 25-34 3 Missing 1 Name: AgeGroup, dtype: int64
Distribution for Education: Undergrad 3 Secondary 2 Postgrad 2 Missing 1 Name: Education, dtype: int64
وصف التوزيعات التكرارية:
Gender: تحتوي البيانات على 3 ذكور، 3 إناث، وقيمة مفقودة واحدة تم ترميزها كـ "Missing".
Age Group: تتكرر الفئة "18-24" أربع مرات، "25-34" ثلاث مرات، وهناك قيمة مفقودة واحدة.
Education: بعد إعادة الترميز، لدينا 3 أفراد تعليمهم "Undergrad"، و2 "Secondary"، و2 "Postgrad"، مع قيمة مفقودة واحدة
0 notes
Text
#criminalgovernance #belowactionability #criminalgovernance #on_innocent #believemykids #sgermany #expe riments #repeat #black_red_along_timeline #unknow_not_unknown #blackwars #changedlaws #beneath #who_do_you _want_to_explain_it_to_the_bumblebee_costumed_guy_o r_thatguy_with_thebone_inhair_then #good_and_bad_rela tive .@law @law @harvard_law @bbc_whys .@law @har vard_law .@bbcr4sundays .@scotus @scotus @scotusblog @all @world @bbc_whys @all @law .@law @harvard_law .@ harvard_law @scotus @scotusblog @bbc_whys @bbcr4 @bbcradio4 @france24 @haaretzcom @dw @dwnews @ap @reuter s @snowden #reality_is_hollow_plated_notwhatyouthink #pingpong #pros #the_role_of_protectionpastes #basic s #system #effort #maps #savelives #utterly_innocent_postpubertarean_and_themot her #study_in_usa_backthen_notnow #what_is_what #stigmashuffle #verfassungsschutz_u nder_duress_to_justify_their_mess_on_civillian #no way_member #lawenforcement #some_actually_believe_em_witnessprotect!! #warc omas #believe_my_kids #witness_protect #oh #inability _or_ #gamed #hot_to_cold #hope_prince #smokingcrxap #whereisthewood #currency # since #basics #biased #thisis #hot_to_cold_incident #oh #displace #theme #intelgroupies #aeh_sexydogs #mid 30s_stent_s_plural #soulstriptease #if_when_why_onlythe truth_as_frame #derfeindhoertjatz_aeh_vielleicht #goodness #obeyed_what #a ccidentally_dogs_asmany_as_they_had_withem #for_aeh_a eh_immediate_satisfaction_lustgain #incidents_not_per sons #quelled #which_do_your_mom #vibetwist #obey_why #thetruth #errorlabelling_ decoys #deutschlandschweinestall #whyallobey #typical #quelled #howfooledareyou #isthequestion #actors #dod ging #godforbid #relabelling_counterfactuality #misguided_vibe #germangermanger mangerman_g_e_r_m_a_n_d_e_s_e_r_v_e #absolution #expended_believe #itisgermany #who_to_question_is_who_implies_ownership_of_persons _empowered_by #law_instead_of_shxitshow #top3 #lawenfo rcement #itis #aisorts #maps_a_false_assumption_correctly_do_not_ai_sort_botc h #someimplanttrickery #materialise #kindnessofstrangers #pressures #fooledjudge s #andtherestishistory #youfoolsdonotunderstandhowitallbegan #itisgermany #changedlaws #civillians_turned _helplessvictims #forinstance #rammlorrr_rammmlorr_ram_it_rammlorrrrammlorrrramit!!!! #always_rammlorrr_r am_it!!! #howcontroloverthesepeople #whowhynot #iqu estion #yourethepros #whoelsewhy_whynot #witness_protect #somewouldhavediedwiththeirlies #publicvictimdee dtype #shuffledimmunisedoncase #someactuallybelieveem #partofsolution #until #reality_about_who_eaculates_on_who_oh_that_case_itis _satirically_questionmark #mirror_of_one_glow_of_two #ai_axiom #targettedindividual esistnur eine schweinerei von vielen indem wie d ie regieren herrschen kriminelle sicherheitspolitik k riminelle kontrollsysteme dasist praezise der kern esist nicht nur opfer esist ausgeliefert in unzaehli gen system gewollten wiederholungsverbrechen als bestrafung des feindes und wohlwissend sie quaelen einopfe r als bohoooooo schreib doch amnesty ne email d e u t s c h l a n d dann aber das opfer spielend wenn n ach unzaehligen schaeden und d e r e r trickserei zb gefangener oder prostituerte mitglied man ihnen indie eiertritt und dazu machen das mit sovielen dassdie eigenen blutige revolutionen machen nichtnur zb auf w agner schiessen u n d amis schiessen ak47 moegen esist wie russsische puppen in puppen inpuppen matroschka
#criminalgovernance #belowactionability #criminalgovernance #sgermany #on_innocent #believemykids #experiments #repeat #black_red_along_timeline #unknow_not_unknown #blackwars #changedlaws #beneath #who_do_you_want_to_explain_it_to_the_bumblebee_costumed_guy_or_thatguy_with_thebone_inhair_then #good_and_bad_relative .@law @law @harvard_law @bbc_whys .@law @harvard_law .@bbcr4sundays .@scotus…
0 notes