#flink api
Explore tagged Tumblr posts
Visit Tumblr Blog
Explore Tumblr blogs with no restrictions, modern design and the best experience.
Last Seen Tumblr Blogs


Fun Fact
The most popular pages on Tumblr are about Minecraft, GIFs, and David J. Peterson.
Text
Deck raises $12M to ‘Plaid-ify’ any website using AI

Deck, a startup that claims to be building “the Plaid for the rest of the internet,” has raised $12 million in a Series A funding round — about nine months after closing its seed financing, it tells TechCrunch exclusively.
The new raise, led by Infinity Ventures, brings Montreal-based Deck’s total raised since its January 2024 inception to $16.5 million. Golden Ventures and Better Tomorrow Ventures co-led its seed raise.
Deck claims that it is building the infrastructure for user-permissioned data access — across the entire internet. Its browser-based data agents “unlock” the data from any website through automation.
To put it more simply, Deck helps users connect any account online and aims to turn the information into structured, usable data, with full user permission.
President Frederick Lavoie, CEO Yves-Gabriel Leboeuf, and CTO Bruno Lambert (pictured above, left to right) co-founded Deck in June 2024.
The startup’s approach is to treat the web itself as an open platform. It operates under the premise that users have “tons of valuable data” locked behind usernames, passwords, and session-based portals with no real way to share it securely.
Deck hopes to change that.
“Just like Plaid gave developers an easy, secure way to access bank account data with user permission, Deck does the same for the 95% of platforms that don’t offer APIs such as utility portals, e-commerce backends, payroll systems and government services,” Leboeuf told TechCrunch. Its goal is to make it easier for developers to access the data users already have without all the manual work
When a user connects an account, Deck’s infrastructure handles everything behind the scenes. Its AI agents log in, navigate, and extract the data “just like a human would — but faster, more reliably, and at scale,” said Leboeuf.
It then generates scripts to keep those connections live and reusable without AI involvement going forward.
“Companies use Deck to eliminate the friction of getting their user data from places where APIs don’t exist — or are incomplete, expensive, or unreliable,” Leboeuf said. “We basically ‘Plaid-ify’ any websites. Whether you’re doing accounting, KYC, automating reporting, or verifying a business, Deck lets you build those features in minutes instead of months.”
Repeat founders Leboeuf and Lavoie previously started Flinks, a startup that was dubbed the “Plaid for Canada.” The National Bank of Canada acquired it in 2021 for about US$140 million. (Lambert was one of Flinks’ first engineers.)
After that sale, the founders started talking to entrepreneurs across industries.
“Again and again, we heard the same thing: Our data is broken,’” said Leboeuf.
One founder had millions in food sales intelligence trapped in dozens of ���clunky” distributor portals. Another spent months trying to access music royalty data — to help users claim over a billion in unpaid royalties.
“We even experienced the problem firsthand,” Lavoie said. “The pattern was clear: data access was fragmented, fragile, and failing — and not just in banking. It was everywhere.”
So they built Deck, which today competes with Arcadia, a company that the founders had tried using but grew frustrated by.
The trio believes that recent developments in artificial intelligence (AI) have underscored the urgency of open access to non-financial data. Without it, AI risks being trained on outdated, biased, or incomplete information.
Initially, the company has been focused on working with utility companies, having connected to over 100,000 utility providers in more than 40 countries across North America, Europe, and Asia. Customers include EnergyCAP, Quadient, and Greenly. Deck is also working with non-utility customers such as Notes.fm, Glowtify, and Evive Smoothies. It believes that its technology can be applied to any industry where data is “trapped” in online accounts.
“Think of us as the bridge between the application layer and foundational tools like browser automation or AI operators such as Playwright, Browser Use, OpenAI Operator,” Leboeuf said. “We’ve taken the messy, foundational pieces — authentication, data normalization, rate limiting, consent management, and antibot protection — and turned them into a seamless, productized platform.”
Rapid growth Deck has seen the number of developers building on its platform “grow drastically” in the last couple of months, according to its founders. In February, for example, its connections grew by over 120% compared to the previous month. The startup’s pricing model is performance-driven, charging clients based on “successful” API calls.
“That means you only pay when the data works,” said Lavoie.
Like Plaid and Flinks, Deck relies only on explicit user consent to connect and collect data.
“While it may hypothetically be violating some terms and conditions, our technology follows the open data international trend that was initiated and greatly popularized by open banking, and has pushed regulators across the world to make it clear in several jurisdictions that consumers and businesses have the right to access and transfer their data,” said Leboeuf.
Deck also claims to have proprietary technologies to avoid being labeled as bots or crawlers. Those technologies include several different methods, such as vision computing and human-like mouse movement.
“While we see a lot of antibot technologies in sectors like telcos or HR, where there is a lot of fraud from identity theft, lots of other data verticals have limited to no antibot technologies,” said Lavoie.
For now, it’s not using the data collection to train models, instead focusing on building the best way to collect the data rather than building products on top of the collected data itself.
“We operate in a dual consent environment, where we would need end-user consent, and Deck’s client consent, to use the data,” Leboeuf said.
The company soon plans to launch a data vertical creator, which it claims will let any developer “get up and running for any data verticals for any industry… in no time.”
Presently, Deck has 30 employees.
Jeremy Jonker, co-founder and managing partner at Infinity Ventures, believes that Deck is “transforming” the user-permissioned data sector, “just as open banking reshaped financial data.”
“With a modular platform and reusable recipes, they deliver speed, reliability, and adaptability that extend well beyond utilities,” he told TechCrunch. Jonker has joined Deck’s board as part of the financing.
Intact Ventures, along with previous backers Better Tomorrow Ventures, Golden, and Luge Capital also participated in the Series A financing.
0 notes
Text
Event Stream Processing: Powering the Next Evolution in Market Research.
What is Event Stream Processing?
At its core, Event Stream Processing is the technology that allows you to process and analyze data in motion. Unlike traditional batch processing, ESP enables organizations to ingest, filter, enrich, and analyze live data streams—in milliseconds. Technologies like Apache Kafka, Apache Flink, Spark Streaming, and proprietary platforms like Confluent and Azure Stream Analytics are powering this real-time revolution.
🌍 Overview of the Event Stream Processing Market
According to recent industry reports:
The global ESP market is projected to grow from $800M in 2022 to nearly $5.7B by 2032, with a CAGR exceeding 20%.
The drivers include growth in IoT devices, real-time analytics demand, AI/ML integration, and cloud-native infrastructure.
ESP is already being adopted in industries like finance, retail, telecom, and increasingly, in data-driven research sectors.
So how does this affect market research?
🧠 How ESP is Reshaping Market Research
The market research industry is undergoing a paradigm shift—from long cycles of surveys and focus groups to continuous consumer intelligence. ESP offers the foundation to make this real-time, automated, and infinitely scalable.
1. Always-On Consumer Listening
Traditional market research works in waves. ESP enables constant monitoring of consumer conversations, behaviors, and sentiments across social media, websites, mobile apps, and even connected devices.
2. Real-Time Behavioral Segmentation
Instead of waiting for post-campaign analysis, ESP enables dynamic audience segmentation based on live behavior. Imagine updating customer personas on the fly as users interact with a product or ad in real time.
3. Instant Trend Detection
With ESP, market researchers can spot emerging trends, spikes in brand mentions, or negative sentiment as it happens, giving companies the edge to react and innovate faster.
4. Improved Campaign Feedback Loops
By streaming campaign data into ESP systems, researchers can assess performance metrics like engagement, bounce rates, or purchase behavior in real time—enabling agile marketing and live optimization.
5. Enriching Traditional Research
Even classic survey research can be elevated. ESP can feed in contextual data (e.g., weather, location, digital footprint) to enhance response interpretation and modeling accuracy.
🚀 Emerging Use Cases
Use CaseESP in ActionSocial Listening at ScaleReal-time monitoring of tweets, posts, or mentions for brand perceptionVoice of the Customer (VoC)Processing live feedback from chat, call centers, or in-app surveysRetail Behavior AnalyticsStreaming in-store or ecommerce interaction data for buyer journey insightsAd Performance TrackingMeasuring campaign impact in real time and adjusting targeting dynamicallyGeo-Contextual SurveysTriggering location-based surveys in response to real-world events
🔍 Market Research Firms Tapping into ESP
Forward-thinking agencies and platforms are now building ESP pipelines into their solutions:
Nielsen is exploring real-time TV and digital media tracking.
Qualtrics and SurveyMonkey are integrating APIs and live data feeds to automate feedback systems.
Custom research agencies are partnering with ESP tech vendors to develop always-on insight platforms.
📈 Strategic Value for Researchers & Brands
Integrating ESP with market research doesn’t just speed things up—it changes the value proposition:Traditional ResearchESP-Enabled ResearchBatch, retrospectiveContinuous, real-timeManual analysisAutomated insightsSample-basedFull-data streamStatic reportsLive dashboardsReactive strategyProactive action
⚠️ Challenges to Consider
Data Overload: Without the right filters and models, ESP can create noise rather than insight.
Technical Skills Gap: Researchers may need to upskill or collaborate with data engineers.
Compliance Risks: Real-time processing must adhere to privacy laws like GDPR and CCPA.
Cost & Infrastructure: ESP requires robust architecture—cloud-native and scalable.
🔮 The Future: Market Research as a Streaming Platform
As ESP becomes more affordable and accessible via cloud platforms, we’ll see the rise of Insight-as-a-Stream—where brands and researchers subscribe to live feeds of behavioral, attitudinal, and transactional data, powered by AI and ESP pipelines.
In this new era, agility becomes a competitive advantage, and ESP is the engine behind it.
Final Thoughts
Event Stream Processing is no longer just for tech giants or financial firms—it’s the future backbone of modern market research. From real-time sentiment analysis to dynamic targeting and predictive behavioral modeling, ESP is enabling insights that are faster, smarter, and more actionable than ever before.
Market researchers who adopt ESP today won't just keep up—they'll lead. The Event Stream Processing market is poised for substantial growth, driven by technological advancements and the increasing need for real-time data analytics across various industries. For a detailed overview and more insights, you can refer to the full market research report by Mordor Intelligence: https://www.mordorintelligence.com/industry-reports/event-stream-processing-market
#event stream processing market#event stream processing market analysis#event stream processing research report#event stream processing market size#event stream processing market share#event stream processing market trends
0 notes
Text
Intro to Web Scraping
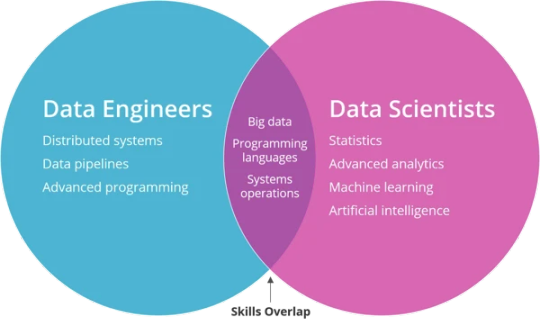
Chances are, if you have access to the internet, you have heard of Data Science. Aside from the buzz generated by the title ‘Data Scientist’, only a few in relevant fields can claim to understand what data science is. The majority of people think, if at all, that a data scientist is a mad scientist type able to manipulate statistics and computers to magically generate crazy visuals and insights seemingly out of thin air.
Looking at the plethora of definitions to be found in numerous books and across the internet of what data science is, the layman’s image of a data scientist may not be that far off.
While the exact definition of ‘data science’ is still a work in progress, most in the know would agree that the data science universe encompasses fields such as:
Big Data
Analytics
Machine Learning
Data Mining
Visualization
Deep Learning
Business Intelligence
Predictive Modeling
Statistics
Data Source: Top keywords

Image Source – Michael Barber
Further exploration of the skillset that goes into what makes a data scientist, consensus begins to emerge around the following:
Statistical Analysis
Programming/Coding Skills: - R Programming; Python Coding
Structured Data (SQL)
Unstructured Data (3-5 top NoSQL DBs)
Machine Learning/Data Mining Skills
Data Visualization
Big Data Processing Platforms: Hadoop, Spark, Flink, etc.
Structured vs unstructured data
Structured data refers to information with a high degree of organization, such that inclusion in a relational database is seamless and readily searchable by simple, straightforward search engine algorithms or other search operation
Examples of structured data include numbers, dates, and groups of words and numbers called strings.
Unstructured data (or unstructured information) is information that either does not have a pre-defined data model or is not organized in a pre-defined manner. Unstructured information is typically text-heavy, but may contain data such as dates, numbers, and facts as well. This results in irregularities and ambiguities that make it difficult to understand using traditional programs as compared to data stored in fielded form in databases or annotated (semantically tagged) in documents.
Examples of "unstructured data" may include books, journals, documents, metadata, health records, audio, video, analog data, images, files, and unstructured text such as the body of an e-mail message, Web pages, or word-processor document. Source: Unstructured data - Wikipedia
Implied within the definition of unstructured data is the fact that it is very difficult to search. In addition, the vast amount of data in the world is unstructured. A key skill when it comes to mining insights out of the seeming trash that is unstructured data is web scraping.
What is web scraping?
Everyone has done this: you go to a web site, see an interesting table and try to copy it over to Excel so you can add some numbers up or store it for later. Yet this often does not really work, or the information you want is spread across a large number of web sites. Copying by hand can quickly become very tedious.
You’ve tried everything else, and you haven’t managed to get your hands on the data you want. You’ve found the data on the web, but, alas — no download options are available and copy-paste has failed you. Fear not, there may still be a way to get the data out. Source: Data Journalism Handbook
As a data scientist, the more data you collect, the better your models, but what if the data you want resides on a website? This is the problem of social media analysis when the data comes from users posting content online and can be extremely unstructured. While there are some websites who support data collection from their web pages and have even exposed packages and APIs (such as Twitter), most of the web pages lack the capability and infrastructure for this. If you are a data scientist who wants to capture data from such web pages then you wouldn’t want to be the one to open all these pages manually and scrape the web pages one by one. Source: Perceptive Analytics
Web scraping, web harvesting, or web data extraction is data scraping used for extracting data from websites. Web scraping software may access the World Wide Web directly using the Hypertext Transfer Protocol, or through a web browser. While web scraping can be done manually by a software user, the term typically refers to automated processes implemented using a bot or web crawler. It is a form of copying, in which specific data is gathered and copied from the web, typically into a central local database or spreadsheet, for later retrieval or analysis. Source: Wikipedia
Web Scraping is a method to convert the data from websites, whether structured or unstructured, from HTML into a form on which analysis can be performed.
The advantage of scraping is that you can do it with virtually any web site — from weather forecasts to government spending, even if that site does not have an API for raw data access. While this method is very powerful and can be used in many places, it requires a bit of understanding about how the web works.
There are a variety of ways to scrape a website to extract information for reuse. In its simplest form, this can be achieved by copying and pasting snippets from a web page, but this can be unpractical if there is a large amount of data to be extracted, or if it spread over a large number of pages. Instead, specialized tools and techniques can be used to automate this process, by defining what sites to visit, what information to look for, and whether data extraction should stop once the end of a page has been reached, or whether to follow hyperlinks and repeat the process recursively. Automating web scraping also allows to define whether the process should be run at regular intervals and capture changes in the data.
https://librarycarpentry.github.io/lc-webscraping/
Web Scraping with R
Atop any data scientist’s toolkit lie Python and R. While python is a general purpose coding language used in a variety of situations; R was built from the ground up to mold statistics and data. From data extraction, to clean up, to visualization to publishing; R is in use. Unlike packages such as tableau, Stata or Matlab which are skewed either towards data manipulation or visualization, R is a general purpose statistical language with functionality cutting across all data management operations. R is also free and open source which contributes to making it even more popular.
To extend the boundaries limiting data scientists from accessing data from web pages, there are packages based on ‘Web scraping’ available in R. Let us look into web scraping technique using R.
Harvesting Data with RVEST
R. Hadley Wickham authored the rvest package for web scraping using R which will be demonstrated in this tutorial. Although web scraping with R is a fairly advanced topic it is possible to dive in with a few lines of code within a few steps and appreciate its utility, versatility and power.
We shall use 2 examples inspired by Julia Silge in her series cool things you can do with R in a tweet:
Scraping the list of districts of Uganda
Getting the list of MPs of the Republic of Rwanda
0 notes
Text
Big Data and Data Engineering
Big Data and Data Engineering are essential concepts in modern data science, analytics, and machine learning.
They focus on the processes and technologies used to manage and process large volumes of data.
Here’s an overview:
What is Big Data? Big Data refers to extremely large datasets that cannot be processed or analyzed using traditional data processing tools or methods.
It typically has the following characteristics:
Volume:
Huge amounts of data (petabytes or more).
Variety:
Data comes in different formats (structured, semi-structured, unstructured). Velocity: The speed at which data is generated and processed.
Veracity: The quality and accuracy of data.
Value: Extracting meaningful insights from data.
Big Data is often associated with technologies and tools that allow organizations to store, process, and analyze data at scale.
2. Data Engineering:
Overview Data Engineering is the process of designing, building, and managing the systems and infrastructure required to collect, store, process, and analyze data.
The goal is to make data easily accessible for analytics and decision-making.
Key areas of Data Engineering:
Data Collection:
Gathering data from various sources (e.g., IoT devices, logs, APIs). Data Storage: Storing data in data lakes, databases, or distributed storage systems. Data Processing: Cleaning, transforming, and aggregating raw data into usable formats.
Data Integration:
Combining data from multiple sources to create a unified dataset for analysis.
3. Big Data Technologies and Tools
The following tools and technologies are commonly used in Big Data and Data Engineering to manage and process large datasets:
Data Storage:
Data Lakes: Large storage systems that can handle structured, semi-structured, and unstructured data. Examples include Amazon S3, Azure Data Lake, and Google Cloud Storage.
Distributed File Systems:
Systems that allow data to be stored across multiple machines. Examples include Hadoop HDFS and Apache Cassandra.
Databases:
Relational databases (e.g., MySQL, PostgreSQL) and NoSQL databases (e.g., MongoDB, Cassandra, HBase).
Data Processing:
Batch Processing: Handling large volumes of data in scheduled, discrete chunks.
Common tools:
Apache Hadoop (MapReduce framework). Apache Spark (offers both batch and stream processing).
Stream Processing:
Handling real-time data flows. Common tools: Apache Kafka (message broker). Apache Flink (streaming data processing). Apache Storm (real-time computation).
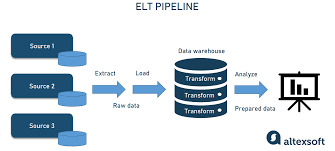
ETL (Extract, Transform, Load):
Tools like Apache Nifi, Airflow, and AWS Glue are used to automate data extraction, transformation, and loading processes.
Data Orchestration & Workflow Management:
Apache Airflow is a platform for programmatically authoring, scheduling, and monitoring workflows. Kubernetes and Docker are used to deploy and scale applications in data pipelines.
Data Warehousing & Analytics:
Amazon Redshift, Google BigQuery, Snowflake, and Azure Synapse Analytics are popular cloud data warehouses for large-scale data analytics.
Apache Hive is a data warehouse built on top of Hadoop to provide SQL-like querying capabilities.
Data Quality and Governance:
Tools like Great Expectations, Deequ, and AWS Glue DataBrew help ensure data quality by validating, cleaning, and transforming data before it’s analyzed.
4. Data Engineering Lifecycle
The typical lifecycle in Data Engineering involves the following stages: Data Ingestion: Collecting and importing data from various sources into a central storage system.
This could include real-time ingestion using tools like Apache Kafka or batch-based ingestion using Apache Sqoop.
Data Transformation (ETL/ELT): After ingestion, raw data is cleaned and transformed.
This may include:
Data normalization and standardization. Removing duplicates and handling missing data.
Aggregating or merging datasets. Using tools like Apache Spark, AWS Glue, and Talend.
Data Storage:
After transformation, the data is stored in a format that can be easily queried.
This could be in a data warehouse (e.g., Snowflake, Google BigQuery) or a data lake (e.g., Amazon S3).
Data Analytics & Visualization:
After the data is stored, it is ready for analysis. Data scientists and analysts use tools like SQL, Jupyter Notebooks, Tableau, and Power BI to create insights and visualize the data.
Data Deployment & Serving:
In some use cases, data is deployed to serve real-time queries using tools like Apache Druid or Elasticsearch.
5. Challenges in Big Data and Data Engineering
Data Security & Privacy:
Ensuring that data is secure, encrypted, and complies with privacy regulations (e.g., GDPR, CCPA).
Scalability:
As data grows, the infrastructure needs to scale to handle it efficiently.
Data Quality:
Ensuring that the data collected is accurate, complete, and relevant. Data
Integration:
Combining data from multiple systems with differing formats and structures can be complex.
Real-Time Processing:
Managing data that flows continuously and needs to be processed in real-time.
6. Best Practices in Data Engineering Modular Pipelines:
Design data pipelines as modular components that can be reused and updated independently.
Data Versioning: Keep track of versions of datasets and data models to maintain consistency.
Data Lineage: Track how data moves and is transformed across systems.
Automation: Automate repetitive tasks like data collection, transformation, and processing using tools like Apache Airflow or Luigi.
Monitoring: Set up monitoring and alerting to track the health of data pipelines and ensure data accuracy and timeliness.
7. Cloud and Managed Services for Big Data
Many companies are now leveraging cloud-based services to handle Big Data:
AWS:
Offers tools like AWS Glue (ETL), Redshift (data warehousing), S3 (storage), and Kinesis (real-time streaming).
Azure:
Provides Azure Data Lake, Azure Synapse Analytics, and Azure Databricks for Big Data processing.
Google Cloud:
Offers BigQuery, Cloud Storage, and Dataflow for Big Data workloads.
Data Engineering plays a critical role in enabling efficient data processing, analysis, and decision-making in a data-driven world.
0 notes
Text
Data engineering
The Backbone of Modern Analytics: Data Engineering in Practice
In an increasingly data-driven world, organizations are constantly leveraging the power of analytics to gain competitive advantages, enhance decision-making, and uncover valuable insights. However, the value of data is only realized when it is structured, clean, and accessible — this is where data engineering comes into play. As the foundational discipline underpinning data science, machine learning, and business intelligence, data engineering is the unsung hero of modern analytics.
In this comprehensive blog, we’ll explore the landscape of data engineering: its definition, components, tools, challenges, and best practices, as well as its pivotal role in today’s digital economy.
What is Data Engineering?
Data engineering refers to the process of designing, building, and maintaining systems and architectures that allow large-scale data to be collected, stored, and analyzed. Data engineers focus on transforming raw, unstructured, or semi-structured data into structured formats that are usable for analysis and business.
Think of data engineering as constructing the "plumbing" of data systems: building pipelines to extract data from various sources, ensuring data quality, transforming it into a usable state, and loading it into systems where analysts and data scientists can access it easily.
The Core Components of Data Engineering
1. Data Collection and Ingestion
Data engineers start by collecting data from various sources like databases, APIs, files, IoT devices, and other third-party systems. Data ingestion is the term given for this process. The incorporation of different systems forms the basis of data ingestion with consistent and efficient importation into centralized repositories.
2. Data Storage
Once consumed, data has to be stored in systems that are scalable and accessible. Data engineers will decide whether to use conventional relational databases, distributed systems such as Hadoop, or cloud-based storage solutions, such as Amazon S3 or Google Cloud Storage. Depending on the volume, velocity, and variety of the data, the choice is made Raw data is rarely usable in its raw form. Data transformation involves cleaning, enriching, and reformatting the data to make it analysis-ready. This process is encapsulated in the ETL (Extract, Transform, Load) or ELT (Extract, Load, Transform) pipelines.
4. Data Pipelines
At the heart of data engineering are data pipelines that automate the movement of data between systems. These can be designed to handle either real-time (streaming) or batch data, based on the use case.
5. Data Quality and Governance
To obtain reliable analytics, the data must be correct and consistent. Data engineers put in validation and deduplication processes and ensure standardization with proper adherence to data governance standards such as GDPR or CCPA.
6. Data Security
Data is a very important business resource, and safeguarding it must be a data engineer's core responsibility. They therefore use encryption, access controls, and other security measures over sensitive information.
Common Tools in Data Engineering
Data engineering has seen lots of change in recent history, with numerous tools having emerged to tackle various themes in the discipline. Following are some of the leading tools:
1. Data Ingestion Tools
Apache Kafka: A distributed event streaming platform ideal for real-time ingestion.
Apache Nifi: Simplifies the movement of data between systems.
Fivetran and Stitch: Cloud-based tools for ETL pipelines.
2. Data Storage Solutions
Relational Databases: MySQL, PostgreSQL, and Microsoft SQL Server.
Distributed Systems: Apache HDFS, Amazon S3, and Google BigQuery.
NoSQL Databases: MongoDB, Cassandra, and DynamoDB.
3. Data Processing Frameworks
Apache Spark: A unified analytics engine for large-scale data processing.
Apache Flink: Focused on stream processing.
Google Dataflow: A cloud-based service for batch and streaming data processing.
4. Orchestration Tools
Apache Airflow: Widely used for scheduling and managing workflows.
Prefect: A more recent alternative to Airflow, with a focus on flexibility.
Dagster: A platform for orchestrating complex data pipelines.
5. Cloud Ecosystems
AWS: Redshift, Glue, and EMR
Google Cloud: BigQuery, Dataflow, and Pub/Sub
Microsoft Azure: Synapse Analytics and Data Factory
The Role of Data Engineers in the Data Ecosystem
Data engineers play a very important role in the larger data ecosystem by working with other data professionals, including data scientists, analysts, and software engineers. Responsibilities include:
Enablement of Data Scientists: Ensuring that high-quality, well-organized data is available for modeling and machine learning tasks.
Enablement of Business Intelligence: Creating data models and warehouses that power dashboards and reports.
Scalability and Performance: Optimize systems for growing datasets with efficient delivery of real-time insights.
Building Resilient Architectures: Ensuring fault tolerance, disaster recovery, and scalability in data systems.
Challenges in Data Engineering
Data engineering is a challenge in its own right While data engineering is quite important, it's by no means without its problems:
1. Managing Data Volume, Velocity, and Variety
The exponential growth of data creates challenges in storage, processing, and integration. Engineers must design systems that scale seamlessly.
2. Data Quality Issues
Handling incomplete, inconsistent, or redundant data requires meticulous validation and cleansing processes.
3. Real-Time Processing
Real-time analytics demands low-latency systems, which can be difficult to design and maintain.
**4. Keeping Up with Technology
The pace of innovation in data engineering tools and frameworks requires continuous learning and adaptation.
5. Security and Compliance
Data security breaches and ever-changing regulations add complexity to building compliant and secure pipelines.
Best Practices in Data Engineering
To address these challenges, data engineers adhere to best practices that ensure reliable and efficient data pipelines:
Scalability Design: Use distributed systems and cloud-native solutions to manage large datasets.
Automation of Repetitive Tasks: Use tools like Airflow and Prefect for workflow automation.
Data Quality: Implement validation checks and error-handling mechanisms.
DevOps Principles: Use CI/CD pipelines for deploying and testing data infrastructure.
Document Everything: Maintain comprehensive documentation for pipelines, transformations, and schemas.
Collaborate Across Teams: Work with analysts and data scientists to get what they need and make it actionable.
The Future of Data Engineering
As the amount of data continues to explode, data engineering will only grow in importance. Some of the key trends that will shape the future are:
1. The Rise of DataOps
DataOps applies DevOps-like principles toward automation, collaboration, and process improvement in data workflows.
2. Serverless Data Engineering
Cloud providers increasingly offer serverless solutions, and engineers can focus on data rather than infrastructure.
3. Real-Time Data Pipelines
As IoT, edge computing, and event-driven architectures become more prominent, real-time processing is no longer the exception but the rule.
4. AI in Data Engineering
Machine learning is being incorporated into data engineering workflows to automate tasks like anomaly detection and schema mapping.
5. Unified Platforms Databricks and Snowflake, among others, are becoming unified platforms to simplify data engineering and analytics.
Why Data Engineering Matters
Companies that put strong data engineering into their practice reap big advantages:
Faster Time-to-Insights: Clean, accessible data facilitates quicker and more reliable decisions.
Stronger Data-Driven Culture: Well-structured data systems enable each member of the team to leverage data.
Cost Savings: Efficient pipelines reduce storage and processing costs.
Innovation Enablement: High-quality data fuels cutting-edge innovations in AI and machine learning.
Conclusion
Data engineering is the backbone of the modern data-driven world. It enables the organization to unlock the full potential of data by building the infrastructure that transforms raw data into actionable insights. The field certainly poses significant challenges, but strong data engineering practices bring great rewards, from enhanced analytics to transformative business outcomes.
As data continues to grow in scale and complexity, the role of data engineers will become even more crucial. Whether you’re an aspiring professional, a business leader, or a tech enthusiast, understanding the principles and practices of data engineering is key to thriving in today’s digital economy.
for more information visit our website
https:// researchpro.online/upcoming
0 notes
Text
Using Amazon Data Firehose For Iceberg Table Replication

Amazon Data Firehose
Dependable real-time stream loading into analytics services, data lakes, and warehouses.
Capturing, transforming, and loading streaming data is simple. With a few clicks, you can create a delivery stream, choose your destination, and begin streaming data in real time.
Provide and scale network, memory, and processing resources automatically without constant management.
Without creating your own processing pipelines, you may dynamically segment streaming data and convert raw streaming data into formats like Apache Parquet.
How it operates
The simplest method for obtaining, transforming, and sending data streams to analytics services, data lakes, and data warehouses in a matter of seconds is offered by Amazon Data Firehose. Setting up a stream with a source, destination, and necessary modifications is necessary in order to use Amazon Data Firehose. The stream is continuously processed by Amazon Data Firehose, which scales automatically according to the volume of data available and provides it in a matter of seconds.
Source
Choose your data stream’s source, such as a stream in Kinesis Data Streams, a topic in Amazon Managed Streaming for Kafka (MSK), or write data using the Firehose Direct PUT API. You can build up a stream from sources like Amazon CloudWatch Logs, AWS WAF web ACL logs, AWS Network Firewall Logs, Amazon SNS, or AWS IoT because Amazon Data Firehose is connected into more than 20 AWS services.
Data Transformation (optional)
Choose whether you wish to decompress the data, execute custom data transformations using your own AWS Lambda function, convert your data stream into formats like Parquet or ORC, or dynamically partition input records based on attributes to send into separate places.
The destination
Choose a destination for your stream, such as Splunk, Snowflake, Amazon Redshift, Amazon OpenSearch Service, Amazon S3, or a custom HTTP endpoint.
Use cases
Flow into warehouses and data lakes
Without creating processing pipelines, stream data into Amazon S3 and transform it into the formats needed for analysis.
Increase security
Use supported Security Information and Event Management (SIEM) solutions to keep an eye on network security in real time and generate warnings when possible threats materialize.
Create applications for ML streaming
To evaluate data and forecast inference endpoints as streams go to their destination, enhance your data streams with machine learning (ML) models.
Use Amazon Data Firehose to replicate database updates to Apache Iceberg tables (in preview)
A new feature in Amazon Data Firehose that records modifications made to databases like PostgreSQL and MySQL and replicates the changes to Apache Iceberg tables on Amazon Simple Storage Service (Amazon S3) is being made available in preview today.
An excellent open-source table format for large data analytics is Apache Iceberg. Open-source analytics engines like Apache Spark, Apache Flink, Trino, Apache Hive, and Apache Impala can operate with the same data simultaneously with Apache Iceberg, which also adds the simplicity and dependability of SQL tables to S3 data lakes.
This new feature offers a straightforward, end-to-end way to stream database updates without affecting database applications’ transaction performance. To transmit change data capture (CDC) updates from your database, you can quickly set up a Data Firehose stream. Data from various databases can now be readily replicated into Iceberg tables on Amazon S3, allowing you to access current data for machine learning (ML) and large-scale analytics applications.
Typical Enterprise clients of Amazon Web Services (AWS) utilize hundreds of databases for transactional applications. They wish to record database changes, such as the addition, modification, or deletion of records in a table, and send the updates to their data warehouse or Amazon S3 data lake in open source table formats like Apache Iceberg so that they can do large-scale analytics and machine learning on the most recent data.
Many clients create extract, transform, and load (ETL) processes to read data from databases on a regular basis in order to accomplish this. However, batch tasks can cause many hours of delay before data is ready for analytics, and ETL readers affect database transaction speed. Customers seek the option to stream database changes in order to lessen the impact on database transaction performance. A change data capture (CDC) stream is the name given to this stream.
Installing and configuring several open-source components is necessary for the initial setup and testing of such systems. Days or weeks may pass. The operational overhead is increased by the engineers’ need to validate and implement open source updates, monitor and manage clusters after setup.
CDC streams from databases can now be continuously replicated to Apache Iceberg tables on Amazon S3 using Amazon Data Firehose’s new data streaming feature. A Data Firehose stream is created by defining its source and destination. An initial data snapshot and all ensuing modifications made to the chosen database tables are captured and continuously replicated by Data Firehose as a data stream. Data Firehose minimizes the impact on database transaction performance by using the database replication log to obtain CDC streams.
AWS Data Firehose automatically splits the data and keeps records until they are sent to their destination, regardless of how frequently the number of database updates changes. Cluster management and fine-tuning, as well as capacity provisioning, are optional. As part of the initial Data Firehose stream creation, Data Firehose can automatically generate Apache Iceberg tables with the same schema as the database tables in addition to the data itself. It can also dynamically develop the target schema, adding additional columns, for example, in response to changes in the source schema.
You don’t need to use open source components, install software upgrades, or pay for overhead because Data Firehose is a fully managed service.
Amazon Data Firehose offers a straightforward, scalable, end-to-end managed solution for delivering CDC streams into your data lake or data warehouse, where you can execute extensive analysis and machine learning applications. It does this by continuously replicating database updates to Apache Iceberg tables in Amazon S3.
Things to be aware of
Here are some other things to be aware of.
The following databases on Amazon RDS and self-managed PostgreSQL and MySQL databases on Amazon EC2 are supported by this new feature:
Amazon Aurora PostgreSQL-Compatible Edition with Amazon RDS for PostgreSQL
Amazon Aurora MySQL-Compatible Edition with Amazon RDS for MySQL
Throughout the trial period and beyond general availability, the team will keep adding support for other databases. They informed me that support for MongoDB, Oracle, and SQL Server databases is already in the works.
Data Firehose connects to databases in your Amazon Virtual Private Cloud (Amazon VPC) via AWS PrivateLink.
You have two options when configuring an Amazon Data Firehose delivery stream: you may define a class of tables and columns using wildcards, or you can specify particular tables and columns. When using wildcards, Data Firehose will automatically construct new tables and columns in the destination if they match the wildcard and are added to the database after the Data Firehose stream is created.
Accessibility
With the exception of the Asia Pacific (Malaysia), AWS GovCloud (US), and China regions, all AWS regions now offer the new data streaming feature.
Amazon Data Firehose pricing
At the start of the preview, there are no fees for your use. In the future, the price will be determined by your actual usage, such as the number of bytes read and supplied. There are no upfront costs or obligations. To learn more, be sure to read the pricing page.
Read more on Govindhtech.com
#AmazonDataFirehose#IcebergTable#Apache#AmazonData#AmazonS3#machinelearning#ML#Cloudcomputing#AWSservices#News#Technews#Technology#Technologynews#Technologytrends#Govindhtech
1 note
·
View note
Text
Data Engineering Services Explained: What Lies Ahead for the Industry
In an era where data shapes every aspect of business decision-making, organizations are turning to data engineering to harness its full potential. As data volumes and complexities escalate, the demand for specialized data engineering services has surged. This article delves into the core components of data engineering services and offers insights into the evolving future of this critical field.

What are Data Engineering Services?
Data engineering involves the design, construction, and maintenance of systems and infrastructure that allow for the collection, storage, processing, and analysis of data. Data engineering services encompass a variety of tasks and functions that ensure data is accessible, reliable, and usable for data scientists, analysts, and business stakeholders. Key components of data engineering services include:
1. Data Architecture
Data engineers are responsible for designing data architectures that define how data is collected, stored, and accessed. This includes selecting appropriate databases, data lakes, and data warehouses to optimize performance and scalability.
2. Data Integration
Data often comes from multiple sources, including transactional systems, external APIs, and sensor data. Data engineering services involve creating ETL (Extract, Transform, Load) processes that integrate data from these various sources into a unified format.
3. Data Quality and Governance
Ensuring data quality is critical for accurate analysis. Data engineers implement data validation and cleansing processes to identify and rectify errors. They also establish governance frameworks to maintain data integrity and compliance with regulations.
4. Data Pipeline Development
Data pipelines automate the flow of data from its source to storage and processing systems. Data engineering services focus on building efficient pipelines that can handle large volumes of data while ensuring minimal latency.
5. Performance Optimization
As organizations scale, performance becomes a crucial consideration. Data engineers optimize databases and pipelines for speed and efficiency, enabling faster data retrieval and processing.
6. Collaboration with Data Teams
Data engineers work closely with data scientists, analysts, and other stakeholders to understand their data needs. This collaboration ensures that the data infrastructure supports analytical initiatives effectively.
The Future of Data Engineering
As the field of data engineering evolves, several trends are shaping its future:
1. Increased Automation
Automation is set to revolutionize data engineering. Tools and platforms are emerging that automate repetitive tasks such as data cleansing, pipeline management, and monitoring. This will allow data engineers to focus on more strategic initiatives rather than manual processes.
2. Real-time Data Processing
With the rise of IoT devices and streaming applications, the demand for real-time data processing is growing. Future data engineering services will increasingly incorporate technologies like Apache Kafka and Apache Flink to facilitate real-time data ingestion and analytics.
3. Cloud-based Solutions
Cloud computing is becoming the norm for data storage and processing. Data engineering services will continue to leverage cloud platforms like AWS, Google Cloud, and Azure, offering greater scalability, flexibility, and cost-effectiveness.
4. DataOps
DataOps is an emerging discipline that applies agile methodologies to data management. It emphasizes collaboration, continuous integration, and automation in data pipelines. As organizations adopt DataOps, the role of data engineers will shift toward ensuring seamless collaboration across data teams.
5. Focus on Data Security and Privacy
With growing concerns about data security and privacy, data engineers will play a vital role in implementing security measures and ensuring compliance with regulations like GDPR and CCPA. Future services will prioritize data protection as a foundational element of data architecture.
6. Integration of AI and Machine Learning
Data engineering will increasingly intersect with artificial intelligence and machine learning. Data engineers will need to build infrastructures that support machine learning models, ensuring they have access to clean, structured data for training and inference.
Conclusion
Data engineering services are essential for organizations seeking to harness the power of data. As technology continues to advance, the future of data engineering promises to be dynamic and transformative. With a focus on automation, real-time processing, cloud solutions, and security, data engineers will be at the forefront of driving data strategy and innovation. Embracing these trends will enable organizations to make informed decisions, optimize operations, and ultimately gain a competitive edge in their respective industries.
#Data Engineering Services#Data Security#Data Privacy#Future of Data Engineering#Data Architecture#Data Governance
0 notes
Text
What is big data analysis?
Big data analysis refers to the process of examining large and complex datasets, often involving high volumes, velocities, and varieties of data, to uncover hidden patterns, unknown correlations, market trends, customer preferences, and other useful business information. The goal is to gain actionable insights that can inform decision-making and strategic planning.

Key Components of Big Data Analysis
Data Collection:
Sources: Data is collected from a wide range of sources, including social media, sensors, transaction records, log files, and more.
Techniques: Involves using technologies like web scraping, data APIs, and IoT devices to gather data.
Data Storage:
Scalable Storage Solutions: Due to the large volume of data, scalable storage solutions like Hadoop Distributed File System (HDFS), NoSQL databases (e.g., Cassandra, MongoDB), and cloud storage (e.g., Amazon S3, Google Cloud Storage) are used.
Data Processing:
Distributed Processing: Tools like Apache Hadoop and Apache Spark are used to process data in parallel across a distributed computing environment.
Real-Time Processing: For data that needs to be analyzed in real-time, tools like Apache Kafka and Apache Flink are employed.
Data Cleaning and Preparation:
Data Cleaning: Involves removing duplicates, handling missing values, and correcting errors to ensure data quality.
Data Transformation: Converting data into a format suitable for analysis, which may involve normalization, aggregation, and other preprocessing steps.
Data Analysis:
Descriptive Analytics: Summarizes historical data to understand what has happened in the past.
Diagnostic Analytics: Investigates why something happened by identifying patterns and relationships in the data.
Predictive Analytics: Uses statistical models and machine learning techniques to forecast future trends and outcomes.
Prescriptive Analytics: Recommends actions based on the analysis to optimize business processes and outcomes.
Data Visualization:
Tools: Tools like Tableau, Power BI, and D3.js are used to create visual representations of the data, such as charts, graphs, and dashboards.
Purpose: Helps in understanding complex data through visual context, making it easier to identify patterns and insights.
Machine Learning and AI:
Algorithms: Machine learning algorithms, such as clustering, classification, regression, and deep learning, are applied to discover patterns and make predictions.
Libraries: Popular libraries include TensorFlow, PyTorch, Scikit-learn, and MLlib (Spark’s machine learning library).
Benefits of Big Data Analysis
Improved Decision-Making: By providing data-driven insights, organizations can make more informed decisions.
Operational Efficiency: Identifying inefficiencies and optimizing processes to reduce costs and improve productivity.
Enhanced Customer Experience: Understanding customer behavior and preferences to personalize services and improve satisfaction.
Risk Management: Detecting and mitigating risks, such as fraud detection in financial services.
Innovation: Identifying new opportunities and trends to drive innovation and stay competitive.
Challenges in Big Data Analysis
Data Quality: Ensuring the accuracy, completeness, and reliability of data.
Data Integration: Combining data from diverse sources and formats.
Scalability: Managing and processing the sheer volume of data.
Privacy and Security: Protecting sensitive data and complying with regulations.
Skill Gap: The need for skilled professionals who can work with big data technologies and tools.
Examples of Big Data Analysis Applications
Healthcare: Analyzing patient data to improve diagnosis and treatment, and to predict disease outbreaks.
Retail: Personalizing marketing efforts and optimizing supply chain management.
Finance: Detecting fraudulent activities and managing risk.
Manufacturing: Predictive maintenance to reduce downtime and improve efficiency.
Telecommunications: Optimizing network performance and enhancing customer service.
In summary, big data analysis involves a comprehensive approach to collecting, storing, processing, and analyzing large datasets to extract valuable insights and drive better business outcomes.
0 notes
Link
#BigData#DataLake#DeltaLake#DWH#ETL#PySpark#Python#Security#Spark#SQL#архитектура#безопасность#Большиеданные#обработкаданных
0 notes
Text
Mijn Reis in Huis Automatisering: Van Homey tot Slimme Apparaten

Mijn avontuur met huis automatisering begon in 2016 met de aanschaf van Homey, een centrale hub waarmee ik verschillende slimme apparaten in mijn huis kon verbinden. Mijn eerste stappen in huisautomatisering waren simpel maar magisch: lampen die via een API konden knipperen en een koffiezetapparaat dat opwarmde voordat ik naar beneden kwam. Deze eerste ervaring opende de deur naar een wereld van mogelijkheden.
In de loop der jaren is mijn verzameling domotica-apparaten flink gegroeid. Van slimme verlichting en slimme stekkers tot geavanceerde sensoren die mijn huis nog slimmer maken. Hoewel ik sommige producten, zoals slimme koelkasten en tv’s, niet nodig acht, blijf ik altijd op zoek naar nieuwe slimme oplossingen die mijn dagelijks leven makkelijker maken.
Bij elke nieuwe aankoop vraag ik mezelf af of het apparaat slim moet zijn en of het ondersteund wordt door Homey. Deze overweging helpt me om mijn huis efficiënt en technologisch geavanceerd te houden, zonder onnodige gadgets. Huis automatisering heeft mijn leven veranderd en blijft me fascineren met de mogelijkheden die het biedt.
Meer over mijn ervaringen en de inrichting van mijn slimme huis lees je op jeroen.nl.
0 notes
Text
Were partnering with Flinks to improve your bank feeds in Xero
We’re partnering with Flinks to improve your bank feeds in Xero https://blog.xero.com/product-updates/partnering-with-flinks-improve-bank-feeds/ We know the insights you get out of Xero are only as good as the data that goes in. That’s why we’re committed to improving both the number and quality of bank feeds across Canada and the US. It’s something we promised you we would focus on, and we’re excited to share that we’ve made some great progress. Today, we’ve announced a new partnership with Flinks, which will give you access to more than 20 high-quality bank feeds in Xero. These include, but are not limited to, direct bank feeds with the National Bank of Canada and EQ Bank, as well as several US-based banks. Our friends at Flinks are as committed to championing the benefits of open banking as we are. Together, we’re excited about the opportunity to empower you and your clients to achieve your financial goals, while staying in control of your banking data. Partnerships like this are so important to our team — it means that instead of connecting to thousands of banks and other financial institutions across Canada and the US individually, we can have a small number of trusted partnerships that provide us with access to secure and reliable bank feeds. The best news? As Flinks connects to more banks with direct API connections, you’ll get access to those bank feeds once they’re available. This means you’ll spend less time on manual data entry and reconciliation, while having an up-to-date view of your finances. If you haven’t set up a bank feed in Xero, it’s really easy (just make sure you have online banking set up first). All you need to do is go into Xero and search the list of banks to see if they offer a bank feed. Then log into your bank account and confirm the connection. Customers have told us that using our bank feeds and reconciliation tools save them up to five and a half hours a week. So it’s a huge time saver. Don’t forget, you can also get banking data into Xero by uploading bank transactions manually, or using our bank statement extraction tool in Hubdoc. We can’t wait to hear what you think about our new bank feeds in Xero. As always, feel free to share your thoughts over at Xero Product Ideas. We have big plans and this is just the beginning of our work to help you get better data into Xero, and better insights out. The post We’re partnering with Flinks to improve your bank feeds in Xero appeared first on Xero Blog. via Xero Blog https://blog.xero.com/ December 17, 2023 at 09:40PM
0 notes
Text
Essential Components of a Data Pipeline

Modern businesses utilize multiple platforms to manage their routine operations. It results in the generation and collection of large volumes of data. With ever-increasing growth and the use of data-driven applications, consolidating data from multiple sources has become a complex process. It is a crucial challenge to use data to make informed decisions effectively.
Data is the foundation for analytics and operational efficiency, but processing this big data requires comprehensive data-driven strategies to enable real-time processing. The variety and velocity of this big data can be overwhelming, and a robust mechanism is needed to merge these data streams. This is where data pipelines come into the picture.
In this blog post, we will define a data pipeline and its key components.
What is a Data Pipeline?
Data can be sourced from databases, files, APIs, SQL, etc. However, this data is often unstructured and not ready for immediate use, and the responsibility of transforming the data into a structured format that can be sent to data pipelines falls on data engineers or data scientists.
A data pipeline is a technique or method of collecting raw, unstructured data from multiple sources and then transferring it to data stores or depositories such as data lakes or data warehouses. But before this data is transferred to a data depository, it usually has to undergo some form of data processing. Data pipelines consist of various interrelated steps that enable data movement from its origin to the destination for storage and analysis. An efficient data pipeline facilitates the management of volume, variety and velocity of data in these applications.
Components Of A Scalable Data Pipeline
Data Sources: Considered as the origins of data. It could be databases, web services, files, sensors, or other systems that generate or store data.
Data Ingestion: Data must be collected and ingested into the pipeline from various sources. It would involve batch processing (periodic updates) or real-time streaming (continuous data flow). The most common tools for ingestion include Apache Kafka, Apache Flume, or cloud-based services like AWS Kinesis or Azure Event Hubs.
Data Transformation: As this data moves through the pipeline, it often needs to be transformed, cleaned, and enriched. Further, it would involve data parsing, filtering, aggregating, joining, and other operations. Tools like Apache Spark and Apache Flink or stream processing frameworks like Kafka Streams or Apache Beam are used.
Data Storage: Data is typically stored in a scalable and durable storage system after transformation. Common choices include data lakes (like Amazon S3 or Hadoop HDFS), relational databases, NoSQL databases (e.g., Cassandra, MongoDB), or cloud-based storage solutions.
Data Processing: This component involves performing specific computations or analytics on the data. It can include batch processing using tools like Hadoop MapReduce or Apache Spark or real-time processing using stream processing engines like Apache Flink or Apache Kafka Streams.
Data Orchestration: Managing data flow through the pipeline often requires orchestration to ensure that various components work together harmoniously. Workflow management tools like Apache Airflow or cloud-based orchestration services like AWS Step Functions can be used.
Data Monitoring and Logging: It's essential to monitor the health and performance of your data pipeline. Logging, metrics, and monitoring solutions like ELK Stack (Elasticsearch, Logstash, Kibana), Prometheus, or cloud-based monitoring services (e.g., AWS CloudWatch) help track and troubleshoot issues.
Data Security: Ensuring data security and compliance with regulations is crucial. Encryption, access controls, and auditing mechanisms are essential to protect sensitive data.
Scalability and Load Balancing: The pipeline should be designed to handle increasing data volumes and traffic. Horizontal scaling, load balancing, and auto-scaling configurations are essential to accommodate growth.
Fault Tolerance and Reliability: Building fault-tolerant components and incorporating redundancy is critical to ensure the pipeline continues to operate in the event of failures.
Data Quality and Validation: Implement data validation checks and quality assurance measures to detect and correct errors in the data as it flows through the pipeline.
Metadata Management: Managing metadata about the data, such as data lineage, schema evolution, and versioning, is essential for data governance and maintaining data integrity.
Data Delivery: After processing, data may need to be delivered to downstream systems, data warehouses, reporting tools, or other consumers. This can involve APIs, message queues, or direct database writes.
Data Retention and Archiving: Define policies for data retention and archiving to ensure data is stored appropriately and complies with data retention requirements and regulations.
Scaling and Optimization: Continuously monitor and optimize the pipeline's performance, cost, and resource utilization as data volumes and requirements change.
Documentation and Collaboration: Maintain documentation that outlines the pipeline's architecture, components, and data flow. Collaboration tools help teams work together on pipeline development and maintenance.
Conclusion
These components of a data pipeline are essential for working with big data. Understanding these components and their role in the data pipeline makes it possible to design and build efficient, scalable, and adaptable systems to the changing needs. You can get the help of a specialist company that offers services for data engineering to help design and build systems for data collection, storage and analysis.
0 notes
Text
Java for Big Data: Processing and Analysis
In the ever-evolving realm of Java Development, the intersection of Java and Big Data is a powerful domain. Mastering the use of Java for processing and analyzing vast datasets is not only a valuable skill but also a strategic move for those seeking a career in software development and aiming for Java developer jobs. This article explores the significance of Java in Big Data processing and analysis, its relevance in the world of software development, and how it can propel your career, including its value in a Java Training Course.
The Role of Java in Big Data
Before diving into the significance, let's understand the role of Java in the context of Big Data:
1. Hadoop Ecosystem:
Java is the primary language used in the Hadoop ecosystem, a framework designed for distributed storage and processing of large datasets. Hadoop includes components like Hadoop Distributed File System (HDFS) and MapReduce, which are written in Java.
2. Apache Spark:
Apache Spark, another popular Big Data processing framework, has extensive support for Java. It allows developers to write Spark applications in Java to process data in-memory, making it significantly faster than traditional batch processing.
3. Libraries and APIs:
Java offers numerous libraries and APIs for working with Big Data technologies, such as Apache HBase for NoSQL databases, Apache Kafka for streaming data, and Apache Flink for real-time processing.
4. Scalability:
Java's scalability makes it suitable for handling the massive volume, variety, and velocity of data generated in Big Data applications. Java applications can be distributed across clusters of machines to process data in parallel.
The Significance of Java in Big Data Processing
Now, let's explore why Java is significant in the domain of Big Data processing and analysis:
1. Compatibility and Portability:
Java's "write once, run anywhere" philosophy makes it an excellent choice for Big Data projects. Code written in Java can be executed on different platforms without modification, enhancing the portability of Big Data applications.
2. Mature Ecosystem:
The Hadoop ecosystem, centered around Java, is mature and widely adopted in the industry. It offers a range of tools and technologies for storing, processing, and analyzing Big Data efficiently.
3. Performance:
Java's performance capabilities, especially when combined with in-memory processing frameworks like Apache Spark, allow for high-speed data analysis and computation, crucial in the world of Big Data.
4. Versatility:
Java's versatility allows developers to build diverse Big Data applications, from batch processing with MapReduce to real-time streaming with Apache Kafka, addressing various Big Data use cases.
5. Skill Demand:
As organizations increasingly adopt Big Data technologies, the demand for skilled Java developers who can work in the Big Data domain is on the rise. Job opportunities in Big Data-related Java developer roles are abundant and diverse.
Mastering Java for Big Data
To leverage Java for Big Data processing and analysis and advance your career in software development, consider the following steps:
1. Learning Resources:
Enroll in a Java Training Course that includes comprehensive coverage of Big Data technologies and their integration with Java.
2. Hands-on Experience:
Work on Big Data projects using Java and related frameworks. Practical experience is invaluable for mastering the domain.
3. Explore Big Data Tools:
Familiarize yourself with Big Data tools and frameworks like Hadoop, Spark, Flink, and Kafka. Understand how Java fits into the ecosystem.
4. Collaboration and Networking:
Collaborate with professionals in the Big Data field. Attend conferences and meetups to expand your network and stay updated on industry trends.
5. Continuous Learning:
Keep learning and evolving with the fast-paced world of Big Data. Explore new technologies, stay updated on Java updates, and deepen your expertise.
Conclusion:
Java's role in Big Data processing and analysis is undeniable. Whether you're enrolled in a Java Training Course, actively seeking Java developer jobs, or striving to advance your career, mastering Java for Big Data opens doors to a world of opportunities. It empowers you to work with large and complex datasets, tackle real-world business challenges, and position yourself as a skilled and competitive Java developer in the rapidly growing domain of Big Data.
0 notes
Text
Apache Beam For Beginners: Building Scalable Data Pipelines
Apache Beam
Apache Beam, the simplest method for streaming and batch data processing. Data processing for mission-critical production workloads can be written once and executed anywhere.
Overview of Apache Beam
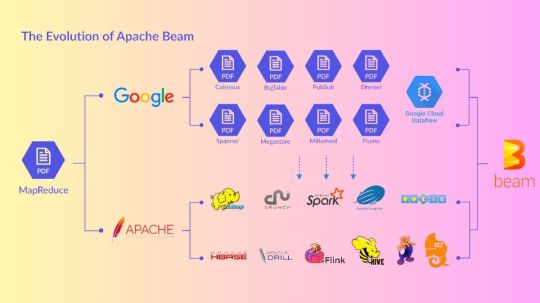
An open source, consistent approach for specifying batch and streaming data-parallel processing pipelines is called Apache Beam. To define the pipeline, you create a program using one of the open source Beam SDKs. One of Beam’s supported distributed processing back-ends, such as Google Cloud Dataflow, Apache Flink, or Apache Spark, then runs the pipeline.
Beam is especially helpful for situations involving embarrassingly parallel data processing, where the issue may be broken down into numerous smaller data bundles that can be handled separately and concurrently. Beam can also be used for pure data integration and Extract, Transform, and Load (ETL) activities. These operations are helpful for loading data onto a new system, converting data into a more suitable format, and transferring data between various storage media and data sources.Image credit to Apache Beam
How Does It Operate?
Sources of Data
Whether your data is on-premises or in the cloud, Beam reads it from a wide range of supported sources.
Processing Data
Your business logic is carried out by Beam for both batch and streaming usage cases.
Writing Data
The most widely used data sinks on the market receive the output of your data processing algorithms from Beam.
Features of Apache Beams
Combined
For each member of your data and application teams, a streamlined, unified programming model for batch and streaming use cases.
Transportable
Run pipelines across several execution contexts (runners) to avoid lock-in and provide flexibility.
Wide-ranging
Projects like TensorFlow Extended and Apache Hop are built on top of Apache Beam, demonstrating its extensibility.
Open Source
Open, community-based support and development to help your application grow and adapt to your unique use cases.
Apache Beam Pipeline Runners
The data processing pipeline you specify with your Beam program is converted by the Beam Pipeline Runners into an API that works with the distributed processing back-end of your choosing. You must designate a suitable runner for the back-end where you wish to run your pipeline when you run your Beam program.
Beam currently supports the following runners:
The Direct Runner
Runner for Apache Flink Apache Flink
Nemo Runner for Apache
Samza the Apache A runner Samza the Apache
Spark Runner for Apache Spark by Apache
Dataflow Runner for Google Cloud Dataflow on Google Cloud
Jet Runner Hazelcast Jet Hazelcast
Runner Twister 2
Get Started
Get Beam started on your data processing projects.
Visit our Getting started from Apache Spark page if you are already familiar with Apache Spark.
As an interactive online learning tool, try the Tour of Beam.
For the Go SDK, Python SDK, or Java SDK, follow the Quickstart instructions.
For examples that demonstrate different SDK features, see the WordCount Examples Walkthrough.
Explore our Learning Resources at your own speed.
on detailed explanations and reference materials on the Beam model, SDKs, and runners, explore the Documentation area.
Learn how to run Beam on Dataflow by exploring the cookbook examples.
Contribute
The Apache v2 license governs Beam, a project of the Apache Software Foundation. Contributions are highly valued in the open source community of Beam! Please refer to the Contribute section if you would want to contribute.
Apache Beam SDKs
Whether the input is an infinite data set from a streaming data source or a finite data set from a batch data source, the Beam SDKs offer a uniform programming model that can represent and alter data sets of any size. Both bounded and unbounded data are represented by the same classes in the Beam SDKs, and operations on the data are performed using the same transformations. You create a program that specifies your data processing pipeline using the Beam SDK of your choice.
As of right now, Beam supports the following SDKs for specific languages:
Java SDK for Apache Beam Java
Python’s Apache Beam SDK
SDK Go for Apache Beam Go
Apache Beam Python SDK
A straightforward yet effective API for creating batch and streaming data processing pipelines is offered by the Python SDK for Apache Beam.
Get started with the Python SDK
Set up your Python development environment, download the Beam SDK for Python, and execute an example pipeline by using the Beam Python SDK quickstart. Next, learn the fundamental ideas that are applicable to all of Beam’s SDKs by reading the Beam programming handbook.
For additional details on specific APIs, consult the Python API reference.
Python streaming pipelines
With Beam SDK version 2.5.0, the Python streaming pipeline execution is possible (although with certain restrictions).
Python type safety
Python lacks static type checking and is a dynamically typed language. In an attempt to mimic the consistency assurances provided by real static typing, the Beam SDK for Python makes use of type hints both during pipeline creation and runtime. In order to help you identify possible issues with the Direct Runner early on, Ensuring Python Type Safety explains how to use type hints.
Managing Python pipeline dependencies
Because the packages your pipeline requires are installed on your local computer, they are accessible when you execute your pipeline locally. You must, however, confirm that these requirements are present on the distant computers if you wish to run your pipeline remotely. Managing Python Pipeline Dependencies demonstrates how to enable remote workers to access your dependencies.
Developing new I/O connectors for Python
You can develop new I/O connectors using the flexible API offered by the Beam SDK for Python. For details on creating new I/O connectors and links to implementation guidelines unique to a certain language, see the Developing I/O connectors overview.
Making machine learning inferences with Python
Use the RunInference API for PyTorch and Scikit-learn models to incorporate machine learning models into your inference processes. You can use the tfx_bsl library if you’re working with TensorFlow models.
The RunInference API allows you to generate several kinds of transforms since it accepts different kinds of setup parameters from model handlers, and the type of parameter dictates how the model is implemented.
An end-to-end platform for implementing production machine learning pipelines is called TensorFlow Extended (TFX). Beam has been integrated with TFX. Refer to the TFX user handbook for additional details.
Python multi-language pipelines quickstart
Transforms developed in any supported SDK language can be combined and used in a single multi-language pipeline with Apache Beam. Check out the Python multi-language pipelines quickstart to find out how to build a multi-language pipeline with the Python SDK.
Unrecoverable Errors in Beam Python
During worker startup, a few typical mistakes might happen and stop jobs from commencing. See Unrecoverable faults in Beam Python for more information on these faults and how to fix them in the Python SDK.
Apache Beam Java SDK
A straightforward yet effective API for creating batch and streaming parallel data processing pipelines in Java is offered by the Java SDK for Apache Beam.
Get Started with the Java SDK
Learn the fundamental ideas that apply to all of Beam’s SDKs by beginning with the Beam Programming Model.
Further details on specific APIs can be found in the Java API Reference.
Supported Features
Every feature that the Beam model currently supports is supported by the Java SDK.
Extensions
A list of available I/O transforms may be found on the Beam-provided I/O Transforms page.
The following extensions are included in the Java SDK:
Inner join, outer left join, and outer right join operations are provided by the join-library.
For big iterables, sorter is a scalable and effective sorter.
The benchmark suite Nexmark operates in both batch and streaming modes.
A batch-mode SQL benchmark suite is called TPC-DS.
Euphoria’s Java 8 DSL for BEAM is user-friendly.
There are also a number of third-party Java libraries.
Java multi-language pipelines quickstart
Transforms developed in any supported SDK language can be combined and used in a single multi-language pipeline with Apache Beam. Check out the Java multi-language pipelines quickstart to find out how to build a multi-language pipeline with the Java SDK.
Read more on govindhtech.com
#ApacheBeam#BuildingScalableData#Pipelines#Beginners#ApacheFlink#SourcesData#ProcessingData#WritingData#TensorFlow#OpenSource#GoogleCloud#ApacheSpark#ApacheBeamSDK#technology#technews#Python#machinelearning#news#govindhtech
0 notes
Text
Heltec ESP8266 und OLED: Eine ideale Kombination für DIY-Projekte

Hey, ich zeige dir heute, wie du den ESP8266 Mikrocontroller von Heltec programmierst und mit dem kleinen OLED Display beeindruckende Daten darstellen kannst. In meinem Beispiel werde ich eine API einer Newsseite anzapfen und die aktuellen News auf dem Display anzeigen lassen. Es ist erstaunlich, welche Möglichkeiten sich mit dem ESP8266 und dem Heltec OLED eröffnen. Als Anfänger wirst du Schritt für Schritt lernen, wie du den Mikrocontroller einrichtest und die Daten abrufst. Zusammen tauchen wir in die faszinierende Welt der Programmierung ein und entdecken, wie einfach es ist, Daten auf dem OLED Display zum Leben zu erwecken. Bereit für dieses spannende Abenteuer? Dann lass uns loslegen!

Heltec ESP8266 und OLED: Eine ideale Kombination für DIY-Projekte Disclaimer: Ich möchte darauf hinweisen, dass ich den erwähnten ESP8266 Mikrocontroller mit integriertem 0,91" OLED Display von der Firma AZ-Delivery persönlich erworben habe. Ich stehe in keinem geschäftlichen Verhältnis zu AZ-Delivery und erhalte keinerlei finanzielle Vergütung für die Erwähnung oder Empfehlung ihrer Produkte. Falls du Interesse hast, den Mikrocontroller zu erwerben, kannst du ihn derzeit für 7,88 € zzgl. Versandkosten auf ihrer Website unter https://www.azdelivery.de/collections/esp8266/products/esp8266-mikrocontroller-mit-integrierten-0-91-oled-display finden.

ESP8266 mit OLED Display

ESP8266 mit OLED Display

ESP8266 mit OLED Display
Schon wieder ein ESP8266?
Es gibt bereits diverse Varianten des ESP8266 auf dem Markt und dieses ist auch nicht der erste mit einem OLED Display. Du findest zum Beispiel den Wemos D1 Mini mit einem kleinen OLED Display für denselben Preis. Der Preis ist mit knapp 8€ zzgl. Versandkosten recht moderat, aber dieser wird aus Deutschland geliefert und somit war die Lieferzeit mit 3 Tagen recht flink.
Warum also genau dieser ESP8266?
Für mich war klar, dass ich diesen mir holen musste, weil ich einfach die kleinen Mikrocontroller sammle und viel mit diesen bastle. Ein großer Vorteil ist, dass bei diesem bereits ein OLED Display montiert ist und somit zumindest der Anschluss via I2C entfällt.

Ansicht von Oben

Ansicht von Unten Ich kann dir diesen kleinen Mikrocontroller empfehlen, wenn du noch keinen ESP8266 hast und erste kleine Projekte mit diesem bewerkstelligen möchtest. Hier ist auch der Vorteil, dass bereits das Display vormontiert ist und du somit recht einfach Sensordaten oder in der Nähe befindliche WiFi-Netzwerke anzeigen lassen kannst.
Technische Daten des ESP8266 von Heltec mit OLED Display
Kommen wir zunächst zu den technischen Daten des Mikrocontrollers: ChipESP8266, Tensilica L106 32-Bit-ProzessorTaktgeschwindigkeitbis zu 160 MHzHerstellerEspressifSpeicherFlash: 4MB, OTA: 512 KBGPIOs11 GPIOs, davon neun PWM Pins, ein analoger PinSchnittstellenUART, SPI, I2C, I2SOLED DisplayAuflösung: 128x32 Punkte, Farbe: Schwarz / WeißWiFi802.11 b/g/n, 2,4 Ghz (2400 MHz ~ 2483.5 MHz)Wi-Fi ModeStation, SoftAP, SoftAP+StationSecurityWPA, WPA2EncryptionWEP, TKIP, AESAuszug aus den technischen Daten des ESP8266EX von Espressif Das Datenblatt als PDF-Dokument zum ESP8266 findest du bei AZ-Delivery in englischer Sprache.

ESP8266EX Chip
Lieferumfang des ESP8266 von Heltec
Der Mikrocontroller wird mit zwei Stiftleisten und ein Anschlusskabel für eine LiPo Batterie geliefert.

Lieferumfang des ESP8266 von Heltec
Anschluss an den PC
Für die USB-Serielle Verbindung ist ein CH9102 verbaut.

Solltest du also Probleme haben, dass der Mikrocontroller nicht erkannt wird, dann musst du den Treiber installieren. Diesen findest du zbsp. auf dem GitHub Repository Xinyuan-LilyGO/CH9102_Driver.
Erfahrung mit dem Mikrocontroller
Ich habe mit diesem kleinen Mikrocontroller einige kleine Projekte aufgebaut und möchte dir in diesem Abschnitt von meinen Erfahrungen berichten. Schlechte Reichweite, instabile WiFi-Verbindung Zunächst möchte ich damit beginnen, die doch recht mäßige Reichweite des WiFis zu erwähnen. Ich habe hier einen WiFi Accesspoint von der Firma TP-Link welcher seinen Dienst zuverlässig verrichtet und mit so ziemlich jedem WiFi-fähigen Mikrocontroller (2,4 HG & 5 GHz) zusammen arbeitet. Mit einem WiFi-Scanner konnte ich das Netzwerk sehen, aber im nächsten Durchgang war dieses wieder weg.

Ergebniss eines WiFi-Scan mit dem ESP8266 von Heltec Ein Nachtest mit einem anderen ESP8266 ergab eine zuverlässige, stabile Verbindung. Meine Lösung dazu war, dass ich mit meinem Handy einen Hotspot aufgebaut und mit diesem gearbeitet habe.
News auf dem Display anzeigen lassen
Wollen wir nun einmal mit der Programmierung beginnen und ein kleines Projekt mit diesem starten. Ich hatte dir ja bereits einige Beiträge mit dem ESP8266 auf diesem Blog präsentiert, wo ich diverse Sensoren & Aktoren angebunden habe. - ESP8266 für Blynk einrichten - Füllstandsanzeige mit ESP8266, Ultraschall Abstandssensor & ESPEasy - ESP8266 – Alexa gesteuerte Steckdose Hier möchte ich jetzt einen Schritt weiter gehen und eine Schnittstelle von einer News-Seite anzapfen und auf dem Display die Daten anzeigen. Download des Codes als ZIP-Datei Hier nun das Programm zum Lesen der News von NewsApi.org für den ESP8266. Programm zum laden von News von NewsApi.org für den ESP8266 Schritt 1 - Einrichten eines Accounts bei https://newsapi.org/ Es gibt im Internet diverse Seiten wo man News Beiträge abrufen kann, jedoch benötigst du bei den meisten leider einen kostenpflichtigen Account. Auf der Seite https://newsapi.org/ kannst du dir einen kostenfreien Account anlegen und über diesen bis zu 100 Beiträge pro Tag kostenfrei beziehen. Das sollte für unser kleines Projekt ausreichen.


Es gibt hier Double-Opt-in d.h. du bekommst keine E-Mail nach der Anmeldung, das ist rechtlich sehr schwierig. Jedoch kannst du hier auch Fake Daten eingeben und erhältst trotzdem einen gültigen ApiKey zum Portal. Schritt 2 - Abfrage der News Api per Postman Bevor wir mit der eigentlichen Programmierung beginnen, erstellen wir einen Request mit der Anwendung Postman dieses hat den Vorteil, dass wir erst einmal etwas herumspielen können und müssen nicht immer gleich das Programm auf den Mikrocontroller aufspielen. Wenn wir nun einen Request mit der nachfolgenden Adresse absenden, dann erhalten wir einen JSON Response https://newsapi.org/v2/top-headlines?country=de&pageSize=2&apiKey=7274xxxxxx05f3 { "status": "ok", "totalResults": 34, "articles": } Schritt 3 - Programmieren des ESP8266 in der Arduino IDE 2.0 Nachdem wir nun ermittelt haben, wie wir einen Request an die Api von NewsApi.org absenden können, wollen wir dieses in ein kleines Arduino Sketch schreiben. Installieren des Boardtreibers für den ESP8266 Damit wir den ESP8266 auswählen können, müssen wir zunächst die nachfolgende URL in den Einstellungen zu den "zusätzlichen Boardverwalter URLs" hinzufügen. https://arduino.esp8266.com/stable/package_esp8266com_index.json Wenn diese Adresse eingetragen ist, dann kann im Boardverwalter (1) nach ESP8266 (2) gesucht werden. In meinem Fall habe ich diesen Treiber bereits installiert und sehe die Schaltfläche "REMOVE" (3) in deinem Fall solltest du "INSTALL" sehen. Wenn du diese Schaltfläche betätigt hast und danach der Treiber erfolgreich installiert wurde, dann sollte zusätzlich ein Label " installed" (4) erscheinen.

Auswahl des ESP8266 Nachdem der Boardtreiber installiert wurde, können wir diesen aus der Liste auswählen. In meinem Fall habe ich den Eintrag "NodeMCU 1.0 (ESP-12E Module)" gewählt.

Installieren des Treibers für das OLED Display Das Display selber ist quasi nur onboard auf dem ESP8266 und ist daher nicht im Boardtreiber enthalten. Für dieses müssen wir wiederum einen eigenen Treiber installieren. Hier wechseln wir vom Boardverwalter zum Bibliotheksverwalter (1) und suchen nach "adafruit ssd1306" (2) auch diese habe ich bereits installiert und daher wird ebenso die Schaltfläche "REMOVE" (3) angezeigt. Auch hier solltest du wieder die Schaltfläche "INSTALL" sehen und wenn du diese installiert hast, kannst du mit der Programmierung beginnen.

Dur Bibliothek bekommst du zusätzlich noch ein paar Beispiele. Diese sind ohne Änderungen auf dem ESP8266 mit OLED Display von Heltec sofort lauffähig. Im nachfolgenden kleinen Video zeige ich dir eines der Beispiele, in welchem auf dem Display verschiedene Features dieser Bibliothek abgespielt werden. https://youtu.be/-sQB3NGeA-Q Installieren der Bibliothek für JSON Verarbeitung Wir erhalten von NewsApi.org einen JSON Response (Antwort) welche wir mit einer speziellen Bibliothek auswerten können. Das JSON-Datenformat ist im Internet sehr beliebt, da dieses sehr einfach aufgebaut und von Menschen sehr leicht zu lesen ist. Im Abschnitt zuvor hatte ich dir bereits erläutert, wie man eine Bibliothek installiert, hier sind die Schritte gleich, jedoch suchen wir hier lediglich nach "JSON" und wählen die "Arduino_JSON by Arduino" Bibliothek.

Wie du einen JSON mit dieser Bibliothek verarbeitest, habe ich dir bereits im Beitrag JSON-Format zur Datenübertragung zwischen zwei Mikrocontroller erläutert. Aufbau einer WiFi-Verbindung Damit wir die Daten aus dem Internet abrufen können, müssen wir zunächst eine WiFi-Verbindung aufbauen. Hier benötigen wir die SSID sowie das Passwort vom lokalen 2.4 GHz WLAN Netzwerk. #include #include #include //Zugangsdaten zum lokalen WiFi-Netzwerk const char* ssid = "*******"; const char* password = "*******"; void initWiFiConnection() { WiFi.begin(ssid, password); Serial.print("Aufbau der WiFi Verbindung zu "); Serial.println(ssid); //Solange die WiFi Verbindung nicht aufgebaut ist, //soll 500ms. gewartet und ein Punkt auf der seriellen Schnittstelle //ausgegeben werden. while (WiFi.status() != WL_CONNECTED) { delay(500); Serial.print("."); } Serial.println(""); Serial.println("Verbindung erfolgreich aufgebaut!"); Serial.print("IP-Adresse lautet: "); Serial.println(WiFi.localIP()); } Laden von Daten aus der NewsApi Nachdem wir nun die WiFi-Verbindung zum lokalen WLAN Netzwerk hergestellt haben, können wir jetzt die Daten aus der NewsApi auslesen. Dazu bauen wir uns zunächst einen String für die URL auf. //Der ApiKey welcher die Berechtigung zum laden der //Daten beinhaltet. String newsApiKey = "7274266d9bb543fcbcb4d0ce907605f3"; //Sprache der News String newsApiCountry = "de"; //Anzahl der News welche geladen werden sollen const int newsApiPageSize = 6; //Es kann gesucht werden oder nur die Top-Headlines geladen werden. //everything //top-headlines String newsApiEndpoint = "top-headlines"; //URL zum laden der Daten, hier wird per HTTP und nicht per HTTPS die //Daten abgerufen. String newsApiRequest = "http://newsapi.org/v2/" + newsApiEndpoint + "?" + "country=" + newsApiCountry + "&pageSize=" + newsApiPageSize + "&apiKey=" + newsApiKey; Absenden eines HTTP-Requests An den Server stellen wir nun die Anfrage mit der URL und erhalten mit http.GET() die Antwort, welche wir wiederum mit http.getString() auslesen können. Diese Antwort ist, wenn der Vorgang erfolgreich war, ein JSON. //Wenn keine WiFi-Verbindung existiert, dann eine aufbauen if ((WiFi.status() != WL_CONNECTED)) { initWiFiConnection(); } //Wenn eine aktive WiFi-Verbindung existiert, dann... if ((WiFi.status() == WL_CONNECTED)) { WiFiClient client; HTTPClient http; //Aufbau der Verbindung http.begin(client, newsApiRequest.c_str()); //abgsenden des Requests und laden der Daten //der HTTP-Code repräsentiert das Ergebnis des Prozesses //in Zahlenform, wobei HTTP-200 für OK steht. //(https://de.wikipedia.org/wiki/HTTP-Statuscode) httpCode = http.GET(); //Laden der Daten httpResponse = http.getString(); //Beenden der Kommunikation http.end(); } Auswerten des JSON-Response Wenn die Antwort HTTP-200 also OK ist dann werten wir diese aus und laden aus dem JSON die Titel der News Artikel. Da die Titel Umlaute & Symbole enthalten, welche nicht auf dem OLED Display angezeigt werden können, müssen wir diese zunächst durch andere ersetzen. Die Titel werden dann in einem Array gespeichert und im nächsten Schritt dann auf dem Display angezeigt. #include //Array zur Ablage der gelesenen News String news = { "" }; void loop(){ .... //Wenn eine Antwort erhalten wurde, dann... if (httpCode == 200) { handleResponse(httpResponse); } } //Ersetzt im Text Symbole welche nicht auf dem //OLED Display angezeigt werden können. String replaceSymbols(String text) { String result = text; result.replace("ä", "ae"); result.replace("Ä", "Ae"); result.replace("ö", "oe"); result.replace("Ö", "Oe"); result.replace("ü", "ue"); result.replace("Ü", "Ue"); result.replace("ß", "ss"); result.replace(""", "'"); result.replace("„", "'"); result.replace("“", "'"); result.replace("–", "-"); return result; } //Verarbeitet die Antwort vom Server //Die Antwort ist ein JSON String, dieser muss geparst und aus dem Ergebnis //die Titel der Artikel geladen werden. //Die Titel werden in dem Array news abgelegt. void handleResponse(String httpResponse) { //Parsen des JSON-Response JSONVar jsonVar = JSON.parse(httpResponse); //Schleife über die mögliche anzahl der geladenen Artikel for (int i = 0; i Read the full article
0 notes