#kubernetes namespace
Explore tagged Tumblr posts
Visit Tumblr Blog
Explore Tumblr blogs with no restrictions, modern design and the best experience.
Last Seen Tumblr Blogs


Fun Fact
69% of Tumblr users are millennials.

Video
youtube
Session 8 Namespaces in Kubernetes
#youtube#In this informative video we dive deep into the world of Namespaces in Kubernetes! 🚀 Kubernetes is a powerful container orchestration platf
0 notes
Text
What is Argo CD? And When Was Argo CD Established?

What Is Argo CD?
Argo CD is declarative Kubernetes GitOps continuous delivery.
In DevOps, ArgoCD is a Continuous Delivery (CD) technology that has become well-liked for delivering applications to Kubernetes. It is based on the GitOps deployment methodology.
When was Argo CD Established?
Argo CD was created at Intuit and made publicly available following Applatix’s 2018 acquisition by Intuit. The founding developers of Applatix, Hong Wang, Jesse Suen, and Alexander Matyushentsev, made the Argo project open-source in 2017.
Why Argo CD?
Declarative and version-controlled application definitions, configurations, and environments are ideal. Automated, auditable, and easily comprehensible application deployment and lifecycle management are essential.
Getting Started
Quick Start
kubectl create namespace argocd kubectl apply -n argocd -f https://raw.githubusercontent.com/argoproj/argo-cd/stable/manifests/install.yaml
For some features, more user-friendly documentation is offered. Refer to the upgrade guide if you want to upgrade your Argo CD. Those interested in creating third-party connectors can access developer-oriented resources.
How it works
Argo CD defines the intended application state by employing Git repositories as the source of truth, in accordance with the GitOps pattern. There are various approaches to specify Kubernetes manifests:
Applications for Customization
Helm charts
JSONNET files
Simple YAML/JSON manifest directory
Any custom configuration management tool that is set up as a plugin
The deployment of the intended application states in the designated target settings is automated by Argo CD. Deployments of applications can monitor changes to branches, tags, or pinned to a particular manifest version at a Git commit.
Architecture
The implementation of Argo CD is a Kubernetes controller that continually observes active apps and contrasts their present, live state with the target state (as defined in the Git repository). Out Of Sync is the term used to describe a deployed application whose live state differs from the target state. In addition to reporting and visualizing the differences, Argo CD offers the ability to manually or automatically sync the current state back to the intended goal state. The designated target environments can automatically apply and reflect any changes made to the intended target state in the Git repository.
Components
API Server
The Web UI, CLI, and CI/CD systems use the API, which is exposed by the gRPC/REST server. Its duties include the following:
Status reporting and application management
Launching application functions (such as rollback, sync, and user-defined actions)
Cluster credential management and repository (k8s secrets)
RBAC enforcement
Authentication, and auth delegation to outside identity providers
Git webhook event listener/forwarder
Repository Server
An internal service called the repository server keeps a local cache of the Git repository containing the application manifests. When given the following inputs, it is in charge of creating and returning the Kubernetes manifests:
URL of the repository
Revision (tag, branch, commit)
Path of the application
Template-specific configurations: helm values.yaml, parameters
A Kubernetes controller known as the application controller keeps an eye on all active apps and contrasts their actual, live state with the intended target state as defined in the repository. When it identifies an Out Of Sync application state, it may take remedial action. It is in charge of calling any user-specified hooks for lifecycle events (Sync, PostSync, and PreSync).
Features
Applications are automatically deployed to designated target environments.
Multiple configuration management/templating tools (Kustomize, Helm, Jsonnet, and plain-YAML) are supported.
Capacity to oversee and implement across several clusters
Integration of SSO (OIDC, OAuth2, LDAP, SAML 2.0, Microsoft, LinkedIn, GitHub, GitLab)
RBAC and multi-tenancy authorization policies
Rollback/Roll-anywhere to any Git repository-committed application configuration
Analysis of the application resources’ health state
Automated visualization and detection of configuration drift
Applications can be synced manually or automatically to their desired state.
Web user interface that shows program activity in real time
CLI for CI integration and automation
Integration of webhooks (GitHub, BitBucket, GitLab)
Tokens of access for automation
Hooks for PreSync, Sync, and PostSync to facilitate intricate application rollouts (such as canary and blue/green upgrades)
Application event and API call audit trails
Prometheus measurements
To override helm parameters in Git, use parameter overrides.
Read more on Govindhtech.com
#ArgoCD#CD#GitOps#API#Kubernetes#Git#Argoproject#News#Technews#Technology#Technologynews#Technologytrends#govindhtech
2 notes
·
View notes
Text
Kubernetes Tutorials | Waytoeasylearn
Learn how to become a Certified Kubernetes Administrator (CKA) with this all-in-one Kubernetes course. It is suitable for complete beginners as well as experienced DevOps engineers. This practical, hands-on class will teach you how to understand Kubernetes architecture, deploy and manage applications, scale services, troubleshoot issues, and perform admin tasks. It covers everything you need to confidently pass the CKA exam and run containerized apps in production.
Learn Kubernetes the easy way! 🚀 Best tutorials at Waytoeasylearn for mastering Kubernetes and cloud computing efficiently.➡️ Learn Now

Whether you are studying for the CKA exam or want to become a Kubernetes expert, this course offers step-by-step lessons, real-life examples, and labs focused on exam topics. You will learn from Kubernetes professionals and gain skills that employers are looking for.
Key Learning Outcomes: Understand Kubernetes architecture, components, and key ideas. Deploy, scale, and manage containerized apps on Kubernetes clusters. Learn to use kubectl, YAML files, and troubleshoot clusters. Get familiar with pods, services, deployments, volumes, namespaces, and RBAC. Set up and run production-ready Kubernetes clusters using kubeadm. Explore advanced topics like rolling updates, autoscaling, and networking. Build confidence with real-world labs and practice exams. Prepare for the CKA exam with helpful tips, checklists, and practice scenarios.
Who Should Take This Course: Aspiring CKA candidates. DevOps engineers, cloud engineers, and system admins. Software developers moving into cloud-native work. Anyone who wants to master Kubernetes for real jobs.
1 note
·
View note
Text
Mastering OpenShift at Scale: Red Hat OpenShift Administration III (DO380)
In today’s cloud-native world, organizations are increasingly adopting Kubernetes and Red Hat OpenShift to power their modern applications. As these environments scale, so do the challenges of managing complex workloads, automating operations, and ensuring reliability. That’s where Red Hat OpenShift Administration III: Scaling Kubernetes Workloads (DO380) steps in.
What is DO380?
DO380 is an advanced-level training course offered by Red Hat that focuses on scaling, performance tuning, and managing containerized applications in production using Red Hat OpenShift Container Platform. It is designed for experienced OpenShift administrators and DevOps professionals who want to deepen their knowledge of Kubernetes-based platform operations.
Who Should Take DO380?
This course is ideal for:
✅ System Administrators managing large-scale containerized environments
✅ DevOps Engineers working with CI/CD pipelines and automation
✅ Platform Engineers responsible for OpenShift clusters
✅ RHCEs or OpenShift Certified Administrators (EX280 holders) aiming to level up
Key Skills You Will Learn
Here’s what you’ll master in DO380:
🔧 Advanced Cluster Management
Configure and manage OpenShift clusters for performance and scalability.
📈 Monitoring & Tuning
Use tools like Prometheus, Grafana, and the OpenShift Console to monitor system health, tune workloads, and troubleshoot performance issues.
📦 Autoscaling & Load Management
Configure Horizontal Pod Autoscaling (HPA), Cluster Autoscaler, and manage workloads efficiently with resource quotas and limits.
🔐 Security & Compliance
Implement security policies, use node taints/tolerations, and manage namespaces for better isolation and governance.
🧪 CI/CD Pipeline Integration
Automate application delivery using Tekton pipelines and manage GitOps workflows with ArgoCD.
Course Prerequisites
Before enrolling in DO380, you should be familiar with:
Red Hat OpenShift Administration I (DO180)
Red Hat OpenShift Administration II (DO280)
Kubernetes fundamentals (kubectl, deployments, pods, services)
Certification Path
DO380 also helps you prepare for the Red Hat Certified Specialist in OpenShift Scaling and Performance (EX380) exam, which counts towards the Red Hat Certified Architect (RHCA) credential.
Why DO380 Matters
With enterprise workloads becoming more dynamic and resource-intensive, scaling OpenShift effectively is not just a bonus �� it’s a necessity. DO380 equips you with the skills to:
✅ Maximize infrastructure efficiency
✅ Ensure high availability
✅ Automate operations
✅ Improve DevOps productivity
Conclusion
Whether you're looking to enhance your career, improve your organization's cloud-native capabilities, or take the next step in your Red Hat certification journey — Red Hat OpenShift Administration III (DO380) is your gateway to mastering OpenShift at scale.
Ready to elevate your OpenShift expertise?
Explore DO380 training options with HawkStack Technologies and get hands-on with real-world OpenShift scaling scenarios.
For more details www.hawkstack.com
0 notes
Text
Kubernetes Cluster Management at Scale: Challenges and Solutions
As Kubernetes has become the cornerstone of modern cloud-native infrastructure, managing it at scale is a growing challenge for enterprises. While Kubernetes excels in orchestrating containers efficiently, managing multiple clusters across teams, environments, and regions presents a new level of operational complexity.
In this blog, we’ll explore the key challenges of Kubernetes cluster management at scale and offer actionable solutions, tools, and best practices to help engineering teams build scalable, secure, and maintainable Kubernetes environments.
Why Scaling Kubernetes Is Challenging
Kubernetes is designed for scalability—but only when implemented with foresight. As organizations expand from a single cluster to dozens or even hundreds, they encounter several operational hurdles.
Key Challenges:
1. Operational Overhead
Maintaining multiple clusters means managing upgrades, backups, security patches, and resource optimization—multiplied by every environment (dev, staging, prod). Without centralized tooling, this overhead can spiral quickly.
2. Configuration Drift
Cluster configurations often diverge over time, causing inconsistent behavior, deployment errors, or compliance risks. Manual updates make it difficult to maintain consistency.
3. Observability and Monitoring
Standard logging and monitoring solutions often fail to scale with the ephemeral and dynamic nature of containers. Observability becomes noisy and fragmented without standardization.
4. Resource Isolation and Multi-Tenancy
Balancing shared infrastructure with security and performance for different teams or business units is tricky. Kubernetes namespaces alone may not provide sufficient isolation.
5. Security and Policy Enforcement
Enforcing consistent RBAC policies, network segmentation, and compliance rules across multiple clusters can lead to blind spots and misconfigurations.
Best Practices and Scalable Solutions
To manage Kubernetes at scale effectively, enterprises need a layered, automation-driven strategy. Here are the key components:
1. GitOps for Declarative Infrastructure Management
GitOps leverages Git as the source of truth for infrastructure and application deployment. With tools like ArgoCD or Flux, you can:
Apply consistent configurations across clusters.
Automatically detect and rollback configuration drifts.
Audit all changes through Git commit history.
Benefits:
· Immutable infrastructure
· Easier rollbacks
· Team collaboration and visibility
2. Centralized Cluster Management Platforms
Use centralized control planes to manage the lifecycle of multiple clusters. Popular tools include:
Rancher – Simplified Kubernetes management with RBAC and policy controls.
Red Hat OpenShift – Enterprise-grade PaaS built on Kubernetes.
VMware Tanzu Mission Control – Unified policy and lifecycle management.
Google Anthos / Azure Arc / Amazon EKS Anywhere – Cloud-native solutions with hybrid/multi-cloud support.
Benefits:
· Unified view of all clusters
· Role-based access control (RBAC)
· Policy enforcement at scale
3. Standardization with Helm, Kustomize, and CRDs
Avoid bespoke configurations per cluster. Use templating and overlays:
Helm: Define and deploy repeatable Kubernetes manifests.
Kustomize: Customize raw YAMLs without forking.
Custom Resource Definitions (CRDs): Extend Kubernetes API to include enterprise-specific configurations.
Pro Tip: Store and manage these configurations in Git repositories following GitOps practices.
4. Scalable Observability Stack
Deploy a centralized observability solution to maintain visibility across environments.
Prometheus + Thanos: For multi-cluster metrics aggregation.
Grafana: For dashboards and alerting.
Loki or ELK Stack: For log aggregation.
Jaeger or OpenTelemetry: For tracing and performance monitoring.
Benefits:
· Cluster health transparency
· Proactive issue detection
· Developer fliendly insights
5. Policy-as-Code and Security Automation
Enforce security and compliance policies consistently:
OPA + Gatekeeper: Define and enforce security policies (e.g., restrict container images, enforce labels).
Kyverno: Kubernetes-native policy engine for validation and mutation.
Falco: Real-time runtime security monitoring.
Kube-bench: Run CIS Kubernetes benchmark checks automatically.
Security Tip: Regularly scan cluster and workloads using tools like Trivy, Kube-hunter, or Aqua Security.
6. Autoscaling and Cost Optimization
To avoid resource wastage or service degradation:
Horizontal Pod Autoscaler (HPA) – Auto-scales pods based on metrics.
Vertical Pod Autoscaler (VPA) – Adjusts container resources.
Cluster Autoscaler – Scales nodes up/down based on workload.
Karpenter (AWS) – Next-gen open-source autoscaler with rapid provisioning.
Conclusion
As Kubernetes adoption matures, organizations must rethink their management strategy to accommodate growth, reliability, and governance. The transition from a handful of clusters to enterprise-wide Kubernetes infrastructure requires automation, observability, and strong policy enforcement.
By adopting GitOps, centralized control planes, standardized templates, and automated policy tools, enterprises can achieve Kubernetes cluster management at scale—without compromising on security, reliability, or developer velocity.
0 notes
Text
Why GPU PaaS Is Incomplete Without Infrastructure Orchestration and Tenant Isolation
GPU Platform-as-a-Service (PaaS) is gaining popularity as a way to simplify AI workload execution — offering users a friendly interface to submit training, fine-tuning, and inferencing jobs. But under the hood, many GPU PaaS solutions lack deep integration with infrastructure orchestration, making them inadequate for secure, scalable multi-tenancy.
If you’re a Neocloud, sovereign GPU cloud, or an enterprise private GPU cloud with strict compliance requirements, you are probably looking at offering job scheduling of Model-as-a-Service to your tenants/users. An easy approach is to have a global Kubernetes cluster that is shared across multiple tenants. The problem with this approach is poor security as the underlying OS kernel, CPU, GPU, network, and storage resources are shared by all users without any isolation. Case-in-point, in September 2024, Wiz discovered a critical GPU container and Kubernetes vulnerability that affected over 35% of environments. Thus, doing just Kubernetes namespace or vCluster isolation is not safe.
You need to provision bare metal, configure network and fabric isolation, allocate high-performance storage, and enforce tenant-level security boundaries — all automated, dynamic, and policy-driven.
In short: PaaS is not enough. True GPUaaS begins with infrastructure orchestration.
The Pitfall of PaaS-Only GPU Platforms
Many AI platforms stop at providing:
A web UI for job submission
A catalog of AI/ML frameworks or models
Basic GPU scheduling on Kubernetes
What they don’t offer:
Control over how GPU nodes are provisioned (bare metal vs. VM)
Enforcement of north-south and east-west isolation per tenant
Configuration and Management of Infiniband, RoCE or Spectrum-X fabric
Lifecycle Management and Isolation of External Parallel Storage like DDN, VAST, or WEKA
Per-Tenant Quota, Observability, RBAC, and Policy Governance
Without these, your GPU PaaS is just a thin UI on top of a complex, insecure, and hard-to-scale backend.
What Full-Stack Orchestration Looks Like
To build a robust AI cloud platform — whether sovereign, Neocloud, or enterprise — the orchestration layer must go deeper.
How aarna.ml GPU CMS Solves This Problem
aarna.ml GPU CMS is built from the ground up to be infrastructure-aware and multi-tenant-native. It includes all the PaaS features you would expect, but goes beyond PaaS to offer:
BMaaS and VMaaS orchestration: Automated provisioning of GPU bare metal or VM pools for different tenants.
Tenant-level network isolation: Support for VXLAN, VRF, and fabric segmentation across Infiniband, Ethernet, and Spectrum-X.
Storage orchestration: Seamless integration with DDN, VAST, WEKA with mount point creation and tenant quota enforcement.
Full-stack observability: Usage stats, logs, and billing metrics per tenant, per GPU, per model.
All of this is wrapped with a PaaS layer that supports Ray, SLURM, KAI, Run:AI, and more, giving users flexibility while keeping cloud providers in control of their infrastructure and policies.
Why This Matters for AI Cloud Providers
If you're offering GPUaaS or PaaS without infrastructure orchestration:
You're exposing tenants to noisy neighbors or shared vulnerabilities
You're missing critical capabilities like multi-region scaling or LLM isolation
You’ll be unable to meet compliance, governance, and SemiAnalysis ClusterMax1 grade maturity
With aarna.ml GPU CMS, you deliver not just a PaaS, but a complete, secure, and sovereign-ready GPU cloud platform.
Conclusion
GPU PaaS needs to be a complete stack with IaaS — it’s not just a model serving interface!
To deliver scalable, secure, multi-tenant AI services, your GPU PaaS stack must be expanded to a full GPU cloud management software stack to include automated provisioning of compute, network, and storage, along with tenant-aware policy and observability controls.
Only then is your GPU PaaS truly production-grade.
Only then are you ready for sovereign, enterprise, and commercial AI cloud success.
To see a live demo or for a free trial, contact aarna.ml
This post orginally posted on https://www.aarna.ml/
0 notes
Text
Enable User Namespaces in Kubernetes
This guide walks you through enabling user namespaces in Kubernetes, allowing containers to run as root inside the pod while being mapped to a non-root user on the host. This enhances isolation and security, and makes it possible to allow users more freedom—without the usual risk. Tested with: Ubuntu 24.04 Kubeadm 1.32.3 CRI-O 1.32 Calico 3.29.3 For full reference, see the official Kubernetes…
0 notes
Text
Kubernetes Objects Explained 💡 Pods, Services, Deployments & More for Admins & Devs
learn how Kubernetes keeps your apps running as expected using concepts like desired state, replication, config management, and persistent storage.
✔️ Pod – Basic unit that runs your containers ✔️ Service – Stable network access to Pods ✔️ Deployment – Rolling updates & scaling made easy ✔️ ReplicaSet – Maintains desired number of Pods ✔️ Job & CronJob – Run tasks once or on schedule ✔️ ConfigMap & Secret – Externalize configs & secure credentials ✔️ PV & PVC – Persistent storage management ✔️ Namespace – Cluster-level resource isolation ✔️ DaemonSet – Run a Pod on every node ✔️ StatefulSet – For stateful apps like databases ✔️ ReplicationController – The older way to manage Pods
youtube
0 notes
Text
Learn HashiCorp Vault in Kubernetes Using KubeVault

In today's cloud-native world, securing secrets, credentials, and sensitive configurations is more important than ever. That’s where Vault in Kubernetes becomes a game-changer — especially when combined with KubeVault, a powerful operator for managing HashiCorp Vault within Kubernetes clusters.
🔐 What is Vault in Kubernetes?
Vault in Kubernetes refers to the integration of HashiCorp Vault with Kubernetes to manage secrets dynamically, securely, and at scale. Vault provides features like secrets storage, access control, dynamic secrets, and secrets rotation — essential tools for modern DevOps and cloud security.
🚀 Why Use KubeVault?
KubeVault is an open-source Kubernetes operator developed to simplify Vault deployment and management inside Kubernetes environments. Whether you’re new to Vault or running production workloads, KubeVault automates:
Deployment and lifecycle management of Vault
Auto-unsealing using cloud KMS providers
Seamless integration with Kubernetes RBAC and CRDs
Secure injection of secrets into workloads
🛠️ Getting Started with KubeVault
Here's a high-level guide on how to deploy Vault in Kubernetes using KubeVault:
Install the KubeVault Operator Use Helm or YAML manifests to install the operator in your cluster. helm repo add appscode https://charts.appscode.com/stable/
helm install kubevault-operator appscode/kubevault --namespace kubevault --create-namespace
Deploy a Vault Server Define a custom resource (VaultServer) to spin up a Vault instance.
Configure Storage and Unsealer Use backends like GCS, S3, or Azure Blob for Vault storage and unseal via cloud KMS.
Inject Secrets into Workloads Automatically mount secrets into pods using Kubernetes-native integrations.
💡 Benefits of Using Vault in Kubernetes with KubeVault
✅ Automated Vault lifecycle management
✅ Native Kubernetes authentication
✅ Secret rotation without downtime
✅ Easy policy management via CRDs
✅ Enterprise-level security with minimal overhead
🔄 Real Use Case: Dynamic Secrets for Databases
Imagine your app requires database credentials. Instead of hardcoding secrets or storing them in plain YAML files, you can use KubeVault to dynamically generate and inject secrets directly into pods — with rotation and revocation handled automatically.
🌐 Final Thoughts
If you're deploying applications in Kubernetes, integrating Vault in Kubernetes using KubeVault isn't just a best practice — it's a security necessity. KubeVault makes it easy to run Vault at scale, without the hassle of manual configuration and operations.
Want to learn more? Check out KubeVault.com — the ultimate toolkit for managing secrets in Kubernetes using HashiCorp Vault.
1 note
·
View note
Text
IngressNightmare: Vulnerabilidades Críticas de Ejecución Remota de Código en Ingress NGINX
El equipo de Wiz Research descubrió una serie de vulnerabilidades críticas en el Ingress NGINX Controller para Kubernetes, denominadas #IngressNightmare (CVE-2025-1097, CVE-2025-1098, CVE-2025-24514 y CVE-2025-1974). Estas fallas permiten a un atacante ejecutar código de forma remota (RCE) sin autenticación, acceder a secretos almacenados en todos los namespaces del clúster y potencialmente tomar…
0 notes
Text
Monitoring Kubernetes Clusters with Prometheus and Grafana
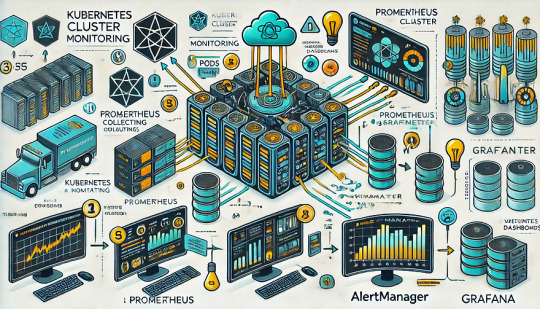
Introduction
Kubernetes is a powerful container orchestration platform, but monitoring it is crucial for ensuring reliability, performance, and scalability.
Prometheus and Grafana are two of the most popular open-source tools for monitoring and visualizing Kubernetes clusters.
In this guide, we’ll walk you through setting up Prometheus and Grafana on Kubernetes and configuring dashboards for real-time insights.
Why Use Prometheus and Grafana for Kubernetes Monitoring?
Prometheus: The Monitoring Backbone
Collects metrics from Kubernetes nodes, pods, and applications.
Uses a powerful query language (PromQL) for analyzing data.
Supports alerting based on predefined conditions.
Grafana: The Visualization Tool
Provides rich dashboards with graphs and metrics.
Allows integration with multiple data sources (e.g., Prometheus, Loki, Elasticsearch).
Enables alerting and notification management.
Step 1: Installing Prometheus and Grafana on Kubernetes
Prerequisites
Before starting, ensure you have:
A running Kubernetes cluster
kubectl and Helm installed
1. Add the Prometheus Helm Chart Repository
Helm makes it easy to deploy Prometheus and Grafana using predefined configurations.shhelm repo add prometheus-community https://prometheus-community.github.io/helm-charts helm repo update
2. Install Prometheus and Grafana Using Helm
shhelm install prometheus prometheus-community/kube-prometheus-stack --namespace monitoring --create-namespace
This command installs: ✅ Prometheus — For collecting metrics ✅ Grafana — For visualization ✅ Alertmanager — For notifications ✅ Node-exporter — To collect system-level metrics
Step 2: Accessing Prometheus and Grafana
Once deployed, we need to access the Prometheus and Grafana web interfaces.
1. Accessing Prometheus
Check the Prometheus service:shkubectl get svc -n monitoring
Forward the Prometheus server port:shkubectl port-forward svc/prometheus-kube-prometheus-prometheus 9090 -n monitoring
Now, open http://localhost:9090 in your browser.
2. Accessing Grafana
Retrieve the Grafana admin password:shkubectl get secret --namespace monitoring prometheus-grafana -o jsonpath="{.data.admin-password}" | base64 --decodeForward the Grafana service port:shkubectl port-forward svc/prometheus-grafana 3000:80 -n monitoring
Open http://localhost:3000, and log in with:
Username: admin
Password: (obtained from the previous command)
Step 3: Configuring Prometheus as a Data Source in Grafana
Open Grafana and navigate to Configuration > Data Sources.
Click Add data source and select Prometheus.
Set the URL to:
sh
http://prometheus-kube-prometheus-prometheus.monitoring.svc.cluster.local:9090
Click Save & Test to verify the connection.
Step 4: Importing Kubernetes Dashboards into Grafana
Grafana provides ready-made dashboards for Kubernetes monitoring.
Go to Dashboards > Import.
Enter a dashboard ID from Grafana’s dashboard repository.
Example: Use 3119 for Kubernetes cluster monitoring.
Select Prometheus as the data source and click Import.
You’ll now have a real-time Kubernetes monitoring dashboard! 🎯
Step 5: Setting Up Alerts in Prometheus and Grafana
Creating Prometheus Alerting Rules
Create a ConfigMap for alerts:yamlapiVersion: v1 kind: ConfigMap metadata: name: alert-rules namespace: monitoring data: alert.rules: | groups: - name: InstanceDown rules: - alert: InstanceDown expr: up == 0 for: 5m labels: severity: critical annotations: summary: "Instance {{ $labels.instance }} is down"
Apply it to the cluster:shkubectl apply -f alert-rules.yaml
Configuring Grafana Alerts
Navigate to Alerting > Notification Channels.
Set up a channel (Email, Slack, or PagerDuty).
Define alert rules based on metrics from Prometheus.
Step 6: Enabling Persistent Storage for Prometheus
By default, Prometheus stores data in memory. To make the data persistent, configure storage:
Modify the Helm values:yamlprometheus: server: persistentVolume: enabled: true size: 10Gi
Apply the changes:shhelm upgrade prometheus prometheus-community/kube-prometheus-stack -f values.yaml
Conclusion
In this guide, we’ve set up Prometheus and Grafana to monitor a Kubernetes cluster. You now have: ✅ Real-time dashboards in Grafana ✅ Prometheus alerts to detect failures ✅ Persistent storage for historical metrics
WEBSITE: https://www.ficusoft.in/devops-training-in-chennai/
0 notes
Text
The role of machine learning in enhancing cloud-native container security - AI News
New Post has been published on https://thedigitalinsider.com/the-role-of-machine-learning-in-enhancing-cloud-native-container-security-ai-news/
The role of machine learning in enhancing cloud-native container security - AI News

The advent of more powerful processors in the early 2000’s shipping with support in hardware for virtualisation started the computing revolution that led, in time, to what we now call the cloud. With single hardware instances able to run dozens, if not hundreds of virtual machines concurrently, businesses could offer their users multiple services and applications that would otherwise have been financially impractical, if not impossible.
But virtual machines (VMs) have several downsides. Often, an entire virtualised operating system is overkill for many applications, and although very much more malleable, scalable, and agile than a fleet of bare-metal servers, VMs still require significantly more memory and processing power, and are less agile than the next evolution of this type of technology – containers. In addition to being more easily scaled (up or down, according to demand), containerised applications consist of only the necessary parts of an application and its supporting dependencies. Therefore apps based on micro-services tend to be lighter and more easily configurable.
Virtual machines exhibit the same security issues that affect their bare-metal counterparts, and to some extent, container security issues reflect those of their component parts: a mySQL bug in a specific version of the upstream application will affect containerised versions too. With regards to VMs, bare metal installs, and containers, cybersecurity concerns and activities are very similar. But container deployments and their tooling bring specific security challenges to those charged with running apps and services, whether manually piecing together applications with choice containers, or running in production with orchestration at scale.
Container-specific security risks
Misconfiguration: Complex applications are made up of multiple containers, and misconfiguration – often only a single line in a .yaml file, can grant unnecessary privileges and increase the attack surface. For example, although it’s not trivial for an attacker to gain root access to the host machine from a container, it’s still a too-common practice to run Docker as root, with no user namespace remapping, for example.
Vulnerable container images: In 2022, Sysdig found over 1,600 images identified as malicious in Docker Hub, in addition to many containers stored in the repo with hard-coded cloud credentials, ssh keys, and NPM tokens. The process of pulling images from public registries is opaque, and the convenience of container deployment (plus pressure on developers to produce results, fast) can mean that apps can easily be constructed with inherently insecure, or even malicious components.
Orchestration layers: For larger projects, orchestration tools such as Kubernetes can increase the attack surface, usually due to misconfiguration and high levels of complexity. A 2022 survey from D2iQ found that only 42% of applications running on Kubernetes made it into production – down in part to the difficulty of administering large clusters and a steep learning curve.
According to Ari Weil at Akamai, “Kubernetes is mature, but most companies and developers don’t realise how complex […] it can be until they’re actually at scale.”
Container security with machine learning
The specific challenges of container security can be addressed using machine learning algorithms trained on observing the components of an application when it’s ‘running clean.’ By creating a baseline of normal behaviour, machine learning can identify anomalies that could indicate potential threats from unusual traffic, unauthorised changes to configuration, odd user access patterns, and unexpected system calls.
ML-based container security platforms can scan image repositories and compare each against databases of known vulnerabilities and issues. Scans can be automatically triggered and scheduled, helping prevent the addition of harmful elements during development and in production. Auto-generated audit reports can be tracked against standard benchmarks, or an organisation can set its own security standards – useful in environments where highly-sensitive data is processed.
The connectivity between specialist container security functions and orchestration software means that suspected containers can be isolated or closed immediately, insecure permissions revoked, and user access suspended. With API connections to local firewalls and VPN endpoints, entire environments or subnets can be isolated, or traffic stopped at network borders.
Final word
Machine learning can reduce the risk of data breach in containerised environments by working on several levels. Anomaly detection, asset scanning, and flagging potential misconfiguration are all possible, plus any degree of automated alerting or amelioration are relatively simple to enact.
The transformative possibilities of container-based apps can be approached without the security issues that have stopped some from exploring, developing, and running microservice-based applications. The advantages of cloud-native technologies can be won without compromising existing security standards, even in high-risk sectors.
(Image source)
#2022#agile#ai#ai news#akamai#Algorithms#anomalies#anomaly#anomaly detection#API#applications#apps#Attack surface#audit#benchmarks#breach#bug#Cloud#Cloud-Native#clusters#Companies#complexity#computing#connectivity#container#container deployment#Containers#credentials#cybersecurity#data
0 notes
Text
Networking in OpenShift Virtualization: A Deep Dive
OpenShift Virtualization is a powerful extension of Red Hat OpenShift that enables you to run and manage virtual machines (VMs) alongside containerized workloads. Networking plays a crucial role in OpenShift Virtualization, ensuring seamless communication between VMs, containers, and external systems. In this blog, we will explore the core components and configurations that make networking in OpenShift Virtualization robust and flexible.
Key Networking Components
Multus CNI (Container Network Interface):
OpenShift Virtualization leverages Multus CNI to enable multiple network interfaces per pod or VM.
This allows VMs to connect to different networks, such as internal pod networks and external VLANs.
KubeVirt:
Acts as the core virtualization engine, providing networking capabilities for VMs.
Integrates with OpenShift’s SDN (Software-Defined Networking) to offer seamless communication.
OVN-Kubernetes:
The default SDN in OpenShift that provides Layer 2 and Layer 3 networking.
Ensures high performance and scalability for both VMs and containers.
Networking Models in OpenShift Virtualization
OpenShift Virtualization offers several networking models tailored to different use cases:
Pod Networking:
VMs use the same network as Kubernetes pods.
Simplifies communication between VMs and containerized workloads.
For example, a VM hosting a database can easily connect to application pods within the same namespace.
Bridge Networking:
Provides direct access to the host network.
Ideal for workloads requiring low latency or specialized networking protocols.
SR-IOV (Single Root I/O Virtualization):
Enables direct access to physical NICs (Network Interface Cards) for high-performance applications.
Suitable for workloads like real-time analytics or financial applications that demand low latency and high throughput.
MACVLAN Networking:
Assigns a unique MAC address to each VM for direct communication with external networks.
Simplifies integration with legacy systems.
Network Configuration Workflow
Define Network Attachments:
Create additional network attachments to connect VMs to different networks.
Attach Networks to VMs:
Add network interfaces to VMs to enable multi-network communication.
Configure Network Policies:
Set up rules to control traffic flow between VMs, pods, and external systems.
Best Practices
Plan Your Network Topology:
Understand your workload requirements and choose the appropriate networking model.
Use SR-IOV for high-performance workloads and Pod Networking for general-purpose workloads.
Secure Your Networks:
Implement Network Policies to restrict traffic based on namespaces, labels, or CIDR blocks.
Enable encryption for sensitive communications.
Monitor and Troubleshoot:
Use tools like OpenShift Console and kubectl for monitoring and debugging.
Analyze logs and metrics to ensure optimal performance.
Leverage Automation:
Automate network configuration and deployments using infrastructure-as-code tools.
Conclusion
Networking in OpenShift Virtualization is a sophisticated and flexible system that ensures seamless integration of VMs and containers. By leveraging its diverse networking models and following best practices, you can build a robust and secure environment for your workloads. Whether you are modernizing legacy applications or scaling cloud-native workloads, OpenShift Virtualization has the tools to meet your networking needs.
For more information visit: https://www.hawkstack.com/
0 notes
Text
Kubernetes Security Essentials: Safeguarding Your Cluster
As Kubernetes continues to be the go-to platform for container orchestration, securing your Kubernetes environment has become paramount. A compromised cluster can lead to data breaches, application downtime, or even misuse of your infrastructure for malicious purposes. Here, we explore essential Kubernetes security practices to help you safeguard your cluster effectively.
1. Implement Role-Based Access Control (RBAC)
RBAC is a critical feature of Kubernetes that ensures users and applications have access only to the resources they need. By defining roles and binding them to specific users or service accounts, you minimize the risk of privilege escalation.
Tip: Regularly audit your RBAC policies and avoid granting overly permissive roles like cluster-admin.
2. Secure the API Server
The Kubernetes API server is the control plane for your cluster. Unauthorized access to the API server can compromise the entire cluster.
Key Actions:
Enable HTTPS for API server communication.
Use authentication mechanisms like certificates, tokens, or OpenID Connect.
Restrict access using IP whitelisting or network policies.
3. Use Network Policies
Network policies help you control communication between pods and external systems. This limits the blast radius in case of a breach.
Steps to Follow:
Define network policies to allow only necessary traffic between pods.
Isolate sensitive workloads using namespaces and policy rules.
4. Regularly Scan Images for Vulnerabilities
Container images are often the entry point for vulnerabilities. Ensure that your images are secure by:
Using trusted image registries.
Scanning images with tools like Trivy, Aqua Security, or Anchore.
Keeping images up-to-date with the latest patches.
5. Encrypt Secrets and Data at Rest
Kubernetes stores sensitive data, such as secrets and configurations, which should be encrypted to prevent unauthorized access.
Best Practices:
Use tools like Kubernetes Secrets Encryption.
Integrate with external secret management systems such as HashiCorp Vault or AWS Secrets Manager.
6. Monitor and Audit Your Cluster
Continuous monitoring is essential for detecting anomalies and unauthorized activities in real time.
Use tools like Prometheus, Grafana, and Kubernetes Audit Logs.
Set up alerts for unusual activity, such as unexpected pod creation or high resource usage.
7. Apply Pod Security Standards
Pod security policies enforce security controls at the pod level, ensuring compliance with best practices.
Disable privileged containers unless absolutely necessary.
Limit container capabilities and set appropriate seccomp profiles.
Enforce read-only root filesystems wherever possible.
Conclusion
Securing your Kubernetes environment is not a one-time task but an ongoing process. By adhering to these Kubernetes security essentials, you can ensure your cluster remains resilient against emerging threats. Make security an integral part of your DevOps workflow to protect your applications, data, and reputation.
For more details click www.hawkstack.com
#redhatcourses#information technology#containerorchestration#kubernetes#container#linux#docker#containersecurity#qcsdclabs#hawkstack#hawkstack technologies
0 notes
Text
Migrating Virtual Machines to Red Hat OpenShift Virtualization with Ansible Automation Platform
As enterprises modernize their IT infrastructure, migrating legacy virtual machines (VMs) into container-native platforms has become a strategic priority. Red Hat OpenShift Virtualization provides a powerful solution by enabling organizations to run traditional VMs alongside container workloads on a single, Kubernetes-native platform. When paired with Red Hat Ansible Automation Platform, the migration process becomes more consistent, scalable, and fully automated.
In this article, we explore how Ansible Automation Platform can be leveraged to simplify and accelerate the migration of VMs to OpenShift Virtualization.
Why Migrate to OpenShift Virtualization?
OpenShift Virtualization allows organizations to:
Consolidate VMs and containers on a single platform.
Simplify operations through unified management.
Enable DevOps teams to interact with VMs using Kubernetes-native tools.
Improve resource utilization and reduce infrastructure sprawl.
This hybrid approach is ideal for enterprises that are transitioning to cloud-native architectures but still rely on critical VM-based workloads.
Challenges in VM Migration
Migrating VMs from traditional hypervisors like VMware vSphere, Red Hat Virtualization (RHV), or KVM to OpenShift Virtualization involves several tasks:
Assessing and planning for VM compatibility.
Exporting and transforming VM images.
Reconfiguring networking and storage.
Managing downtime and validation.
Ensuring repeatability across multiple workloads.
Manual migrations are error-prone and time-consuming, especially at scale. This is where Ansible comes in.
Role of Ansible Automation Platform in VM Migration
Ansible Automation Platform enables IT teams to:
Automate complex migration workflows.
Integrate with existing IT tools and APIs.
Enforce consistency across environments.
Reduce human error and operational overhead.
With pre-built Ansible Content Collections, playbooks, and automation workflows, teams can automate VM inventory collection, image conversion, import into OpenShift Virtualization, and post-migration validation.
High-Level Migration Workflow with Ansible
Here's a high-level view of how a migration process can be automated:
Inventory Discovery Use Ansible modules to gather VM data from vSphere or RHV environments.
Image Extraction and Conversion Automate the export of VM disks and convert them to a format compatible with OpenShift Virtualization (QCOW2 or RAW).
Upload to OpenShift Virtualization Use virtctl or Kubernetes API to upload images to OpenShift and define the VM manifest (YAML).
Create VirtualMachines in OpenShift Apply VM definitions using Ansible's Kubernetes modules.
Configure Networking and Storage Attach necessary networks (e.g., Multus, SR-IOV) and persistent storage (PVCs) automatically.
Validation and Testing Run automated smoke tests or application checks to verify successful migration.
Decommission Legacy VMs If needed, automate the shutdown and cleanup of source VMs.
Sample Ansible Playbook Snippet
Below is a simplified snippet to upload a VM disk and create a VM in OpenShift:
- name: Upload VM disk and create VM
hosts: localhost
tasks:
- name: Upload QCOW2 image to OpenShift
command: >
virtctl image-upload pvc {{ vm_name }}-disk
--image-path {{ qcow2_path }}
--pvc-size {{ disk_size }}
--access-mode ReadWriteOnce
--storage-class {{ storage_class }}
--namespace {{ namespace }}
--wait-secs 300
environment:
KUBECONFIG: "{{ kubeconfig_path }}"
- name: Apply VM YAML manifest
k8s:
state: present
definition: "{{ lookup('file', 'vm-definitions/{{ vm_name }}.yaml') }}"
Integrating with Ansible Tower / AAP Controller
For enterprise-scale automation, these playbooks can be run through Ansible Automation Platform (formerly Ansible Tower), offering:
Role-based access control (RBAC)
Job scheduling and logging
Workflow chaining for multi-step migrations
Integration with ServiceNow, Git, or CI/CD pipelines
Red Hat Migration Toolkit for Virtualization (MTV)
Red Hat also offers the Migration Toolkit for Virtualization (MTV), which integrates with OpenShift and can be invoked via Ansible playbooks or REST APIs. MTV supports bulk migrations from RHV and vSphere to OpenShift Virtualization and can be used in tandem with custom automation workflows.
Final Thoughts
Migrating to OpenShift Virtualization is a strategic step toward modern, unified infrastructure. By leveraging Ansible Automation Platform, organizations can automate and scale this migration efficiently, minimizing downtime and manual effort.
Whether you are starting with a few VMs or migrating hundreds across environments, combining Red Hat's automation and virtualization solutions provides a future-proof path to infrastructure modernization.
For more details www.hawkstack.com
0 notes