#path matrix in graph
Explore tagged Tumblr posts
Visit Tumblr Blog
Explore Tumblr blogs with no restrictions, modern design and the best experience.
Last Seen Tumblr Blogs


Fun Fact
If you dial 1-866-584-6757, you can leave an audio post for your followers.
Text
An adjacency list in a graph is a series of numbers that tells you how many nodes are adjacent to each node. So if you imagine a 3x3 square of rooms that all connect with a door in the center of each wall, the corner rooms would have a value of 2 (the side rooms adjacent to them), the side rooms would have a value of 3 (the adjacent corner rooms and the center), and the center would have a value of 4 (being adjacent to all 4 side rooms).
An adjacency matrix for a graph is possibly more confusing, depending on how your brain works, but defaults to containing more info and has faster lookups in terms of computer processing. It would represent those 9 rooms as a 9x9 grid and mark each door you could go out of as a 1 instead of a 0. So

becomes

And you can see it's symmetrical (split down the line of Xs), because you can go through a door either direction. If these were streets in a city and the street going from intersection E to F was a one-way street, the E,F would be a 1 but the F,E would be a 0.
To get a 2-hop option - everything available in 2 jumps from each point, allowing for overlap - you do slightly different things depending on whether List or Matrix is your representation.
For a List, you have a nested for loop, grabbing the set of adjacent options in the outer loop, and asking for them to spit out a list of their adjacent options in the inner loop. Imagine a 4-square of rooms
J Q K A
the outer loop would say, What's adjacent to J? Q- What's adjacent to Q? J and A are adjacent to Q K- What's adjacent to K? J and A are adjacent to K What's adjacent to Q? J- What's adjacent to J? Q and K are adjacent to J A- What's adjacent to A? Q and K are adjacent to A and so on. So the 2-hop for J ends up with J,A,J,A, for Q it's Q,K,Q,K, for K it's Q,K,Q,K, and for A it's J,A,J,A.
For matrices you do Matrix Multiplication. For square matrices of the same size (which works perfectly for us because we're trying to square the matrix in the first place) you take the row and column that meet at each point in the matrix and multiply across. If you were squaring a matrix
your new A would be A*A + B*D + C*G. Your new B would be A*B + B*E + C*H.
So the square of
For A,A it's a,a(0)*a,a(0) + b,a(1)*a,b(1) ... + i,a(0)*a,i(0) = 2 For B,A it's a,a(0)*b,a(1) + b,a(1)*b,b(1) ... + i,b(0)*b,i(0) = 0
And this makes sense. Remember, this is representing how many paths there are to go from one space to another in exactly 2 jumps. A,A means "how many paths go from A back to A in 2 steps." You can see there are 2: A -> B -> A and A -> D -> A. There's no way to actually take 2 steps starting from B and get to A. Using this logic we can guess by looking at the "map" that B,H would give us a value of 1, because there's only one way to get from B to H in 2 hops.
If we do the same cross-section trick to multiply it out, we have 1*0 + 0*0 + 1*0 + 0*0 + 1*1 + 0*0 + 0*1 + 0*0 + 0*1 and sure enough, we have just one spot where the numbers match up.
1 note
·
View note
Text
The Role of Mathematics in Data Science: Do You Really Need It?
Introduction
As data science continues to transform industries, many aspiring professionals wonder about the academic foundation required to succeed. One common path is an Information Technology Management degree, which combines technical knowledge with business strategy. But a key question remains—how important is mathematics in this field? This blog breaks down the role math plays in data science and whether it’s a must-have skill for building a successful career.
Why Math is Considered Foundational in Data Science
Mathematics is the engine that drives data science. While tools and programming languages help process data, math enables professionals to understand patterns, draw insights, and build accurate models. If you’re pursuing a Master’s in information management, a solid grasp of key mathematical concepts is essential for applying theory to real-world problems.
Here’s why math is foundational in data science:
Statistics and probability help in making predictions and understanding data trends.
Linear algebra is crucial for machine learning models, especially in image and language processing.
Calculus plays a role in optimization and fine-tuning algorithms.
Discrete mathematics helps in logic building, algorithm design, and data structures.
Numerical analysis supports dealing with real-time data computations and error management.
A clear understanding of these areas gives data professionals a competitive edge and deepens their analytical capabilities.
Core Areas of Mathematics Used in Data Science
Mathematics is at the heart of data science. While coding and software tools make execution easier, the logic and theory that drive data models come from mathematical principles. If you’re pursuing a Master’s in Information Systems, understanding the core areas of mathematics can help you connect technical knowledge with strategic data insights.
Here are the primary branches of math used in data science:
1. Statistics and Probability
These are the building blocks of data analysis. They help in understanding data distributions, correlations, hypothesis testing, and predictive modeling.
2. Linear Algebra
Essential for machine learning and deep learning, linear algebra supports matrix operations, vector transformations, and dimensionality reduction techniques like PCA (Principal Component Analysis).
3. Calculus
Mainly used for optimization, calculus helps fine-tune algorithms by minimizing or maximizing functions—important in training machine learning models.
4. Discrete Mathematics
This area supports algorithm development, graph theory, and logical reasoning—key for structuring data-driven solutions.
5. Numerical Methods
Important for handling real-world data problems, such as approximations, simulations, and missing or noisy data.
Each of these disciplines contributes to building, evaluating, and improving the performance of data models. Understanding these mathematical tools allows professionals to move beyond surface-level data analysis and dive into more meaningful, scalable solutions that impact business decisions.
Can You Learn Data Science Without Strong Math?
Futurense believes that data science should be accessible to all, regardless of your math background. While mathematics enhances your understanding of data science, it shouldn’t be a roadblock. With the right guidance, resources, and learning structure, anyone can build a solid foundation in data science—even without being a math expert.
Many students pursuing an MS in information systems come from diverse academic backgrounds, including business, humanities, or IT. While they may not have in-depth math skills initially, structured learning pathways allow them to pick up the necessary concepts along the way.
Here’s how you can learn data science without a strong math foundation:
Focus on application-first learning—understand the “why” before diving into the “how.”
Use tools like Python, R, and libraries such as scikit-learn or pandas, which simplify complex computations.
Practice with real-world datasets to see the impact of algorithms visually.
Enroll in beginner-friendly courses like those offered by Futurense, which explain mathematical concepts through relatable examples.
Supplement your learning with basic math resources—only what’s required to understand models, not to become a mathematician.
In essence, while math helps, it’s not a prerequisite. With the right mindset and support, your journey into data science can be successful and rewarding, even without being a math whiz.
Also, read this blog: Master’s in MIS in the USA: A Comprehensive Guide
How to Strengthen Your Math for Data Science
Strengthening your math skills can significantly improve your ability to understand and apply data science concepts effectively. Whether you’re currently pursuing an MS in information systems or planning to enroll in a Master’s in Information Systems, building a strong foundation in mathematics will enhance both your academic and professional journey.
Here’s how to sharpen your math for data science:
Start with the basics: Brush up on core topics like statistics, probability, linear algebra, and calculus through online platforms like Khan Academy, Coursera, or edX.
Practice consistently: Apply concepts regularly through hands-on projects, real datasets, or coding challenges.
Use visual tools: Leverage visual explanations and interactive tools to understand complex mathematical concepts more easily.
Connect theory to practice: Use Python libraries like NumPy and SciPy to see how mathematical operations work in data science environments.
Join study groups or forums: Engaging with peers can help reinforce learning and clarify doubts.
With consistent effort and the right resources, improving your math skills becomes less overwhelming and more rewarding, especially in a field where data-driven decisions matter most.
FAQ
1. Do I need to be good at math to learn data science?
While strong math skills are helpful, they are not mandatory to begin. With practical resources and supportive courses, you can strengthen your math knowledge alongside your data science learning journey.
2. What kind of math is used in data science?
Key areas include statistics, probability, linear algebra, calculus, and discrete mathematics. These help in understanding data structures, building models, and interpreting results.
3. Is a Master’s in Information Systems math-heavy?
A Master’s in Information Systems involves some mathematical components like statistics and data analysis, but it also focuses on technology, management, and strategy.
4. How can I improve my math skills for data science?
Start with beginner-friendly courses online, work on real datasets, and practice using Python libraries like NumPy and pandas. Regular practice is key.
5. Is math more important than coding in data science?
Both are important. Coding helps you implement models, while math helps you understand and improve them. A balance of both skills leads to better outcomes.
Source URL: https://postyourarticle.com/role-of-mathematics-in-data-science/
0 notes
Text
CS590 homework 6 – Graphs, and Shortest Paths
Develop a data structure for directed, weighted graphs G = (V, E) using an adjacency matrix representation.. The d.atatype int is used to store the weight of edges. int does not allow one to represent ±co. Use the values INTYIN and IN’T_MAX (defined in limits .h) instead. include <limits-h5 in.t d, e; d = INT_MAX; e = INT_MIN; if (e == ih–r_mir;) if (d I = IN–1_102A10 . Develop a…
0 notes
Text

In network science, embedding refers to the process of transforming nodes, edges, or entire network structures into a lower-dimensional space while preserving the network's essential relationships and properties. Network embeddings are particularly valuable for machine learning applications, as they allow complex, non-Euclidean data (like a social network) to be represented in a structured, high-dimensional vector format that algorithms can process.
Building on the concept of embeddings in network science, these transformations unlock several advanced applications by enabling traditional machine learning and deep learning methods to operate effectively on graph data. A key advantage of embeddings is their ability to encode structural and relational information about nodes in a network into compact, dense vectors. This allows complex, sparse graphs to be represented in a way that preserves both local connections (like close friendships) and global structure (like communities within the network).
There are multiple approaches to generating these embeddings, each with its own strengths:
Random Walk-based Methods: Techniques like DeepWalk and node2vec use random walks to capture the network’s context for each node, similar to how word embeddings like Word2Vec capture word context. By simulating paths along the graph, these methods learn node representations that reflect both immediate neighbors and broader network structure.
Graph Neural Networks (GNNs): Graph neural networks, including variants like Graph Convolutional Networks (GCNs) and Graph Attention Networks (GATs), use neural architectures designed specifically for graph data. GNNs aggregate information from neighboring nodes, creating embeddings that adaptively capture the influence of each node’s surroundings. This is especially useful in tasks that require understanding both individual and community-level behavior, such as fraud detection or personalized recommendations.
Matrix Factorization Techniques: These methods, like LINE (Large-scale Information Network Embedding), decompose the graph adjacency matrix to find latent factors that explain connections within the network. Matrix factorization can be effective for representing highly interconnected networks, such as knowledge graphs, where the relationships between entities are intricate and abundant.
Higher-order Proximity Preserving Methods: Techniques like HOPE (High-Order Proximity preserved Embeddings) go beyond immediate neighbors, capturing higher-order structural relationships in the network. This approach helps model long-distance relationships, like discovering latent social or biological connections.
Temporal Network Embeddings: When networks evolve over time (e.g., dynamic social interactions or real-time communication networks), temporal embeddings capture changes by learning patterns across network snapshots, allowing predictive tasks on network evolution, like forecasting emerging connections or trends.
Network embeddings are powerful across disciplines. In financial networks, embeddings can model transaction patterns to detect anomalies indicative of fraud. In transportation networks, embeddings facilitate route optimization and traffic prediction. In academic and citation networks, embeddings reveal hidden relationships between research topics, leading to novel insights. Moreover, with visualization tools, embeddings make it possible to explore vast networks, highlighting community structures, influential nodes, and paths of information flow, ultimately transforming how we analyze complex interconnections across fields.
0 notes
Text

What Does Big O(N^2) Complexity Mean?
It's critical to consider how algorithms function as the size of the input increases while analyzing them. Big O notation is a crucial statistic computer scientists use to categorize algorithms, which indicates the sequence of increase of an algorithm's execution time. O(N^2) algorithms are a significant and popular Big O class, whose execution time climbs quadratically as the amount of the input increases. For big inputs, algorithms with this time complexity are deemed inefficient because doubling the input size will result in a four-fold increase in runtime.
This article will explore what Big O(N^2) means, analyze some examples of quadratic algorithms, and discuss why this complexity can be problematic for large data sets. Understanding algorithmic complexity classes like O(N^2) allows us to characterize the scalability and efficiency of different algorithms for various use cases.
Different Big Oh Notations.
O(1) - Constant Time:
An O(1) algorithm takes the same time to complete regardless of the input size. An excellent example is to retrieve an array element using its index. Looking up a key in a hash table or dictionary is also typically O(1). These operations are very fast, even for large inputs.
O(log N) - Logarithmic Time:
Algorithms with log time complexity are very efficient. For a sorted array, binary search is a classic example of O(log N) because the search space is halved each iteration. Finding an item in a balanced search tree also takes O(log N) time. Logarithmic runtime grows slowly with N.
O(N) - Linear Time:
Linear complexity algorithms iterate through the input at least once. Simple algorithms for sorting, searching unsorted data, or accessing each element of an array take O(N) time. As data sets get larger, linear runtimes may become too slow. But linear is still much better than quadratic or exponential runtimes.
O(N log N) - Log-Linear Time:
This complexity results in inefficient sorting algorithms like merge sort and heap sort. The algorithms split data into smaller chunks, sort each chunk (O(N)) and then merge the results (O(log N)). Well-designed algorithms aimed at efficiency often have log-linear runtime.
O(N^2) - Quadratic Time:
Quadratic algorithms involve nested iterations over data. Simple sorting methods like bubble and insertion sort are O(N^2). Matrix operations like multiplication are also frequently O(N^2). Quadratic growth becomes infeasible for large inputs. More complex algorithms are needed for big data.
O(2^N) - Exponential Time:
Exponential runtimes are not good in algorithms. Adding just one element to the input doubles the processing time. Recursive calculations of Fibonacci numbers are a classic exponential time example. Exponential growth makes these algorithms impractical even for modestly large inputs.
What is Big O(N^2)?
An O(N2) algorithm's runtime grows proportionally to the square of the input size N.
Doubling the input size quadruples the runtime. If it takes 1 second to run on 10 elements, it will take about 4 seconds on 20 elements, 16 seconds on 40 elements, etc.
O(N^2) algorithms involve nested iterations through data. For example, checking every possible pair of elements or operating on a 2D matrix.
Simple sorting algorithms like bubble sort, insertion sort, and selection sort are typically O(N^2). Comparing and swapping adjacent elements leads to nested loops.
Brute force search algorithms are often O(N^2). Checking every subarray or substring for a condition requires nested loops.
Basic matrix operations like multiplication of NxN matrices are O(N^2). Each entry of the product matrix depends on a row and column of the input matrices.
Graph algorithms like Floyd-Warshall for finding the shortest paths between all vertex pairs is O(N^2). Every possible path between vertices is checked.
O(N^2) is fine for small inputs but becomes very slow for large data sets. Algorithms with quadratic complexity cannot scale well.
For large inputs, more efficient algorithms like merge sort O(N log N) and matrix multiplication O(N^2.807) should be preferred over O(N^2) algorithms.
However, O(N^2) may be reasonable for small local data sets where inputs don't grow indefinitely.
If you want more learning on this topic, please read more about the complexity on our website.
0 notes
Text
CS590 homework 6 – Graphs, and Shortest Paths
Develop a data structure for directed, weighted graphs G = (V, E) using an adjacency matrix representation.. The d.atatype int is used to store the weight of edges. int does not allow one to represent ±co. Use the values INTYIN and IN’T_MAX (defined in limits .h) instead. include <limits-h5 in.t d, e; d = INT_MAX; e = INT_MIN; if (e == ih–r_mir;) if (d I = IN–1_102A10 . Develop a…

View On WordPress
0 notes
Text
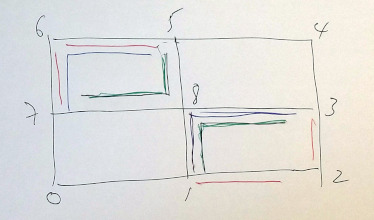
Non-Eulerian paths
I've been doing a bit of work on Non-Eulerian paths. I haven't made any algorithmic progress with the non-spiraling approach Piotr Waśniowski uses for such paths, but I'm keen to continue the development of the approach using spiral paths since I believe that this yields strong structures.
I'm using the Hierholzer algorithm to find paths in a Eulerian graph and I've been looking at the changes needed for non-Eulerian graphs, i.e. those where the order of some vertices is odd. For graphs with only 2 odd nodes, a solution is to use pairs of layers which alternate starting nodes. In the general case (Chinese Postman Problem) duplicate edges are added to convert the graph to Eulerian and then Hierholzer used to solve the resultant graph. I hadn't actually tried this before but I've now used this approach on some simple cases.

(the paths here were constructed via Turtle graphics just to test the printing - in transparent PLA)
The hard part is to evaluate the alternative ways in which the duplicate edges can be added. We can minimise the weighted sum of edges but for the rectangle this still leaves several choices and I need to think about how they can be evaluated. I think immediate retracing of an edge should be avoided so perhaps maximising the distance between an edge and its reverse would be useful.
The duplicate edges cause a slight thickening and a loss of surface quality (so better if they are interior) but I think that's a small cost to retain the spiral path. Path length for the rectangle is 25% higher I haven't tried them with clay yet.
Modifying Hierholzer
I had originally thought that to formulate such graphs for solution by Hierholzer, each pair of duplicate edges would require an intermediate node to be added to one of the edges to create two new edges. This would be the case if the graph was stored as an NxN matrix, but my algorithm uses a list of adjacent nodes, since this allows weights and other properties to be included. Removing a node from the matrix is much faster (just changing the entry to -1) than removing the node from a list but for my typical applications efficiency is not a big issue. The list implementation requires only a simple modification to remove only the first of identical nodes. This allows duplicate edges to be used with no additional intermediate nodes.
This is test interface for the Hierholzer algorithm which accepts a list of edges.
Here is an example with three hexagons:

with graph
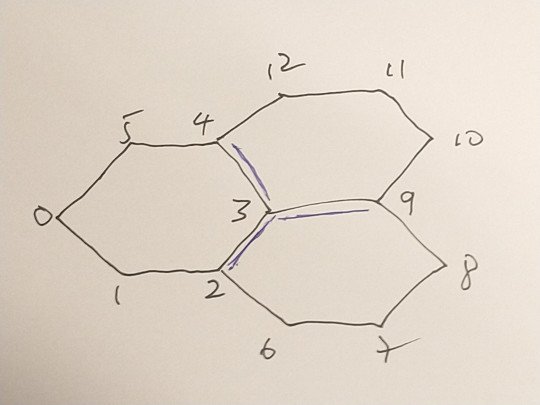
and edge list:
[ [0,1],[1,2],[2,3],[3,4],[4,5],[5,0], [3,2],[2,6],[6,7],[7,8],[8,9],[9,3], [3,9],[9,10],[10,11],[11,12],[12,4],[4,3] ]
Nodes 2,3,4 and 9 are odd. There is only one way to convert to Eulerian. We need to duplicate three edges : [3,4], [3,9],[3,2] so that nodes 4,9, and 2 become order 4 and node 3 becomes order 6. The path used to generate the printed version above was constructed as a Turtle path with only 60 degree turns:
[3, 9, 10, 11, 12, 4, 3, 2, 6, 7, 8. 9, 3, 4, 5, 0, 1, 2]
Hierholzer constructs the following path starting at the same node
[3, 2, 1, 0, 5, 4, 3, 2, 6, 7, 8, 9, 3, 9, 10, 11, 12, 4]
There is a sub-sequence [9,3,9] which indicates an immediate reversal of the path. This creates the possibility of a poor junction at node 3 and is to be avoided.
Furthermore, this path is the same regardless of the starting point. The choice of which edge amongst the available edges from a node at each step is deterministic in this algorithm but it could be non-deterministic. With this addition, after a few attempts we get :
[0, 1, 2, 3, 9, 10, 11, 12, 4, 3, 2, 6, 7, 8, 9, 3, 4, 5]
with no immediately repeated edges
This provides a useful strategy for a generate-test search: repeatedly generate a random path and evaluate the path for desirable properties , or generate N paths and choose the best.
However, this approach may not be very suitable for graphs where all nodes are odd, such as this (one of many ) from Piotr:
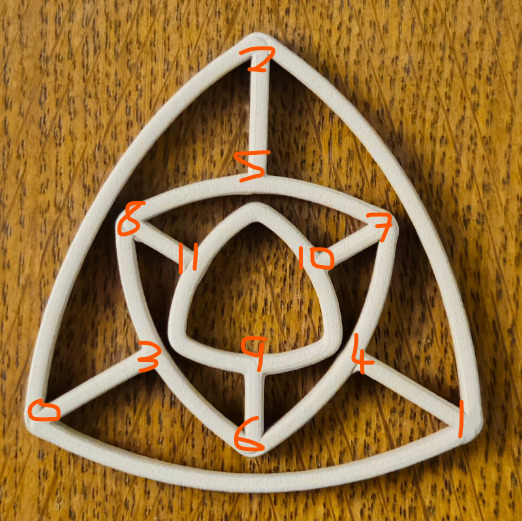
The edge list for this shape is
[0,1],[1,2],[2,0], [0,3],[1,4],[2,5], [3,6],[6,4],[4,7],[7,5],[5,8],[8,3], [9,10],[10,11],[11,9], [6,9],[7,10],[8,11],
duplicate the spokes
[0,3],[1,4],[2,5], [6,9],[7,10],[8,11]
Here every node is odd. The 6 spokes are duplicated. Sadly no path without a reversed edge can be found.
The simpler form with only two triangles and 3 duplicated spokes:
[ [0,1],[1,2],[2,0], [0,3],[1,4],[2,5], [0,3],[1,4],[2,5], [3,4],[4,5],[5,3] ]
does however have a solution with no reversed edges although it takes quite a few trials to find it:
[0,2,5,4,1,2,5,3,0,1,4,3]
Triangles
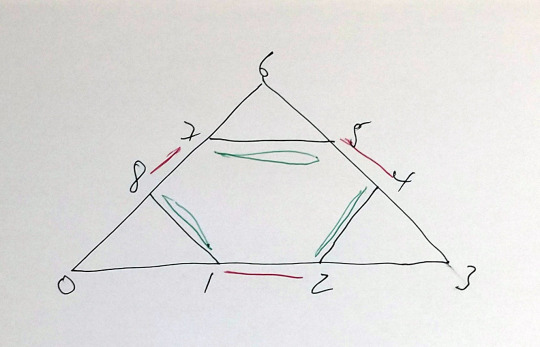
Edges can be duplicated in two ways
[[0,1],[1,2],[2,3],[3,4],[4,5],[5,6],[6,7],[7,8],[8,0] ,[2,4],[5,7],[8,1]
a) duplicating the interior edges min 4
[2,4],[5,7],[8,1]
b) duplicating the exterior edges min 6 [1,2],[4,5],[7,8]
Rectangle
Edges can be duplicated in three different ways
[0,1],[1,2],[2,3],[3,4],[4,5],[5,6],[6,7],[7,0], [1,8],[3,8],[5,8],[7,8],
a) [1,2],[2,3], [5,6],[6,7] min 6 b) [1,8],[8,3], [5,6],[6,7] min 4 c) [1,8],[8,3], [5,8],[8,7] min 4
Automating edge duplication
The principal is straightforward: chose an odd node, find its nearest neighbour and duplicate the connecting edge(s) ;repeat until all odd nodes connected. To test various configurations, allow the choice of node and its nearest neighbour, if several, to be randomised and compute a selection evaluation from the result.
Currently the choice is based on the length of the path from each node to the revisit of that node. Path length of 2 means an immediate return and these should be avoided if possible.
Testing with clay
Whilst tests with PLA show no significant changes in appearance whilst retaining the benefits of a spiral print path, this approach has yet to be tested with clay
Postscript
A side-benefit of this work has been that I've finally fixed an edge case in my Hierholzer algorithm which has been bugging me for some years
0 notes
Text
Abstract
In this work, we propose an encryption and decryption algorithm in a computer network, using ideas from graph theory and matrices. We attempt to simulate a method in which data can be transferred efficiently post-encryption and study how such an algorithm performs. Random complete graphs consisting of 250 vertices and 31125 edges were created, with randomly chosen start and end nodes to depict the initial source and final destination for data transferred. The algorithm harnesses the idea of a random graph and assigns a multi-dimensional weight to each node. These weights, along with a randomly generated path are used to build an encryption matrix that increases the randomness in the encryption, making it a more robust encryption algorithm. An analysis of the average time taken for which a 16-bit number was encoded, using an M1 2020 Macbook Air was just over 5 milliseconds, relatively fast for a secure algorithm. The algorithm could be improved by having additional parameters, such as increasing the random path length, the number of vertices or even using 3 x 3 matrices, resulting in more data to be encrypted and a more secure system, though this may lead to a trade-off of a longer run time.
0 notes
Text
A matrix representation of a graph of a square with doors going from 1-2 and back, 2-3 and back, 3-4 and back, and 4-1 and back, would look like this 0101 1010 0101 1010 Each node has a total degree of 4. In spite of using a door as an analogy the "degree" counts the fact that there's a path out to and in from those adjacent rooms. Looking at the matrix you can get the same result by adding up the number of 1s in the matching row and column. In row 3 there are two 1s, indicating the means to go out to rooms 2 and 4. In column 3 there are two 1s, indicating the ability to come in from rooms 2 and 4.
Now imagine the same square but it's all 1-way streets. You can only go from 1-2, from 2-3, from 3-4, and from 4-1. It looks like so: 0100 0010 0001 1000 You can see that the matrix still shows the correct information. Row 1 column 2 has a 1 in it, so you can go from 1 to 2. Row 4 column 1 has a 1 in it, so you can go from 4 to 1. And between row 1 and column 1 you have a total of two 1s, so the first node has a degree of two.
The adjacency list representation of the "doorways" is like this:
1 - (2,4) 2 - (1,3) 3 - (2,4) 4 - (1,3)
The list representation is nice when you've got big areas described, because you may have noticed that even with just a square there's a lot of needless 0s telling you "there's not a line between these two points going this direction." With the list you only bother to say something exists when it's something existing.
0 notes
Text
Path Matrix in Data Structure with Example
Path Matrix in Data Structure with Example
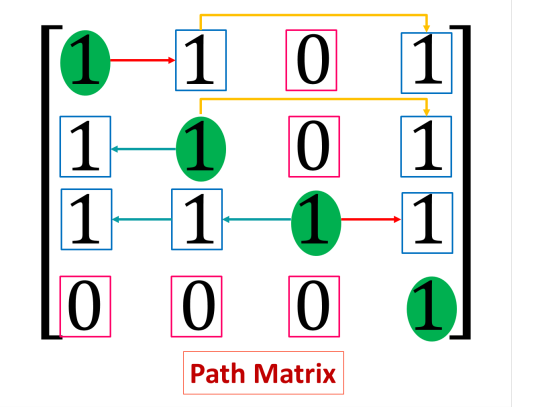
Path Matrix refers to a special type of data representation in data structure specially in graph theory. Path Matrix represents the availability of a path from a node to another node. What is Path Matrix? A path matrix is a matrix representing a graph, where each value in m’th row and n’th column project whether there is a path from node m to node n. The path may be direct or indirect. It may…
View On WordPress
0 notes
Text

[Image ID: a sketchbook page spread of a black pen sketch depicting Lee Moriarty and Wheeler yuta. Moriarty is in the foreground, on his knees. he looks right with his mouth slightly open. his right arm hangs by his body, while his left is on top of Yuta's head, grabbing hold of his hair. Yuta is also on the mat, and supports his weight on his left arm. underneath the sketch, most of the left page is covered in writing in a cyan pen and a visibly dry yellow highlighter. the right page is cleaner, though still has messy writing on it as well as a graph sketch. the top right corner is oil-stained. /.End ID]
i call such a structure a “path invariant matrix system.” points in some space are linked by edges that are labeled with matrices in such a way that the matrix product taken along any path depends only on the endpoints. in other words, the beginning and ending eclipse the journey.
59 notes
·
View notes
Text
Top 10 Data Science Project Ideas For Beginners - 2021

If you are an aspiring data scientist, then it is mandatory to involve in live projects to hone up your skills. These projects will help you to brush up your knowledge on knowledge and skills and boost up your career path. Now, if you write about those live projects on your resume, then there is a very good chance that you land up with your dream job on data science. But to be a top-notch data science engineer, it is essential to work on various projects. For this, it is important to know the best project ideas which you can leverage further on your CV.
Start Working on Live Projects to Build your Data Science Career
To get a sound idea for data science projects, you should be more concerned about it rather than it’s implementation. Because of this, we have come up with the best ideas for you. Here we have enlisted the top 10 project ideas that can shape your future in the world of data science. But to begin such programs or live projects, you need to have a good understanding of Python and R languages.
1. Credit Card Fraud Detection Mechanism
This project requires knowledge of ML and R programming. This project mainly deals with various algorithms that you can get familiar with once you start doing your applied machine learning course. These algorithms mainly cover Logistic Regression, Artificial Neural Networks, Gradient Boosting Classifiers, etc. From the record of the Credit Card transactions, you can surely be able to differentiate between fraudulent and genuine data. After that, you can draw various models and use the performance curve to understand the behavior.
This project involves the Credit Card transaction datasets that give a pure blend of fraudulent as well as non-fraudulent transactions. It implements the machine learning algorithm using which you can easily detect the fraudulent transaction. Also, you will understand how to utilize the machine learning algorithm for classification.
2. Customer Segmentation :
It is another such intriguing data science project where you need to use your machine learning skills. This is basically an application of unsupervised learning where you need to use clustering to find out the targeted user base. Customers are segregated on the basis of various human traits such as age, gender, interests, and habit. Implementation of K-means clustering will help to visualize gender as well as different age distribution. Also, it helps to analyze annual income and spending ideas.
Here the companies deal with segregating various groups of people on the basis of the behavior. If you work on the project, you will understand K means clustering. It is one of the best methods to know the clustering of the unlabeled datasets. Through this platform, companies get a clear understanding of the customers and what are their basic requirements. In this project, you need to work with the data that correlates with the economic scenario, geographical boundaries, demographics, as well as behavioral aspects.
3. Movie Recommendation System :
This data science project can be rewarding since it uses R language to build a movie recommendation system with machine learning. The Recommendation system will help the user with suggestions and there will be a filtering process using which you can determine the preference of the user and the kind of thing they browse. Suppose there are two persons A and B and they both like C and D movies. This message will automatically get reflected. Also, this will engage the customers to a considerable extent.
It gives the user various suggestions on the basis of the browsing history and various preferences. There are basically two kinds of recommendation available-content based and collaborative recommendation. This project revolves around the collaborative filtering recommendation methodology. It tells you on the basis of the browsing history of various people.
4. Fake News :
It is very difficult to find out how an article might deceive you mostly for social media users. So, is it possible to build a prototype to find out the credibility of particular news? This is a major question but thanks to the data science professionals of some of the major universities to answer the problem. They begin with the major focus of the fake news of clickbait. In order to build a classifier, they extracted data from the news that is published on Opensource. It is used to preprocess articles for the content-based work with the help of national language processing. The team came up with a unique machine learning model to segregate news articles and build a web application to work as the front end.
The main objective is to set up a machine learning model that provides you with the correct news since there is much fake news available on social media. You can use TfidfVectorizer and Passive-Aggressive classifier to prepare a top-notch model. TF frequency tells the number of times a particular word is displayed in the document. Inverse Document Frequency tells you the significance of a word on the basis of which it is available on several contents. Therefore, it is important to know how it works.
A TfidfVectorizer helps in analyzing a gamut of documents.
After analyzing, it makes a TF-IDF matrix.
A passive-aggressive Classifier tells you whether the classification outcome is viable. However, it changes if the outcome swings in the opposite direction.
Now, you can build a machine learning model if you have such good project ideas.
5. Color Detection :
It might have happened that you don’t remember the name of the color even after seeing a particular object. There is an ample number of colors that are totally based on the RGB color values but you can hardly remember any. Therefore, this data science project will deal with the building of an interactive app that will find the chosen color from the available options. In order to enable this, there should be a detailed level of data for all the available colors. This will help you to find out which color will work for the selected range of color values.
In this project, you will require Python. You will utilize this language in creating an application that will tell you the name of the color. For this, there is a data file that comes with color names and values. Then it will be utilized to evaluate the distance from each color and find out the shortest one. Colors are segregated into red, green, and blue. Now the PC will analyze the range of the colors varying from 0 to 255. There are a plethora of colors available and in the dataset, you need to align each color value with the corresponding names. It requires a dataset that comprises RGB values as per the names.
6. Driver Drowsiness Detection :
In order to perform training and test data, researchers have come up with a Drowsiness Test which uses the Real Life Drowsiness dataset in order to detect the multi-stage drowsiness. The objective is to find out the extreme and discernible cases related to drowsiness using data science Skill. However, it permits the system to find out the softer signals of drowsiness. After that, comes the feature extraction which needs developing a classification model.
Since overnight driving is really a difficult task and leads to varied problems, the driver gets drowsy and feels quite sleepy while driving. This project helps to detect the time when the driver gets lazy and falls asleep. It produces an alarming sound as soon as it detects it. It implements a unique deep learning model to determine whether the driver is awake or not. This comes with a parameter to find out how long we stay awake. If the score is raised above the threshold value, then the alarm rings up. Now, you can easily be able to get the related dataset and Source Code.
7. Gender and Age Detection :
This is basically a computer vision and machine learning project that implements convolutional neural networks or CNN. The main objective is to find out the gender and age of a person using a single image of the face. In this data science project, you can segregate gender as male or female. After that, you can classify the age on the basis of various ranges like 0-2, 4-6, 15-20, and many more. Because of different factors such as makeup, lighting, etc, it is very difficult to recognize gender and age forms a particular image. Due to this, the project implements a classification model instead of regression.
For the purpose of face detection, you will require a .pb file since this is a protobuf file. It is capable of holding the graph definition and the trained weights of the model. A .pb file is used to hold the protobuf in a binary format. However, the .pbtxt extension is used to hold this in the text format. In order to detect the gender, the .prototxt file is used to find out the network configuration. The .caffemodel file is used here to denote the internal states of various parameters.
8. Prediction Of The Forest Fire :
Both forests, as well as the wildfire, ignites a state of emergency and health disasters in modern times. These disasters can hamper the ecosystem and this can cause too much money. Also, a huge infrastructure is required to deal with such issues. Therefore, using the K-means clustering you can easily be able to detect the forest fire hotspots and the disastrous effect of this nature’s fury. With this, it can cause faster resource allocation and the quick response. The meteorological data can be used to determine the seasons during the forest fires that are more frequent. Also, you can determine the weather conditions and climatic change that can reduce them and bring sustainable weather.
9. Effect of Climate Change on Global Food Supply :
Climatic change seems to affect various parts of the world. As a result, people residing in those areas are also under the wrath of such climatic change. The project mainly deals with the impact the climatic change is having and its effect on the entire food production. Main motive of the project is to determine the adverse effect of the climate on the production of crops. The project ideas mainly revolve around the impact of temperature and the rainfall along with the diversified cause of carbon dioxide on the growth of the plants. This project mainly focuses on the various data visualization techniques and different data comparisons will be drawn to find out the yield in various regions.
10. Chatbot-Best After the Data Science Online Training :
This is one of the famous projects done by the most aspiring data science professionals. It plays an important role in the business. They are used to give better services with very little manpower. In this project, you will see the deep learning techniques to talk with customers and can implement those using Python. There are basically two types of chatbots available. One deals with the domain which is used to solve a particular issue and the other one is an open domain chatbot. The second one you can use to ask various types of questions. Due to this, it requires a lot of data to store.
“ Upskill Yourself Through Online Data Science Courses and Become a Professional ”
The projects discussed in this technical article covers all the major Data Science projects which you need to do if you are a budding data science professional. But before that, you need to have a good grasp on various programming languages like Python and R. If you do the data science online tutorials, then these projects will be a cakewalk for you. Remember, one thing these small steps will make the large blocks so that you can rule the world of data science.. So, go ahead and participate in these live projects to gain relevant experience and confidence.
#data science#datascience#project#tutorials#online learning#learn data science#data science projects#online courses#online training#upskill#greatlearning#Great Learning Academy#free course#free online courses#online data science course#elearning
49 notes
·
View notes
Text
Lupine publishers|The Spectral Characterization of Hamiltonicity of Graphs
The Spectral Characterization of Hamiltonicity of Graphs

Introduction It is an important NP-complete problem in structure graph theory to judge whether a graph is Hamiltonian. So far, there is no perfect description on this problem. Therefore, it has always been concerned by the workers of graph theory and mathematics. It is explored that the new method for characterization of Hamiltonicity of graphs. Because the spectrum of a graph can well reflect the structural properties of a graph and is easy to calculate, at the 2010 conference of the theory of graph spectra, M. Fiedler and V. Nikiforov formally proposed whether the theory of graph spectra can be used to study the Hamiltonicity of a graph, and they [1] gave sufficient conditions for given graph to be Hamiltonian (or traceable) in terms of the spectral radius of the graph. Since then, relying on the spectrum of matrix representation of graph, giving the spectral sufficient conditions of the Hamiltonian graph has been a new method to study the Hamilton problem. Many results have been obtained by using the spectral radius and the signless Laplacian spectral radius of the graph to describe the Hamiltonicity of the graph. [2] firstly gave a sufficient condition for a graph G to be Hamiltonian and traceable by using the signless Laplacian spectral radius of the complement of the graph [3] optimized the condition of the number of edges of the Hamilton graph, gave a better condition for G to be traceable by using the spectral radius of the graph G, and firstly gave a sufficient condition for the balanced bipartite graph to contain the Hamilton cycle by the spectral radius of its quasi-complement graph. [4] firstly used the spectral radius and signless Laplacian spectral radius of the graph to describe the Hamilton-connected of the graph. [5] used the signless Laplacian spectral radius of the quasi-complement graph of the balanced bipartite graph to give a sufficient condition for the balanced bipartite graph to be Hamiltonian and used the signless Laplacian spectral radius of the graph G to give a sufficient condition for the graph G to be traceable or Hamilton-connected. [6] continued to study the relationship between the Hamiltonicity and spectral radius of general graphs and balanced bipartite graphs and extended the conclusions in [3] and [5]. [7] firstly proposed to use the stability of graphs to study the Hamiltonian properties of graphs, and also summarized the method of studying the spectral characterization of the Hamiltonian graph by optimizing the boundary conditions of the Hamiltonian graph. [8] firstly characterized traceability of connected claw-free graphs by spectral radius. [9] discussed spectral conditions for Hamiltonicity of claw- free graphs. [10] firstly presented spectral sufficient conditions for a k-connected graph to be traceable or Hamilton-connected. [11] firstly presented sufficient conditions based on spectral radius for a graph to be k-connected, k-edge- connected, k-Hamiltonian, k-edge-Hamiltonian, β-deficient and k-path-coverable. Lately, [12] firstly gave spectral radius or signless Laplacian spectral radius conditions for a graph to be pancyclic. Because the minimum degree of a graph is related to the density of the graph, with the deepening of research, people began to study the spectral characterization of Hamiltonian properties of graphs with large minimum degree conditions and gave the better conclusions. By adding the condition of large minimum degree, [13] firstly presented some (signless Laplacian) spectral radius conditions for a simple graph and a balanced bipartite graph to be traceable and Hamiltonian, respectively. Subsequently, [14] optimized the lower bound of the spectral condition of simple graphs with large minimum degree; [15]
optimized the lower bound of the spectral condition of balanced bipartite graphs with large minimum degree. [16] characterized the signless Laplacian spectral radius conditions for a graph or balanced bipartite graph with large minimum degree to be Hamiltonian. [17] and [18] studied the signless Laplacian spectral radius condition for a graph with large minimum degree to be Hamilton-connected. [19] presented some spectral radius conditions for a balanced bipartite graph or a nearly balanced bipartite graph with large minimum degree to be traceable, respectively. [20] gave some spectral sufficient conditions for a balanced bipartite graph with large minimum degree to be traceable and Hamiltonian in terms of the spectral radius of the graph with large minimum degree. It strengthened the according results of Li and Ning for n sufficiently large. [21] presented some conditions for a simple graph with large minimum degree to be Hamilton-connected and traceable from every vertex in terms of the spectral radius of the graph or its complement respectively
and gave better conditions for a nearly balanced bipartite graph with large minimum degree to be traceable in terms of spectral radius, signless Laplacian spectral radius of the graph or its quasi-complement respectively. [22] presented sufficient spectral conditions of a connected graph with large minimum degree to be k-hamiltonian or k-path-coverable or β-deficient, for relatively large n. [23] gave the sufficient conditions for a graph with large minimum degree to be s-connected, s-edge-connected, β-deficient, s-path-coverable, s-Hamiltonian and s-edge-Hamiltonian in terms of spectral radius of its complement. Other spectral characterizations on Hamiltonicity, at present, only [24,25] used the Laplacian eigenvalues to give the spectral sufficient condition for the graph to be Hamiltonian. [26] firstly applied the distance signless Laplacian spectral radius of the graph’s complement to give a sufficient condition for the graph to be traceable or Hamiltonian. [27] firstly discussed the Hamiltonian in terms of the energy of graph. [28], by adding the maximum degree condition on the basis of [26], used the energy of complement graph to give the sufficient conditions for the graph to be traceable, Hamiltonian and Hamilton-connected. The results optimized the conclusions of [26] in a sense. [22] gave some sufficient conditions for a nearly balanced bipartite graph with large minimum degree to be traceable in terms of the energy, the first Zagreb index and the second Zagreb index of the quasi-complement of the graph, respectively. By observing, we find that the conditions of all the above conclusions deduce that the graphs are dense. In fact, there are many Hamiltonian graphs with non dense edge distribution, such as cycles. Therefore, it is necessary to study whether a non- dense graph (sparse graph) is a Hamiltonian graph, but there are few research results. Komlos and Szemeredi proposed that almost all graphs are Hamiltonian graphs in 1975. Inspired by this, [29] characterized the Hamiltonian property of regular graphs by using the adjacency spectrum of graphs; [30] characterized the Hamiltonian property of almost regular graphs by using the Laplace spectrum of graphs. In 2011, Radcliffe proposed whether we can give sufficient conditions for Hamiltonian graphs by using the normal Laplace spectrum of graphs. In 2012, [31] studied this problem, gave corresponding conclusions, and explained that the conclusions are applicable to the determination of Hamiltonicity of general graphs. Although there are a lot of results, there are still many problems worthy of further study. Firstly, combining the ideas from theorems of Ore and Fan to develop extremal spectral conditions for dense graphs (with given connectivity, toughness, forbidden subgraphs) to be Hamiltonian (or related structural properties). Such as, finding spectral sufficient conditions for a graph or its complement to be Hamilton-connected, or k-Hamiltonian, k-path-coverable, k-edge-Hamiltonian; signless Laplacian spectral radius sufficient conditions for a (nearly) balanced bipartite graph or its nearly complement to be traceable, or Hamiltonian; (signless Laplacian) spectral radius sufficient conditions for the nearly complement of a balanced bipartite graph to be bipancyclic or considering the case with minimum degree; the characterization of Hamiltonicity of graphs with 1-tough [32,33]. Secondly, due to the difficulty of research, there are only three papers to study Hamiltonian properties of sparse graphs, but there are many sparse Hamiltonian graphs. Therefore, there is a lot of space to explore some sufficient or necessary conditions for sparse graphs with some properties to be Hamiltonian (or related structural properties) by using the spectrum of the graph and corresponding
eigenvector. At last, directed graphs also have Hamiltonian properties, but all previous studies have only considered undirected graph. So, it is also very valuable to study extremal spectral conditions for oriented graphs to be Hamiltonian. The research on the spectral characterization of Hamiltonicity of graphs build a bridge between structure graph theory and algebraic graph theory. Expected results not only enrich the study of Hamilton problem in structural graph theory, but also extend the spectral study of algebraic graph theory, thus promoting the research of algebraic method of Hamilton problem. Acknowledgements Supported by the Natural Science Foundation of China (No. 11871077), the NSF of Anhui Province (No. 1808085MA04), the NSF of Department of Education of Anhui Province (No. KJ2020A0894), and Research and innovation team of Hefei Preschool Education College (No. KCTD202001).
For more information about Journal of Anthropological and Archaeological Sciences archive page click on below link
https://lupinepublishers.com/anthropological-and-archaeological-sciences/archive.php
For more information about lupine publishers page click on below link
https://lupinepublishers.com/index.php
#lupine publishers group#Journal of Anthropological and Archaeological Sciences#sufficient conditions for a graph
2 notes
·
View notes
Link
Data Structures and Algorithms from Zero to Hero and Crack Top Companies 100+ Interview questions (Java Coding)
What you’ll learn
Java Data Structures and Algorithms Masterclass
Learn, implement, and use different Data Structures
Learn, implement and use different Algorithms
Become a better developer by mastering computer science fundamentals
Learn everything you need to ace difficult coding interviews
Cracking the Coding Interview with 100+ questions with explanations
Time and Space Complexity of Data Structures and Algorithms
Recursion
Big O
Dynamic Programming
Divide and Conquer Algorithms
Graph Algorithms
Greedy Algorithms
Requirements
Basic Java Programming skills
Description
Welcome to the Java Data Structures and Algorithms Masterclass, the most modern, and the most complete Data Structures and Algorithms in Java course on the internet.
At 44+ hours, this is the most comprehensive course online to help you ace your coding interviews and learn about Data Structures and Algorithms in Java. You will see 100+ Interview Questions done at the top technology companies such as Apple, Amazon, Google, and Microsoft and how-to face Interviews with comprehensive visual explanatory video materials which will bring you closer to landing the tech job of your dreams!
Learning Java is one of the fastest ways to improve your career prospects as it is one of the most in-demand tech skills! This course will help you in better understanding every detail of Data Structures and how algorithms are implemented in high-level programming languages.
We’ll take you step-by-step through engaging video tutorials and teach you everything you need to succeed as a professional programmer.
After finishing this course, you will be able to:
Learn basic algorithmic techniques such as greedy algorithms, binary search, sorting, and dynamic programming to solve programming challenges.
Learn the strengths and weaknesses of a variety of data structures, so you can choose the best data structure for your data and applications
Learn many of the algorithms commonly used to sort data, so your applications will perform efficiently when sorting large datasets
Learn how to apply graph and string algorithms to solve real-world challenges: finding shortest paths on huge maps and assembling genomes from millions of pieces.
Why this course is so special and different from any other resource available online?
This course will take you from the very beginning to very complex and advanced topics in understanding Data Structures and Algorithms!
You will get video lectures explaining concepts clearly with comprehensive visual explanations throughout the course.
You will also see Interview Questions done at the top technology companies such as Apple, Amazon, Google, and Microsoft.
I cover everything you need to know about the technical interview process!
So whether you are interested in learning the top programming language in the world in-depth and interested in learning the fundamental Algorithms, Data Structures, and performance analysis that make up the core foundational skillset of every accomplished programmer/designer or software architect and is excited to ace your next technical interview this is the course for you!
And this is what you get by signing up today:
Lifetime access to 44+ hours of HD quality videos. No monthly subscription. Learn at your own pace, whenever you want
Friendly and fast support in the course Q&A whenever you have questions or get stuck
FULL money-back guarantee for 30 days!
This course is designed to help you to achieve your career goals. Whether you are looking to get more into Data Structures and Algorithms, increase your earning potential, or just want a job with more freedom, this is the right course for you!
The topics that are covered in this course.
Section 1 – Introduction
What are Data Structures?
What is an algorithm?
Why are Data Structures And Algorithms important?
Types of Data Structures
Types of Algorithms
Section 2 – Recursion
What is Recursion?
Why do we need recursion?
How does Recursion work?
Recursive vs Iterative Solutions
When to use/avoid Recursion?
How to write Recursion in 3 steps?
How to find Fibonacci numbers using Recursion?
Section 3 – Cracking Recursion Interview Questions
Question 1 – Sum of Digits
Question 2 – Power
Question 3 – Greatest Common Divisor
Question 4 – Decimal To Binary
Section 4 – Bonus CHALLENGING Recursion Problems (Exercises)
power
factorial
products array
recursiveRange
fib
reverse
palindrome
some recursive
flatten
capitalize first
nestedEvenSum
capitalize words
stringifyNumbers
collects things
Section 5 – Big O Notation
Analogy and Time Complexity
Big O, Big Theta, and Big Omega
Time complexity examples
Space Complexity
Drop the Constants and the nondominant terms
Add vs Multiply
How to measure the codes using Big O?
How to find time complexity for Recursive calls?
How to measure Recursive Algorithms that make multiple calls?
Section 6 – Top 10 Big O Interview Questions (Amazon, Facebook, Apple, and Microsoft)
Product and Sum
Print Pairs
Print Unordered Pairs
Print Unordered Pairs 2 Arrays
Print Unordered Pairs 2 Arrays 100000 Units
Reverse
O(N) Equivalents
Factorial Complexity
Fibonacci Complexity
Powers of 2
Section 7 – Arrays
What is an Array?
Types of Array
Arrays in Memory
Create an Array
Insertion Operation
Traversal Operation
Accessing an element of Array
Searching for an element in Array
Deleting an element from Array
Time and Space complexity of One Dimensional Array
One Dimensional Array Practice
Create Two Dimensional Array
Insertion – Two Dimensional Array
Accessing an element of Two Dimensional Array
Traversal – Two Dimensional Array
Searching for an element in Two Dimensional Array
Deletion – Two Dimensional Array
Time and Space complexity of Two Dimensional Array
When to use/avoid array
Section 8 – Cracking Array Interview Questions (Amazon, Facebook, Apple, and Microsoft)
Question 1 – Missing Number
Question 2 – Pairs
Question 3 – Finding a number in an Array
Question 4 – Max product of two int
Question 5 – Is Unique
Question 6 – Permutation
Question 7 – Rotate Matrix
Section 9 – CHALLENGING Array Problems (Exercises)
Middle Function
2D Lists
Best Score
Missing Number
Duplicate Number
Pairs
Section 10 – Linked List
What is a Linked List?
Linked List vs Arrays
Types of Linked List
Linked List in the Memory
Creation of Singly Linked List
Insertion in Singly Linked List in Memory
Insertion in Singly Linked List Algorithm
Insertion Method in Singly Linked List
Traversal of Singly Linked List
Search for a value in Single Linked List
Deletion of a node from Singly Linked List
Deletion Method in Singly Linked List
Deletion of entire Singly Linked List
Time and Space Complexity of Singly Linked List
Section 11 – Circular Singly Linked List
Creation of Circular Singly Linked List
Insertion in Circular Singly Linked List
Insertion Algorithm in Circular Singly Linked List
Insertion method in Circular Singly Linked List
Traversal of Circular Singly Linked List
Searching a node in Circular Singly Linked List
Deletion of a node from Circular Singly Linked List
Deletion Algorithm in Circular Singly Linked List
A method in Circular Singly Linked List
Deletion of entire Circular Singly Linked List
Time and Space Complexity of Circular Singly Linked List
Section 12 – Doubly Linked List
Creation of Doubly Linked List
Insertion in Doubly Linked List
Insertion Algorithm in Doubly Linked List
Insertion Method in Doubly Linked List
Traversal of Doubly Linked List
Reverse Traversal of Doubly Linked List
Searching for a node in Doubly Linked List
Deletion of a node in Doubly Linked List
Deletion Algorithm in Doubly Linked List
Deletion Method in Doubly Linked List
Deletion of entire Doubly Linked List
Time and Space Complexity of Doubly Linked List
Section 13 – Circular Doubly Linked List
Creation of Circular Doubly Linked List
Insertion in Circular Doubly Linked List
Insertion Algorithm in Circular Doubly Linked List
Insertion Method in Circular Doubly Linked List
Traversal of Circular Doubly Linked List
Reverse Traversal of Circular Doubly Linked List
Search for a node in Circular Doubly Linked List
Delete a node from Circular Doubly Linked List
Deletion Algorithm in Circular Doubly Linked List
Deletion Method in Circular Doubly Linked List
Entire Circular Doubly Linked List
Time and Space Complexity of Circular Doubly Linked List
Time Complexity of Linked List vs Arrays
Section 14 – Cracking Linked List Interview Questions (Amazon, Facebook, Apple, and Microsoft)
Linked List Class
Question 1 – Remove Dups
Question 2 – Return Kth to Last
Question 3 – Partition
Question 4 – Sum Linked Lists
Question 5 – Intersection
Section 15 – Stack
What is a Stack?
What and Why of Stack?
Stack Operations
Stack using Array vs Linked List
Stack Operations using Array (Create, isEmpty, isFull)
Stack Operations using Array (Push, Pop, Peek, Delete)
Time and Space Complexity of Stack using Array
Stack Operations using Linked List
Stack methods – Push, Pop, Peek, Delete, and isEmpty using Linked List
Time and Space Complexity of Stack using Linked List
When to Use/Avoid Stack
Stack Quiz
Section 16 – Queue
What is a Queue?
Linear Queue Operations using Array
Create, isFull, isEmpty, and enQueue methods using Linear Queue Array
Dequeue, Peek and Delete Methods using Linear Queue Array
Time and Space Complexity of Linear Queue using Array
Why Circular Queue?
Circular Queue Operations using Array
Create, Enqueue, isFull and isEmpty Methods in Circular Queue using Array
Dequeue, Peek and Delete Methods in Circular Queue using Array
Time and Space Complexity of Circular Queue using Array
Queue Operations using Linked List
Create, Enqueue and isEmpty Methods in Queue using Linked List
Dequeue, Peek and Delete Methods in Queue using Linked List
Time and Space Complexity of Queue using Linked List
Array vs Linked List Implementation
When to Use/Avoid Queue?
Section 17 – Cracking Stack and Queue Interview Questions (Amazon, Facebook, Apple, Microsoft)
Question 1 – Three in One
Question 2 – Stack Minimum
Question 3 – Stack of Plates
Question 4 – Queue via Stacks
Question 5 – Animal Shelter
Section 18 – Tree / Binary Tree
What is a Tree?
Why Tree?
Tree Terminology
How to create a basic tree in Java?
Binary Tree
Types of Binary Tree
Binary Tree Representation
Create Binary Tree (Linked List)
PreOrder Traversal Binary Tree (Linked List)
InOrder Traversal Binary Tree (Linked List)
PostOrder Traversal Binary Tree (Linked List)
LevelOrder Traversal Binary Tree (Linked List)
Searching for a node in Binary Tree (Linked List)
Inserting a node in Binary Tree (Linked List)
Delete a node from Binary Tree (Linked List)
Delete entire Binary Tree (Linked List)
Create Binary Tree (Array)
Insert a value Binary Tree (Array)
Search for a node in Binary Tree (Array)
PreOrder Traversal Binary Tree (Array)
InOrder Traversal Binary Tree (Array)
PostOrder Traversal Binary Tree (Array)
Level Order Traversal Binary Tree (Array)
Delete a node from Binary Tree (Array)
Entire Binary Tree (Array)
Linked List vs Python List Binary Tree
Section 19 – Binary Search Tree
What is a Binary Search Tree? Why do we need it?
Create a Binary Search Tree
Insert a node to BST
Traverse BST
Search in BST
Delete a node from BST
Delete entire BST
Time and Space complexity of BST
Section 20 – AVL Tree
What is an AVL Tree?
Why AVL Tree?
Common Operations on AVL Trees
Insert a node in AVL (Left Left Condition)
Insert a node in AVL (Left-Right Condition)
Insert a node in AVL (Right Right Condition)
Insert a node in AVL (Right Left Condition)
Insert a node in AVL (all together)
Insert a node in AVL (method)
Delete a node from AVL (LL, LR, RR, RL)
Delete a node from AVL (all together)
Delete a node from AVL (method)
Delete entire AVL
Time and Space complexity of AVL Tree
Section 21 – Binary Heap
What is Binary Heap? Why do we need it?
Common operations (Creation, Peek, sizeofheap) on Binary Heap
Insert a node in Binary Heap
Extract a node from Binary Heap
Delete entire Binary Heap
Time and space complexity of Binary Heap
Section 22 – Trie
What is a Trie? Why do we need it?
Common Operations on Trie (Creation)
Insert a string in Trie
Search for a string in Trie
Delete a string from Trie
Practical use of Trie
Section 23 – Hashing
What is Hashing? Why do we need it?
Hashing Terminology
Hash Functions
Types of Collision Resolution Techniques
Hash Table is Full
Pros and Cons of Resolution Techniques
Practical Use of Hashing
Hashing vs Other Data structures
Section 24 – Sort Algorithms
What is Sorting?
Types of Sorting
Sorting Terminologies
Bubble Sort
Selection Sort
Insertion Sort
Bucket Sort
Merge Sort
Quick Sort
Heap Sort
Comparison of Sorting Algorithms
Section 25 – Searching Algorithms
Introduction to Searching Algorithms
Linear Search
Linear Search in Python
Binary Search
Binary Search in Python
Time Complexity of Binary Search
Section 26 – Graph Algorithms
What is a Graph? Why Graph?
Graph Terminology
Types of Graph
Graph Representation
The graph in Java using Adjacency Matrix
The graph in Java using Adjacency List
Section 27 – Graph Traversal
Breadth-First Search Algorithm (BFS)
Breadth-First Search Algorithm (BFS) in Java – Adjacency Matrix
Breadth-First Search Algorithm (BFS) in Java – Adjacency List
Time Complexity of Breadth-First Search (BFS) Algorithm
Depth First Search (DFS) Algorithm
Depth First Search (DFS) Algorithm in Java – Adjacency List
Depth First Search (DFS) Algorithm in Java – Adjacency Matrix
Time Complexity of Depth First Search (DFS) Algorithm
BFS Traversal vs DFS Traversal
Section 28 – Topological Sort
What is Topological Sort?
Topological Sort Algorithm
Topological Sort using Adjacency List
Topological Sort using Adjacency Matrix
Time and Space Complexity of Topological Sort
Section 29 – Single Source Shortest Path Problem
what is Single Source Shortest Path Problem?
Breadth-First Search (BFS) for Single Source Shortest Path Problem (SSSPP)
BFS for SSSPP in Java using Adjacency List
BFS for SSSPP in Java using Adjacency Matrix
Time and Space Complexity of BFS for SSSPP
Why does BFS not work with Weighted Graph?
Why does DFS not work for SSSP?
Section 30 – Dijkstra’s Algorithm
Dijkstra’s Algorithm for SSSPP
Dijkstra’s Algorithm in Java – 1
Dijkstra’s Algorithm in Java – 2
Dijkstra’s Algorithm with Negative Cycle
Section 31 – Bellman-Ford Algorithm
Bellman-Ford Algorithm
Bellman-Ford Algorithm with negative cycle
Why does Bellman-Ford run V-1 times?
Bellman-Ford in Python
BFS vs Dijkstra vs Bellman Ford
Section 32 – All Pairs Shortest Path Problem
All pairs shortest path problem
Dry run for All pair shortest path
Section 33 – Floyd Warshall
Floyd Warshall Algorithm
Why Floyd Warshall?
Floyd Warshall with negative cycle,
Floyd Warshall in Java,
BFS vs Dijkstra vs Bellman Ford vs Floyd Warshall,
Section 34 – Minimum Spanning Tree
Minimum Spanning Tree,
Disjoint Set,
Disjoint Set in Java,
Section 35 – Kruskal’s and Prim’s Algorithms
Kruskal Algorithm,
Kruskal Algorithm in Python,
Prim’s Algorithm,
Prim’s Algorithm in Python,
Prim’s vs Kruskal
Section 36 – Cracking Graph and Tree Interview Questions (Amazon, Facebook, Apple, Microsoft)
Section 37 – Greedy Algorithms
What is a Greedy Algorithm?
Well known Greedy Algorithms
Activity Selection Problem
Activity Selection Problem in Python
Coin Change Problem
Coin Change Problem in Python
Fractional Knapsack Problem
Fractional Knapsack Problem in Python
Section 38 – Divide and Conquer Algorithms
What is a Divide and Conquer Algorithm?
Common Divide and Conquer algorithms
How to solve the Fibonacci series using the Divide and Conquer approach?
Number Factor
Number Factor in Java
House Robber
House Robber Problem in Java
Convert one string to another
Convert One String to another in Java
Zero One Knapsack problem
Zero One Knapsack problem in Java
Longest Common Sequence Problem
Longest Common Subsequence in Java
Longest Palindromic Subsequence Problem
Longest Palindromic Subsequence in Java
Minimum cost to reach the Last cell problem
Minimum Cost to reach the Last Cell in 2D array using Java
Number of Ways to reach the Last Cell with given Cost
Number of Ways to reach the Last Cell with given Cost in Java
Section 39 – Dynamic Programming
What is Dynamic Programming? (Overlapping property)
Where does the name of DC come from?
Top-Down with Memoization
Bottom-Up with Tabulation
Top-Down vs Bottom Up
Is Merge Sort Dynamic Programming?
Number Factor Problem using Dynamic Programming
Number Factor: Top-Down and Bottom-Up
House Robber Problem using Dynamic Programming
House Robber: Top-Down and Bottom-Up
Convert one string to another using Dynamic Programming
Convert String using Bottom Up
Zero One Knapsack using Dynamic Programming
Zero One Knapsack – Top Down
Zero One Knapsack – Bottom Up
Section 40 – CHALLENGING Dynamic Programming Problems
Longest repeated Subsequence Length problem
Longest Common Subsequence Length problem
Longest Common Subsequence problem
Diff Utility
Shortest Common Subsequence problem
Length of Longest Palindromic Subsequence
Subset Sum Problem
Egg Dropping Puzzle
Maximum Length Chain of Pairs
Section 41 – A Recipe for Problem Solving
Introduction
Step 1 – Understand the problem
Step 2 – Examples
Step 3 – Break it Down
Step 4 – Solve or Simplify
Step 5 – Look Back and Refactor
Section 41 – Wild West
Download
To download more paid courses for free visit course catalog where 1000+ paid courses available for free. You can get the full course into your device with just a single click. Follow the link above to download this course for free.
3 notes
·
View notes
Text
Neil's Great Obsession with Graph Theory
·Neil lives for graph theory
·It's his 3rd favourite thing ever after the obvious
·Because essentially it's just dots and lines that he can just??? Make stories out of???
·Literally making points and drawing lines and making a sort of story out of this
·It's his wet dream
·He got into it when he was on the run because he had to remember who was who and who did what with whom for this dude and all
·So when he got to high school and did advanced maths and the elective was matrices and graph theory?
·You know he went ballistic
·At first it was just something interesting that filled the hole exy left behind
·And it was useful for calculating the shortest path to places excluding main roads when he had to collect stuff from his connections
·Until his teacher mentioned how complex the matrix for game of thrones would have been when A Feast for Crows came out in Neil's final year
·He's never read the books before but he bets it can't beat the yakuza
·So he starts with his first graph
·It's really simple at first when he just does Nathan's people and the Moriyama's
·Then he starts adding his mom's family
·And the runners
·And the people they they bought in the police
·And Easthaven
·And everything else
·It's colour coded and looks so pretty that he puts it in his binder
·Post-Baltimore when he explains his ties to the mafia he shows the foxes his graph
·Matt: You've read A Song of Ice and Fire?
·Neil: What the f*ck is that
·Nicky: You mean that's maths? Where are the numbers and plus signs?
·Kevin: No this is the mafia
·Allison: This is Neil?
·Dan: *struggling to understand how the rest are in college*
·Andrew: *secretly revelling in the chaos*
·Aaron: Is tired
·Anyway
·Neil gets a phd in graph theory
·Sometime during his pro career he stars watching Game of Thrones
·And he finally makes that graph
·And frames it next to his first one
·They have tiny plaques underneath that read before and after
·Because the first graph was for survival
·But the last one is a reminder that he's free
#matt boyd#kevin day#nicky hemmick#neil josten#aaron minyard#andrew minyard#allison reynolds#renee walker#dan wilds#graph theory#network graphs#got references#i've never seen an episode in my life#he also makes one of the foxes and their children and cats#it's more of a family tree but he has a permit saying he can do what he wants#neil does computer science just to be an internet gremlin#he can't badmouth people as much because of defamation of character#so he just changes all the algorithms in between practices#and gets a particularly nosy reporter fired#but they don't know it's him so he's satisfied
8 notes
·
View notes
Text
8 Beginner Video Tips For Making Professional-looking Videos That Nobody is Talking About
The smart Trick of 8 Beginner Video Tips For Making Professional-looking Videos That Nobody is Talking About
Table of Contents
Starting An Online Business: The Ultimate Guide For 2020 for Dummies
Not known Facts About How To Start A Youtube Channel And Make Money ... - Fotor
How To Make Money Blogging In 2021 ($203k In Year One) - Questions
The Main Principles Of How To Monetize Your Blog: 7 Case Studies For Newbie ...
youtube
It can be a daunting enough task thinking of—much less selling— information products online. That was, until you found this post. Today, I’m going to break down what information products are, give you real-life examples of best selling ideas (you can realistically start) and guide you from idea to income.
1
Imagine all business product types on a matrix similar to MakeMoneyOnline.tv. You could do a physical product. Or build software. Or run a service business. When it comes to building an online business there are essentially six paths you can take. Every has different costs and earning potentials. Here, let’s graph them out: The businesses that fall in the upper-right part are commonly called .
2
g., e-books and online courses). They’re in the area where there’s: Low cost (i. e., doesn’t cost you a lot of money to make) High earning potential (i. e., makes you a LOT of money) The best part is you can create products relatively quickly (depending on which information product ideas you choose) AND those products generate passive income.
3
Not all information product ideas are made equal though. What works for one business might not work very well for you at all. That’s why I want to break down your options for information product ideas, give you a few good places to start, and take a look at examples of information products that have helped people grow their business.
4

The 5-Second Trick For How To Start An Ecommerce Business (A Complete Blueprint)
Chances are you’ve purchased an information product already and used them in your everyday life. Not all information products are digital either. Information products can exist in the form of DVDs, CDs, traditional books, and even services like coaching or consulting. However, it’s when you create a digital information product (i.
5
We’re going to pretend we’re running a new business. It’s a fitness website catered towards twenty-something content marketers called “Muscle Up.” Yeah, it’s a crappy name — but we’re playing pretend remember? As the founder of Muscle Up, you’ve built a solid list of subscribers and have been churning out helpful blog posts for a while.
6
Let’s take a look at a few different options that are perfect for you as the founder of Muscle Up and beginner entrepreneur who wants to create their first information product. For each product, I’ll give you the price you can sell one unit for and the time it takes to produce the product.
7
: $10 – $50 per book 2 – 8 weeks E-books are those things that you keep downloading but never get around to reading. Luckily, plenty of other people are willing to pay you money to gain your valuable muscle-building knowledge. They’re deceptively simple to make too. Since you’ve been frequently blogging and providing valuable content to your readers already on Muscle Up’s website, you can use those exact same blog posts and compile them into one awesome resource for your readers.

8
35 Fatal Ecommerce Mistakes We See People Make (Yes ... Fundamentals Explained
A few great examples: . Travel expert Nomadic Matt dishes out knowledge for any wannabe budget travelers out there. $5. 99 . Learn how to create awesome songs with this e-book. $17 . A no-nonsense guide to building an online business. By us. $7. 99 . Take a deep dive into the world of travel hacking with this guide available in Money Gravity.
9
95 . Television producer Paula Rizzo shows you how to be more productive and get more done through the art of list making. $9. 99 So now you have Muscle Up’s first e-book, “Every Day is Leg Day: How to Scare People When You Wear Shorts.” Now you want to be able to engage a bit more with your community while making money.
10
: $200 – $1,000+ per hour 1 – 3 hours per session Coaching is one of the fastest information product ideas to get started with. This is when you offer one-on-one guidance and teaching to a client in your area of expertise. And they’re awesome for a few reasons: Many customers / clients are willing to pay premium prices for coaching.
11
You can meet with customers in person, with video conferencing (Skype, Google Hangouts, etc.), or even over the phone. This flexibility allows you to cater to customers all over the world — improving your chances of getting clients. You get to effectively conduct customer research with coaching. You can tap into their fears, goals, and vulnerabilities by interacting with your clients through one-on-one coaching.
12
Not known Factual Statements About How To Sell On Shopify - A Definitive Beginner's Guide ...
There are a few downsides to coaching though. You need to be more involved in order to make money since you’re offering a one-on-one service. That means a lot of continuous work and sweat equity in order to make money. You are literally selling your time for money, and that has a natural limit.
13
1 note
·
View note