#query performance
Explore tagged Tumblr posts
Text
Optimizing SQL Server Index Size: When to Start Adding Indexes
Introduction Hey there, fellow SQL Server enthusiast! Have you ever found yourself wondering, “When should I start adding indexes to my tables?” Well, you’re not alone. As someone who’s spent countless hours optimizing databases, I’ve learned that the answer isn’t always straightforward. But fear not! In this article, we’ll dive into the fascinating world of SQL Server index size and explore…

View On WordPress
0 notes
Note
basil 🥺👉👈
basil: can we run away into the woods together (please)
!!!! yes yes yes absolutely yes!! you're such a delight, fin; i'd love to abscond with you <3
#ask game#quil's queries#fintan-pyren#we are like kindred flames in my head#mirrored reflections#partners in a dance we can perform with our eyes closed
3 notes
·
View notes
Text
#playchoices#america's most eligible#choices ame#this legit has me thinking hard because of course I'd never be on that show but if I WERE how would I DO???#I think I could put forth a respectable performance 🤔#I'm not winning my fellow contestants over but I'd stay afloat by virtue of killing it on the challenges solely cause I'm hella competitive#to be clear though I don't think I'd be among the last to get eliminated. probably somewhere in the middle#like on personality they would've wanted me gone sooner but I did well enough in the challenges that I wasnt up for elimination for a while#of course like I said realistically I wouldn't even be there but that's not what the poll is the premise already means I'm competing so.#unconquered queries
22 notes
·
View notes
Note
🔥 + stephcass
I don’t actually think it’d be good if they became canon right now. Both characters still have so much to recover from new 52-wise and making them lgbt could honestly maybe really fuck up the relatively good traction there’s been the last year or two for them (kind of. Cass is being featured in more stuff and spirit world has been excellent so far! tho unfortunately Steph still has a ways to go).
#like yeah it’s not great but there are still a ton of comic guys who get really mad about representation in comics#and considering cass and steph are already both women (+ not white in cass’ case) I’d rather they’re not even less appealing to a group#that unfortunately are a good chunk of people who buy comics#and ultimately everything comes down to how well characters sell#i feel bad saying this but I’d rather cass be straight and still appearing in comics#and yeah it’s not a garantee that it’d fuck up their sales but. td:r’s performance makes me nervous#<- there are a million more concessions I should make here but I’m just going to hope no one severely misinterprets what I’m saying#thanks for the ask!#queries
6 notes
·
View notes
Text
How to Optimize ColdFusion Queries for Better Database Performance
#How to Optimize ColdFusion Queries for Better Database Performance#Optimize ColdFusion Queries for Better Database Performance
0 notes
Text
New: Search operators for better searching!
We hear you, and we share your frustrations: it’s hard to find a specific post. You know it has a particular tag or phrase, and it was posted on this date, or at least, within a specific year. But you can't find it!
So, today, we’re excited to announce that you can use ✨ advanced search operators ✨ in the search bar now! You can now say potato from:staff year:2021 to easily enjoy that video of a potato being microwaved again.
Before we jump into the details, a couple of caveats to note:
These search operators are only available in the main Tumblr search bar. They don’t work in the search bar in individual blogs.
The search operators only work on posts created in 2017 or later.
OK! Let’s go explore these operators!
Exact phrase match
When you surround your query with regular double quotes (not curly quotes), it will match posts with that exact phrase in the post's text content, or that exact phrase as a tag.
For example, "chappell roan is roan of arc" matches posts with that exact phrase in the content, and also matches posts that have the exact tag #chappell roan is roan of arc.

Match operator
By default, the query matches the post on either the text or the tags.
You can use match:text to specify you want to search the post content, or match:tags to search the post tags. For example:
sword world match:text looks for posts with the words "sword" and "world" in the post content.
sword world match:tags looks for posts with the words "sword" and "world" in the post tags.

From operator
Use from:blog or from:@blog to find only posts by a particular blog.
For example, halloween from:staff finds all posts by @staff that has the word "halloween" in the post content or tags.

Year operator
Use year:YYYY to find posts from a particular year.
For example, halloween year:2019 finds all posts from 2019 that has the word "halloween" in the post content or tags.

Date operator
Use date:YYYY-MM-DD to find posts from a particular date.
For example, halloween date:2019-10-08 finds all posts created on October 8, 2019 that has the word "halloween" in the post content or tags.

All together
You can combine all the tools above to form even more specific queries:
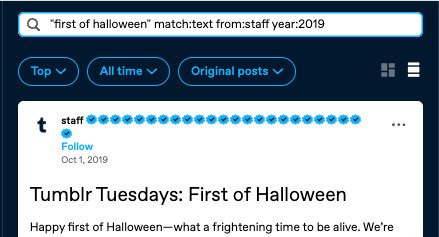
Congrats! You’re now a Tumblr search wizard! 🪄
Other syntax
As a reminder, you can already search by a tag, or by multiple tags:
Prefixing your query with # performs a tag search — that is, it will find posts with that exact tag. For example, #star wars will only return posts with the #star wars tag.
You can search for multiple tags at at time. For example, #star wars #art will find posts that are tagged with both the tag #star wars and the tag #art.
You can combine this with the new operators to find what you are looking for!
A guide on how to use the new operators has also been added to our Search and Filtering Basics Guide.
Tumblr Patio support
The enhanced syntax makes Tumblr Patio even more powerful. You can now open multiple search columns each with different fine-tuned queries that use the syntax above to get you customized feeds.
Feedback
We’d love to hear what you think! Please share your feedback in the replies and reblogs of this post, or by reaching out to Tumblr Support.
20K notes
·
View notes
Text

How to Balance Fixing Performance Issues and Adding New Features in Web Applications?
In today’s digital landscape, web applications are essential for business operations, marketing, and consumer involvement. As organizations expand and consumer expectations rise, development teams are frequently confronted with the difficult task of balancing two key priorities: addressing performance issues and introducing new features.
While boosting performance improves the user experience and increases efficiency, new features are required to remain competitive and meet market demands. Prioritizing one over the other, on the other hand, might have negative consequences—performance concerns can lead to a poor user experience while failing to innovate can result in a competitive disadvantage.
This blog delves into how to balance improving performance and introducing new features to web apps, allowing firms to satisfy technical and market demands efficiently.
Why Balancing Performance and New Features Is Crucial
A web application‘s success depends on both its performance and its features. However, relying entirely on one might result in imbalances that impair both user happiness and business progress.
Performance:Performance is an important component that directly influences user retention and happiness. Users can become frustrated and leave if the application has slow loading times, crashes, or problems. Ensuring that your web application runs smoothly is essential since 53% of mobile consumers would quit a site that takes more than three seconds to load.
New Features:On the other hand, constantly adding new features keeps users interested and promotes your company as innovative. New features generate growth by attracting new consumers and retaining existing ones who want to experience the most recent changes.
The dilemma is deciding when to prioritize bug fixes over new feature development. A poor balance can harm both performance and innovation, resulting in a subpar user experience and stagnation.
Common Performance Issues in Web Applications
Before balancing performance and features, it’s important to understand the common performance issues that web applications face:
Slow Load Times: Slow pages lead to higher bounce rates and lost revenue.
Server Downtime: Frequent server outages impact accessibility and trust.
Poor Mobile Optimization: A significant portion of web traffic comes from mobile devices and apps that aren’t optimized for mobile fail to reach their potential.
Security Vulnerabilities: Data breaches and security flaws harm credibility and user trust.
Bugs and Glitches: Software bugs lead to poor user experiences, especially if they cause the app to crash or become unresponsive.
Strategic Approaches to Fixing Performance Issues
When performance issues develop, they must be handled immediately to guarantee that the online application functions properly. Here are techniques for improving performance without delaying new feature development:
Prioritize Critical Issues:Tackle performance issues that have the most significant impact first, such as slow loading times or security vulnerabilities. Use analytics to identify bottlenecks and determine which areas require urgent attention.
Use a Continuous Improvement Process:Continuously monitor and optimize the application’s performance. With tools like Google PageSpeed Insights, you can track performance metrics and make incremental improvements without major overhauls.
Optimize Database Queries:Slow database queries are one of the leading causes of web app performance issues. Optimize queries and ensure that the database is indexed properly for faster access and retrieval of data.
Reduce HTTP Requests:The more requests a page makes to the server, the slower it loads. Minimize requests by reducing file sizes, combining CSS and JavaScript files, and utilizing caching.
5. Leverage Caching and CDNs: Use caching strategies and Content Delivery Networks (CDNs) to deliver content quickly to users by storing files in multiple locations globally.
Why Adding New Features is Essential for Growth
In the rapidly changing digital environment, businesses must continually innovate to stay relevant. Adding new features is key to maintaining a competitive edge and enhancing user engagement. Here’s why:
User Expectations:Today’s consumers expect personalized experiences and constant innovation. Failure to add new features can lead to customer churn, as users may feel your web application no longer meets their needs.
Market Differentiation:Introducing new features allows your application to stand out in the marketplace. Unique functionalities can set your app apart from competitors, attracting new users and increasing customer loyalty.
Increased Revenue Opportunities:New features can lead to additional revenue streams. For example, adding premium features or new integrations can boost the app’s value and lead to increased sales or subscription rates.
4. Feedback-Driven Innovation: New features are often driven by user feedback. By continuously developing and adding features, you create a feedback loop that improves the overall user experience and fosters customer satisfaction.
Read More: https://8techlabs.com/how-to-balance-fixing-performance-issues-and-adding-new-features-in-web-applications-to-meet-market-demands-and-enhance-user-experience/
#8 Tech Labs#custom software development#custom software development agency#custom software development company#software development company#mobile app development software#bespoke software development company#bespoke software development#nearshore development#software development services#software development#Website performance testing tools#Speed optimization for web apps#Mobile-first web app optimization#Code minification and lazy loading#Database indexing and query optimization#Agile vs Waterfall in feature development#Feature flagging in web development#CI/CD pipelines for web applications#API performance optimization#Serverless computing for better performance#Core Web Vitals optimization techniques#First Contentful Paint (FCP) improvement#Reducing Time to First Byte (TTFB)#Impact of site speed on conversion rates#How to reduce JavaScript execution time#Web application performance optimization#Fixing performance issues in web apps#Web app performance vs new features#Website speed optimization for better UX
0 notes
Text


#CaseStudy Simple Logic seamlessly migrated Informix data to PostgreSQL 14, enabling automatic failover and optimized performance for unmatched reliability! 🚀
Challenges: Migrating critical data without errors 🗂️ Ensuring near-zero downtime with automatic failover 🚦 Optimizing server performance for specific workloads 📊
Solution: Migrated Informix data seamlessly ✔️ Deployed pg_auto_failover for high availability 🌐 Fine-tuned server parameters for peak efficiency ⚙️
The Results: Increased system reliability and uptime 24/7/365 🕒 Enhanced database performance, reducing query time significantly ⚡ Future-ready infrastructure for business scalability 📈
Achieve seamless migrations and superior database performance with Simple Logic's expertise! 💼✨
#MySql#PostgreSQL#DatabaseMigration#ITSupport#SimpleLogicIT#MakingITSimple#Reliability#Migration#Failure#Database#DatabasePerformance#Performance#Errors#DatabaseService#Query#Downtime#MakeITSimple#SimpleLogic
0 notes
Text
How To Compare Search Queries In Google Search Console ||Google Search Console ||Digital Magnate
Hey everyone, welcome to my channel. In today's video, I'm going to show you how to compare search queries in Google Search Console. This is a great way to see what people are searching for when they find your website, and it can help you improve your SEO strategy. 𝗞𝗶𝗻𝗱𝗹𝘆 𝘀𝘂𝗯𝘀𝗰𝗿𝗶𝗯𝗲 𝘁𝗼 𝗼𝘂𝗿 𝗰𝗵𝗮𝗻𝗻𝗲𝗹 𝗳𝗼𝗿 𝗺𝗼𝗿𝗲 𝘃𝗶𝗱𝗲𝗼𝘀 Click here ➜https://www.youtube.com/c/Digitalmagnate/videos?sub_confirmation=1
Let’s get started!"Step 1: Open Google Search Console First, you need to open Google Search Console. If you don't have an account, you can create one for free.
Step 2: Click on the "Search Queries" report Once you're logged in, click on the "Search Queries" report in the left-hand menu.
Step 3: Select the date range you want to compare Next, select the date range you want to compare. You can compare any two date ranges, as long as they're within the past 90 days.
Step 4: Click on the "Compare" button Once you've selected your date range, click on the "Compare" button.
Step 5: Analyze the results Now, you'll be able to see a comparison of the search queries that people used to find your website in the two date ranges you selected. Conclusion That's how you compare search queries in Google Search Console. I hope this video was helpful. If you have any questions, please leave them in the comments below. Happy Google Search Console, and see you next time!"
youtube
Follow us on Social Media. Thanks for Here...
Facebook: - https://www.facebook.com/Magnatedigital
Blog: - https://digitalmagnate.blogspot.com/
Instagram: - https://www.instagram.com/digimagnate/
YouTube: - https://www.youtube.com/c/Digitalmagnate/videos?sub_confirmation=1
𝗞𝗶𝗻𝗱𝗹𝘆 𝘀𝘂𝗯𝘀𝗰𝗿𝗶𝗯𝗲 𝘁𝗼 𝗼𝘂𝗿 𝗰𝗵𝗮𝗻𝗻𝗲𝗹 𝗳𝗼𝗿 𝗺𝗼𝗿𝗲 𝘃𝗶𝗱𝗲𝗼𝘀 Click here ➜https://www.youtube.com/c/Digitalmagnate/videos?sub_confirmation=1
More Video link:- How to See Copy and Paste History:-https://youtu.be/G9fSyYbMmPU How to install fb chat in website: - https://youtu.be/BV0NxcIsA5g? How to delete YouTube search history: - https://youtu.be/u-5dppiUeRI How To Set Auto on-off function in android:-https://youtu.be/AbepiglSCbM How to solve timeout error in google chrome: - https://youtu.be/MSHCSFxMw4Q Social media link in google: - https://youtu.be/yrkxLuwerEE How to Use AI for SEO in 2024: - https://youtu.be/CHqRV_aKR4Q?si=wZZ99i6Yv0mRzqcs
Read 𝗼𝘂𝗿 𝗼𝘁𝗵𝗲𝗿 Blogs Visit➜ https://digitalmagnate.blogspot.com You Are Free to Ask the Questions by Commenting. Want your own website? E-mail us your requirements to [email protected]
Visit:- https://digital-magnate.com/
#Google Search Console#google search console queries#compare filter Google Search Console#compare filter in GSC#Queries compare filter in GSC#Queries compare Google Search Console#Search query comparison#Search performance report#Query filter options#Query comparison#Query data analysis#Search query insights#CTR (Click-Through Rate) comparison#Impressions comparison#Click comparison#Search query trends#Keyword analysis#Youtube
1 note
·
View note
Text
The Role of Onsite Search Analytics in Enhancing eCommerce Performance
After setting up your eCommerce store, you engaged the best search engine optimization (SEO) agency you could find. The specialist audited your company’s website and recommended the most effective SEO strategies to improve its online visibility and minimize expenses on other digital marketing methods. Now, it sounds like the perfect time to relax and wait for your recently launched eCommerce…
#conversion rate optimization#data insights#ecommerce performance#enhancing#online store analytics#onsite search analytics#search queries#user behavior analysis#website search
0 notes
Text
Mastering Advanced Querying with Django ORM: A Comprehensive Guide
Advanced Querying with Django ORM: Techniques for Efficient Database Access
Introduction:The Django ORM (Object-Relational Mapping) is one of the most powerful features of the Django web framework. It allows developers to interact with databases using Python code instead of writing raw SQL queries. While basic querying with Django ORM is straightforward, mastering advanced querying techniques can significantly optimize your application’s performance and add powerful…
#Advanced Querying#Annotations#database optimization#Django ORM#Django Performance#Prefetch Related#Python#Subqueries
0 notes
Text
Is It Worth Updating Stats More Frequently?
Learn when it makes sense to update statistics more often than the default for busy tables in SQL Server to improve query performance.
Introduction Hey there! If you manage busy SQL Server databases, you’ve probably wondered at some point – is it worth tinkering with the statistics auto-update settings for those really high activity tables? Will sampling the data more frequently actually lead to better query plans and performance? As someone who’s experimented with this myself, I’m happy to share my experiences and insights. By…

View On WordPress
0 notes
Note
Fintan used to have massive badonkadonks, but he got top surgery and had them grafted onto his rear end to make up for his formerly flat ass
fascinating contribution to this discussion. what I'm hearing is that Fintan's got nipples on his "ass."
#kotlc#asscourse#fintan pyren#quil's queries#nonsie#kinda nsft#lot of questions on this one. not necessarily for you just in general#who performed the surgery for one#is this elf tech. or did he go to the human world for this one#how was the tissue transfered#how does it rest#lot going on here
9 notes
·
View notes
Text
Creating an Effective Power BI Dashboard: A Comprehensive Guide

Introduction to Power BI Power BI is a suite of business analytics tools that allows you to connect to multiple data sources, transform data into actionable insights, and share those insights across your organization. With Power BI, you can create interactive dashboards and reports that provide a 360-degree view of your business.
Step-by-Step Guide to Creating a Power BI Dashboard
1. Data Import and Transformation The first step in creating a Power BI dashboard is importing your data. Power BI supports various data sources, including Excel, SQL Server, Azure, and more.
Steps to Import Data:
Open Power BI Desktop.
Click on Get Data in the Home ribbon.
Select your data source (e.g., Excel, SQL Server, etc.).
Load the data into Power BI.
Once the data is loaded, you may need to transform it to suit your reporting needs. Power BI provides Power Query Editor for data transformation.
Data Transformation:
Open Power Query Editor.
Apply necessary transformations such as filtering rows, adding columns, merging tables, etc.
Close and apply the changes.
2. Designing the Dashboard After preparing your data, the next step is to design your dashboard. Start by adding a new report and selecting the type of visualization you want to use.
Types of Visualizations:
Charts: Bar, Line, Pie, Area, etc.
Tables and Matrices: For detailed data representation.
Maps: Geographic data visualization.
Cards and Gauges: For key metrics and KPIs.
Slicers: For interactive data filtering.
Adding Visualizations:
Drag and drop fields from the Fields pane to the canvas.
Choose the appropriate visualization type from the Visualizations pane.
Customize the visual by adjusting properties such as colors, labels, and titles.
3. Enhancing the Dashboard with Interactivity Interactivity is one of the key features of Power BI dashboards. You can add slicers, drill-throughs, and bookmarks to make your dashboard more interactive and user-friendly.
Using Slicers:
Add a slicer visual to the canvas.
Drag a field to the slicer to allow users to filter data dynamically.
Drill-throughs:
Enable drill-through on visuals to allow users to navigate to detailed reports.
Set up drill-through pages by defining the fields that will trigger the drill-through.
Bookmarks:
Create bookmarks to capture the state of a report page.
Use bookmarks to toggle between different views of the data.
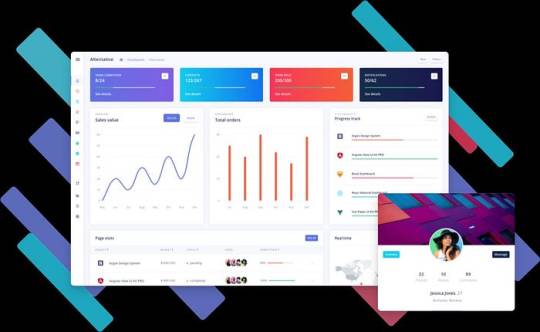
Different Styles of Power BI Dashboards Power BI dashboards can be styled to meet various business needs. Here are a few examples:
1. Executive Dashboard An executive dashboard provides a high-level overview of key business metrics. It typically includes:
KPI visuals for critical metrics.
Line charts for trend analysis.
Bar charts for categorical comparison.
Maps for geographic insights.
Example:
KPI cards for revenue, profit margin, and customer satisfaction.
A line chart showing monthly sales trends.
A bar chart comparing sales by region.
A map highlighting sales distribution across different states.
2. Sales Performance Dashboard A sales performance dashboard focuses on sales data, providing insights into sales trends, product performance, and sales team effectiveness.
Example:
A funnel chart showing the sales pipeline stages.
A bar chart displaying sales by product category.
A scatter plot highlighting the performance of sales representatives.
A table showing detailed sales transactions.
3. Financial Dashboard A financial dashboard offers a comprehensive view of the financial health of an organization. It includes:
Financial KPIs such as revenue, expenses, and profit.
Financial statements like income statement and balance sheet.
Trend charts for revenue and expenses.
Pie charts for expense distribution.
Example:
KPI cards for net income, operating expenses, and gross margin.
A line chart showing monthly revenue and expense trends.
A pie chart illustrating the breakdown of expenses.
A matrix displaying the income statement.
Best Practices for Designing Power BI Dashboards To ensure your Power BI dashboard is effective and user-friendly, follow these best practices:
Keep it Simple:
Avoid cluttering the dashboard with too many visuals.
Focus on the most important metrics and insights.
2. Use Consistent Design:
Maintain a consistent color scheme and font style.
Align visuals properly for a clean layout.
3. Ensure Data Accuracy:
Validate your data to ensure accuracy.
Regularly update the data to reflect the latest information.
4. Enhance Interactivity:
Use slicers and drill-throughs to provide a dynamic user experience.
Add tooltips to provide additional context.
5. Optimize Performance:
Use aggregations and data reduction techniques to improve performance.
Avoid using too many complex calculations.
Conclusion Creating a Power BI dashboard involves importing and transforming data, designing interactive visuals, and applying best practices to ensure clarity and effectiveness. By following the steps outlined in this guide, you can build dashboards that provide valuable insights and support data-driven decision-making in your organization. Power BI’s flexibility and range of visualizations make it an essential tool for any business looking to leverage its data effectively.
#Dynamic Data Visualization#Business Analytics#Interactive Dashboards#Data Insights#Data Transformation#KPI Metrics#Real-time Reporting#Data Connectivity#Trend Analysis#Visual Analytics#Performance Metrics#Data Modeling#Executive Dashboards#Sales Performance#Financial Reporting#Data Interactivity#Data-driven Decisions#Power Query#Custom Visuals#Data Integration
0 notes
Text
ColdFusion Database Pooling and Query Caching: Optimizing Performance for Scalable Applications
#ColdFusion Database Pooling and Query Caching: Optimizing Performance for Scalable Applications#ColdFusion Database Pooling and Query Caching#ColdFusion Database Pooling#ColdFusion Query Caching
0 notes
Text
Thinking Of Excluding Branded Queries from Your Performance Max Campaign
It can be challenging for advertisers to decide whether to exclude branded questions from Performance Max campaigns. While branded searches can bring in high-quality visitors to your website, eliminating them can help you save money and concentrate on luring in new clients. Making the best choice for your organization requires carefully weighing the advantages and disadvantages of including or removing branded queries. Here, we will discuss when brand exclusions are appropriate and when they aren't.
�� When Brand Exclusions Make Sense?
In some circumstances, it may make sense to leave branded queries out of your Performance Max campaigns. The following are some scenarios where brand exclusions are justified:
👉 High brand search volume: Including branded searches can squander money if your brand is well-known and has a high search traffic.
👉 Launching a new product: Excluding branded questions can help you reach a wider audience and build brand recognition for new products when you're launching a new product or service.
👉 Budget constraints: By excluding branded queries, you can save money and direct resources toward non-branded search phrases that may result in the acquisition of new customers.
👉 Testing ad text: By excluding branded search phrases, you may assess how well your ad copy performs for generic search terms.
It may be wise to exclude branded enquiries in order to save money and concentrate on luring in new clients. You can use it to test the efficacy of ad text and gauge demand for new products.
🙄 When Brand Exclusions Don’t Make Sense?
It might not always be the best for your company to exclude branded queries from Performance Max campaigns. Brand exclusions are unnecessary in the following circumstances:
👉 Your brand is not well-known: By omitting branded searches, you may be able to narrow your audience and prospective traffic if your brand is not yet well-known or has a low search volume.
👉 Your branded search phrases have a high conversion rate. If this is the case, removing these terms could have a detrimental effect on the effectiveness and profitability of your campaign.
👉 You have a low volume of non-branded searches: If the volume of non-branded searches is minimal, eliminating branded queries may narrow the scope of your campaign and produce a low level of traffic.
👉 Increasing brand recognition is your main objective: If this is the case, omitting branded queries may impede your efforts and reduce your exposure to potential clients.
Excluding branded questions can reduce your audience, have a negative effect on the effectiveness of your campaign, and impede your efforts to build brand recognition.
🏁 Conclusion
Finally, removing branded queries from Performance Max campaigns can be a calculated move that both saves money and draws in new clients. Before making a decision, it's crucial to balance the advantages and disadvantages of excluding branded queries and take into account the particular requirements and objectives of your company.
#google ads#performance max#branded queries#search engine marketing#performance marketing#brand recognition
0 notes