#samplesets
Photo
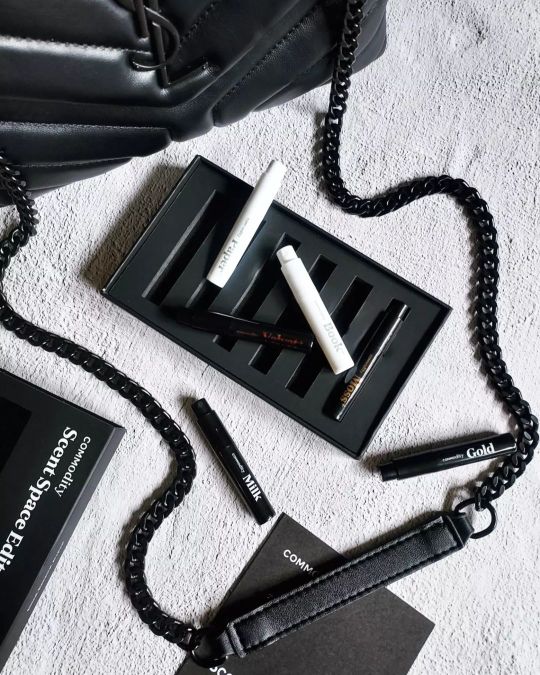
I have exciting new to share! Commodity is now available at one of my favorite beauty retailers. You can pick up this Scent Space Edit exclusively at @Sephora. The Commodity Fragrances Scent Space Edit features six perfumes; Book, Gold, Velvet, Moss, Paper, and Milk. There are three variations of each fragrance; Personal, Expressive, and Bold. This collection features a nice variety and it's a great way to explore their fragrances. Notes: Milk - Cold Milk, Marshmallow, Mahogany, and Tonka Bean. Gold - Juniper Berries, Amber, Creamy Sandalwood, and Sweet Vanilla. Book - Bergamot, crisp Eucalyptus, Vetiver, and Warm Sandalwood. Paper - Iso E Super, woods, Sweet Amber, and Skin Musk. Velvet - Roasted Almonds, Soft Rose Petals, and Sweet Amber. Moss - Bergamot, Oakmoss, and Petitgrain. http://www.commodityfragrances.com *Gifted by @commodity #commodityfragrance #sephora #sephorafragrance #styleyourcommodity #nichefragrance #commodityfragrances #nichefragrances #nicheperfumes #unisexfragrances #scentspaceedit #fragrancecommunity #unisexperfume #discoverykit #discoveryset #fragrancediscovery #sotd #scentoftheday #parfums #fragrancecollection #samplesets #perfumevial #perfumesales #perfumevials #explorationset #perfumeoftheday #eaudeparfum #fragranceniche #fragrance #fragrances #parfum (at New York City, N.Y.) https://www.instagram.com/p/CiazA80p42T/?igshid=NGJjMDIxMWI=
#commodityfragrance#sephora#sephorafragrance#styleyourcommodity#nichefragrance#commodityfragrances#nichefragrances#nicheperfumes#unisexfragrances#scentspaceedit#fragrancecommunity#unisexperfume#discoverykit#discoveryset#fragrancediscovery#sotd#scentoftheday#parfums#fragrancecollection#samplesets#perfumevial#perfumesales#perfumevials#explorationset#perfumeoftheday#eaudeparfum#fragranceniche#fragrance#fragrances#parfum
1 note
·
View note
Text
oh good lord this organ has pretty flutes.
#caroline.txt#messing around with a hauptwerk sampleset i downloaded forever ago but never got around to really using
0 notes
Text
Fabric Swatches
Linen Fabric Samples set , Fabric by the yard , Linen Dress Fabric swatch - Block print Dress / Ready to ship.
Visit Shop:-https://etsy.me/38GLXNb
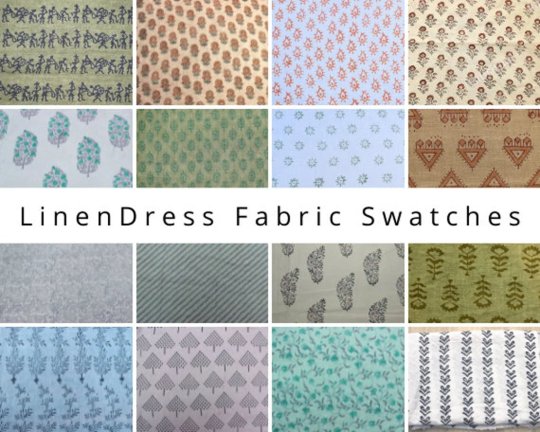
Linen Fabric with Hand Block Print for dresses , clothing and apparels .
Swatches Included - Authentic Bagru Block Print , Indigo Dabu block prints, pre-dip Colored with Block Print, Shibori Print , Tie dye print etc .
PATTERNS-
Floral
Geometric
Paisley
Flower vine
polka dot
Ajrak
Ethnic and many more Traditional BLOCK PRINT PATTERNS on Best Pure Linen Fabrics.
◼Your swatches will include many types of Pure Linen(diffrent Thickness)with various patterns and base colors
◼Sizes of The swatches can be diffrent probably according to their block print pattern .
◼ All of our block prints are handmade by using completely natural colors , process and stencils .
◼ Length of the swatches can be vary due to different sizes of block print patterns
◼Linen fabric characteristics:
• Pure 100% linen washed and softened from the manufacturing process
• Softened linen fabric are very soft and are highly absorbent
• Washed linen fabric products not shrink.
• Easy to care. Please Do Not Tumble Dry!
• Looks nice not ironed
CUSTOMIZATION OF FABRIC , PATTERNS AND COLORS IS ALSO AVAILABLE AS PER YOUR CHOICE
ALSO CHECK OUR BLOCK PRINT THICK LINEN
THICK COTTON FABRICS FOR HOME DECOR-:
https://www.etsy.com/listing/1204844985/block-print-samples-samples-swatches
0 notes
Text
📣 Friendly updates from the Soap Shop 🧼 All orders over $50 qualify for Complementary "Soap Sample Set"🧨so you'll be able to try different soaps according to the season 🍂🍁🌲🌿🍀 Wish you all Happy Fall 🍂🍁and Holiday season ✨️🎄
#samples #sampleset #soapset
#giftset #fallseason #artisansoap
#Complementary #soapgifts #simplyherbaldelight #localbrand #freesamples #fallvibes #quality
instagram
0 notes
Text
ANOVA and Hypothesis Testing.
The Syntax:
-- coding: utf-8 --
"""
Created on Wed Sep 14 16:20:39 2022
@author: Aujasvi Sulekh
"""
import pandas as pd
import numpy as np
import statsmodels.formula.api as smf
import statsmodels.stats.multicomp as multi
//Load the NESARC dataset
nesarc = pd.read_csv ('NESARC Pds.csv' , low_memory=False)
//Set PANDAS to show all columns in DataFrame
pd.set_option('display.max_columns', None)
//Set PANDAS to show all rows in DataFrame
pd.set_option('display.max_rows', None)
nesarc.columns = map(str.upper , nesarc.columns)
pd.set_option('display.float_format' , lambda x:'%f'%x)
//Change variables to numeric
nesarc['AGE'] = pd.to_numeric(nesarc['AGE'], errors='coerce')
nesarc['S3BQ4'] = pd.to_numeric(nesarc['S3BQ4'], errors='coerce')
nesarc['S3BQ1A5'] = pd.to_numeric(nesarc['S3BQ1A5'], errors='coerce')
nesarc['S3BD5Q2B'] = pd.to_numeric(nesarc['S3BD5Q2B'], errors='coerce')
nesarc['S3BD5Q2E'] = pd.to_numeric(nesarc['S3BD5Q2E'], errors='coerce')
nesarc['MAJORDEP12'] = pd.to_numeric(nesarc['MAJORDEP12'], errors='coerce')
nesarc['GENAXDX12'] = pd.to_numeric(nesarc['GENAXDX12'], errors='coerce')
//Subset the sample
sampleset = nesarc[(nesarc['AGE']>=18) & (nesarc['AGE']<=30) & (nesarc['S3BQ1A5']==1)]
//Cannabis users, ages 18-30
samplecopy = sampleset.copy()
//Setting missing data for quantity of cannabis (measured in joints), variable S3BQ4
samplecopy['S3BQ4'] = samplecopy['S3BQ4'].replace(99, np.nan)
samplecopy['S3BQ4'] = samplecopy['S3BQ4'].replace('BL', np.nan)
//Creating a new subset while removing the null values
newsub_a = samplecopy[['S3BQ4', 'MAJORDEP12']].dropna()
//Using ols function for calculating the F-statistic and the associated p value
//Depression (categorical, explanatory variable) and joints quantity (quantitative, response variable) correlation
model_a = smf.ols(formula='S3BQ4 ~ C(MAJORDEP12)', data = newsub_a)
result_a = model_a.fit()
print(result_a.summary())
//Measure mean and spread for categorical variable MAJORDEP12, major depression
print ('Means for joints quantity by major depression status')
mean_a = newsub_a.groupby('MAJORDEP12').mean()
print(mean_a)
print ('Standard deviations for joints quantity by major depression status')
sdev_a = newsub_a.groupby('MAJORDEP12').std()
print(sdev_a)
//Creating a new subset while removing the null values
newsub_b = samplecopy[['S3BQ4', 'GENAXDX12']].dropna()
//Using ols function for calculating the F-statistic and the associated p value
//Anxiety (categorical, explanatory variable) and joints quantity (quantitative, response variable) correlation
model_b = smf.ols(formula='S3BQ4 ~ C(GENAXDX12)', data = newsub_b)
result_b = model_b.fit()
print(result_b.summary())
//Measure mean and spread for categorical variable GENAXDX12, general anxiety
print ('Means for joints quantity by major general anxiety status')
mean_b = newsub_b.groupby('GENAXDX12').mean()
print(mean_b)
print ('Standard deviations for joints quantity by general anxiety status')
sdev_b = newsub_b.groupby('GENAXDX12').std()
print(sdev_b)
//Setting missing data for frequency of cannabis use, variable S3BD5Q2E
samplecopy['S3BD5Q2E'] = samplecopy['S3BD5Q2E'].replace(99, np.nan)
samplecopy['S3BD5Q2E'] = samplecopy['S3BD5Q2E'].replace('BL', np.nan)
newsub_c = samplecopy[['S3BQ4', 'S3BD5Q2E']].dropna()
//Using ols function for calculating the F-statistic and associated p value
//Frequency of cannabis use (10 level categorical, explanatory variable) and joints quantity (quantitative, response variable) correlation
model_c = smf.ols(formula='S3BQ4 ~ C(S3BD5Q2E)', data = newsub_c)
result_c = model_c.fit()
print(result_c.summary())
//Measure mean and spread for categorical variable S3BD5Q2E, frequency of cannabis use
print('Means for joints quantity by frequency of cannabis use status')
//cannabis_use_mean= newsub_b.groupby('S3BD5Q2E').mean()
cannabis_use_mean= samplecopy['S3BD5Q2E'].mean()
print(cannabis_use_mean)
print('Standard deviations for joints quantity by frequency of cannabis use status')
cannabis_use_sdev = newsub_c.groupby('S3BD5Q2E').std()
print(cannabis_use_sdev)
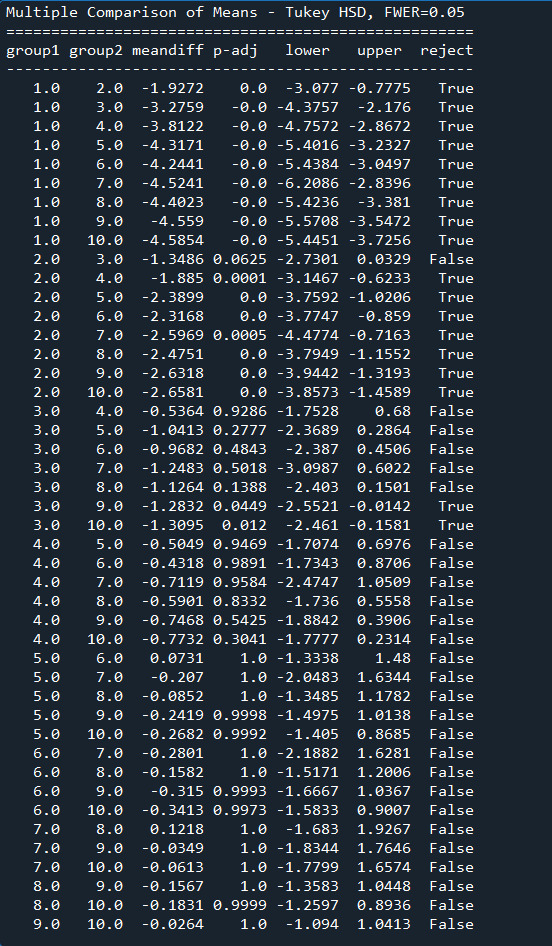
//Run a post hoc test (paired comparisons), using Tukey HSDT
multicmp = multi.MultiComparison(newsub_c['S3BQ4'], newsub_c['S3BD5Q2E'])
result = multicmp.tukeyhsd()
print(result.summary())
Theory and Introduction:
Analysis of variance, or ANOVA, is a statistical method that separates observed variance data into different components to use for additional tests. A one-way ANOVA is used for three or more groups of data, to gain information about the relationship between the dependent and independent variables.
The data was provided by the National Epidemiological Survey on Alcohol and Related Conditions (NESARC), which was conducted in a random sample of 43,093 U.S. adults and designed to determine the magnitude of alcohol use and psychiatric disorders. Sample size is important because the larger the sample size, the more accurate the findings. NESARC’s unusually large sample size also made it possible to achieve stable estimates of even rare conditions. NESARC participants came from all walks of life and a variety of ages, and the level of analysis studied was individual. They represented all regions of the United States and included residents of the District of Columbia, Alaska, and Hawaii. In addition to sampling individuals living in traditional households, NESARC investigators questioned military personnel living off base and people living in a variety of group accommodations such as boarding or rooming houses and college quarters. More specifically, the sample consists of 24,575 (57.1%) males and 18,518 (42.9%) females, among of whom 9,535 (22.13%) were aged between 18 and 30 years old. The data analytic subset, examined in this study, includes individuals aged between 18 and 30 years old who reported using cannabis at least once in their life (N=2,412).
For the comments '#' has been replaced by '//' in the syntax.
The Syntax:
-- coding: utf-8 --
"""
Created on Wed Sep 14 16:20:39 2022
@author: Aujasvi Sulekh
"""
import pandas as pd
import numpy as np
import statsmodels.formula.api as smf
import statsmodels.stats.multicomp as multi
//Load the NESARC dataset
nesarc = pd.read_csv ('NESARC Pds.csv' , low_memory=False)
//Set PANDAS to show all columns in DataFrame
pd.set_option('display.max_columns', None)
//Set PANDAS to show all rows in DataFrame
pd.set_option('display.max_rows', None)
nesarc.columns = map(str.upper , nesarc.columns)
pd.set_option('display.float_format' , lambda x:'%f'%x)
//Change variables to numeric
nesarc['AGE'] = pd.to_numeric(nesarc['AGE'], errors='coerce')
nesarc['S3BQ4'] = pd.to_numeric(nesarc['S3BQ4'], errors='coerce')
nesarc['S3BQ1A5'] = pd.to_numeric(nesarc['S3BQ1A5'], errors='coerce')
nesarc['S3BD5Q2B'] = pd.to_numeric(nesarc['S3BD5Q2B'], errors='coerce')
nesarc['S3BD5Q2E'] = pd.to_numeric(nesarc['S3BD5Q2E'], errors='coerce')
nesarc['MAJORDEP12'] = pd.to_numeric(nesarc['MAJORDEP12'], errors='coerce')
nesarc['GENAXDX12'] = pd.to_numeric(nesarc['GENAXDX12'], errors='coerce')
//Subset the sample
sampleset = nesarc[(nesarc['AGE']>=18) & (nesarc['AGE']<=30) & (nesarc['S3BQ1A5']==1)]
//Cannabis users, ages 18-30
samplecopy = sampleset.copy()
//Setting missing data for quantity of cannabis (measured in joints), variable S3BQ4
samplecopy['S3BQ4'] = samplecopy['S3BQ4'].replace(99, np.nan)
samplecopy['S3BQ4'] = samplecopy['S3BQ4'].replace('BL', np.nan)
//Creating a new subset while removing the null values
newsub_a = samplecopy[['S3BQ4', 'MAJORDEP12']].dropna()
//Using ols function for calculating the F-statistic and the associated p value
//Depression (categorical, explanatory variable) and joints quantity (quantitative, response variable) correlation
model_a = smf.ols(formula='S3BQ4 ~ C(MAJORDEP12)', data = newsub_a)
result_a = model_a.fit()
print(result_a.summary())
//Measure mean and spread for categorical variable MAJORDEP12, major depression
print ('Means for joints quantity by major depression status')
mean_a = newsub_a.groupby('MAJORDEP12').mean()
print(mean_a)
print ('Standard deviations for joints quantity by major depression status')
sdev_a = newsub_a.groupby('MAJORDEP12').std()
print(sdev_a)
//Creating a new subset while removing the null values
newsub_b = samplecopy[['S3BQ4', 'GENAXDX12']].dropna()
//Using ols function for calculating the F-statistic and the associated p value
//Anxiety (categorical, explanatory variable) and joints quantity (quantitative, response variable) correlation
model_b = smf.ols(formula='S3BQ4 ~ C(GENAXDX12)', data = newsub_b)
result_b = model_b.fit()
print(result_b.summary())
//Measure mean and spread for categorical variable GENAXDX12, general anxiety
print ('Means for joints quantity by major general anxiety status')
mean_b = newsub_b.groupby('GENAXDX12').mean()
print(mean_b)
print ('Standard deviations for joints quantity by general anxiety status')
sdev_b = newsub_b.groupby('GENAXDX12').std()
print(sdev_b)
//Setting missing data for frequency of cannabis use, variable S3BD5Q2E
samplecopy['S3BD5Q2E'] = samplecopy['S3BD5Q2E'].replace(99, np.nan)
samplecopy['S3BD5Q2E'] = samplecopy['S3BD5Q2E'].replace('BL', np.nan)
newsub_c = samplecopy[['S3BQ4', 'S3BD5Q2E']].dropna()
//Using ols function for calculating the F-statistic and associated p value
//Frequency of cannabis use (10 level categorical, explanatory variable) and joints quantity (quantitative, response variable) correlation
model_c = smf.ols(formula='S3BQ4 ~ C(S3BD5Q2E)', data = newsub_c)
result_c = model_c.fit()
print(result_c.summary())
//Measure mean and spread for categorical variable S3BD5Q2E, frequency of cannabis use
print('Means for joints quantity by frequency of cannabis use status')
//cannabis_use_mean= newsub_b.groupby('S3BD5Q2E').mean()
cannabis_use_mean= samplecopy['S3BD5Q2E'].mean()
print(cannabis_use_mean)
print('Standard deviations for joints quantity by frequency of cannabis use status')
cannabis_use_sdev = newsub_c.groupby('S3BD5Q2E').std()
print(cannabis_use_sdev)
//Run a post hoc test (paired comparisons), using Tukey HSDT
multicmp = multi.MultiComparison(newsub_c['S3BQ4'], newsub_c['S3BD5Q2E'])
result = multicmp.tukeyhsd()
print(result.summary())
The Output:


1 note
·
View note
Photo

Set of 8 MINI BATH BOMBS | Bath fizzies | Sample Set | Bath Bomb | Self Care | Bath Fizzy https://etsy.me/3KElFc0 . . #etsy #rainbow #glitterbomb #bathfizzies #bathbomb #bathbombs #selfcare #mothersdaygift #minibathbombs #bathbombset #sampleset #bathfizzy #bath #bubblebar #bathtruffle #bubblebath #selfcaregift #cocktails #WWSC #selfcaregift #smallbusiness #smallbusinesslove #smallbusinessLA #shopsmallbusiness #entrepreneursOfInstagram #shoplocalLA #smallbusinessLosAngeles #shopsmall #CreateYourHappy #BeYourOwnBoss #weekendwanderlustsoapco (at Los Angeles, California) https://www.instagram.com/p/CcJGr0ivAib/?igshid=NGJjMDIxMWI=
#etsy#rainbow#glitterbomb#bathfizzies#bathbomb#bathbombs#selfcare#mothersdaygift#minibathbombs#bathbombset#sampleset#bathfizzy#bath#bubblebar#bathtruffle#bubblebath#selfcaregift#cocktails#wwsc#smallbusiness#smallbusinesslove#smallbusinessla#shopsmallbusiness#entrepreneursofinstagram#shoplocalla#smallbusinesslosangeles#shopsmall#createyourhappy#beyourownboss#weekendwanderlustsoapco
0 notes
Photo
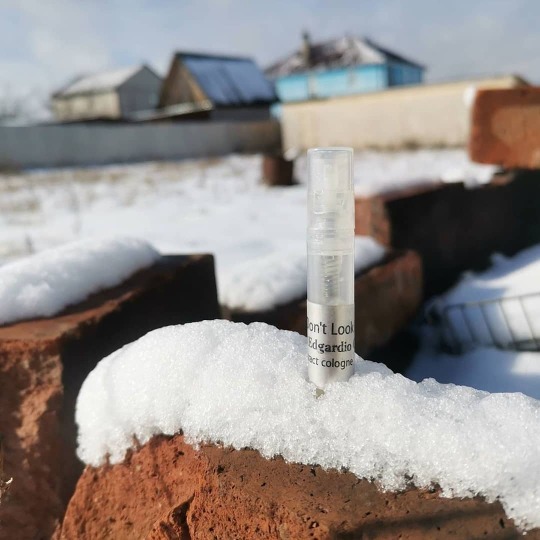
Автор @fred_pechalnaya Dont look back - все пережитое оставим в прошлом, раскрыв свои объятия новому. Каждый придёт в согласие с самим собой, ведь это сложнее всего. . . Аромат @edgardio_chilini цветочный, фруктовый с помадными оттенками. . При заказе на сайте, пробник #Perfumebox в подарок . #зимнийпейзаж #подмосковье #зимавмоскве #23февраля #приятноесполезным #запискиотскуки #perfumeoftheday #edgardiochilini #fragrance #mycollection #sampleset chilini.com https://www.instagram.com/p/B9zirgBAoF5/?igshid=j9t8yazpv2sm
#perfumebox#зимнийпейзаж#подмосковье#зимавмоскве#23февраля#приятноесполезным#запискиотскуки#perfumeoftheday#edgardiochilini#fragrance#mycollection#sampleset
0 notes
Photo
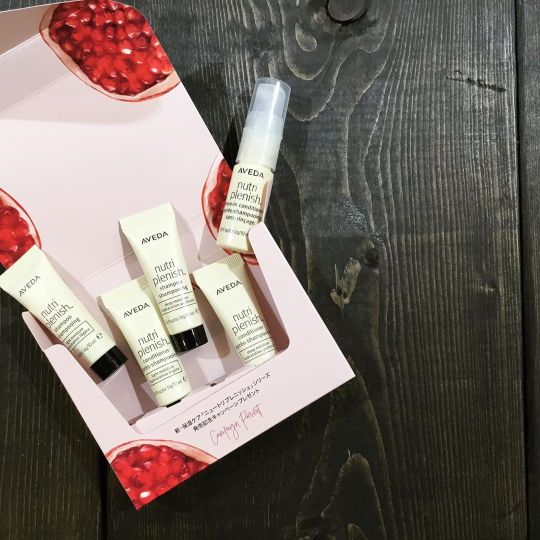
*** REMITE Branddirector ETSUKO AVEDA @avedajapanさんから 頂きました💕 #REMITE #remite #リミーテ #吉祥寺 #セレクトショップ #大人カジュアル #中道通り #アヴェダ #ニュートリプレニッシュ #至福の潤い #いい香り #サンプルセット #スーパーフード #ザクロ #保湿ケア #nutriplenish #sampleset #aveda #shampoo #conditioner #leaveinconditioner #pomegranate #pomegranateseeds #moisturizing https://www.instagram.com/p/B9bVMJaj-0_/?igshid=1l9tqnxxdr5sg
#remite#リミーテ#吉祥寺#セレクトショップ#大人カジュアル#中道通り#アヴェダ#ニュートリプレニッシュ#至福の潤い#いい香り#サンプルセット#スーパーフード#ザクロ#保湿ケア#nutriplenish#sampleset#aveda#shampoo#conditioner#leaveinconditioner#pomegranate#pomegranateseeds#moisturizing
0 notes
Text
Hauptwerk sample set hammond
HAUPTWERK SAMPLE SET HAMMOND >> DOWNLOAD LINK
vk.cc/c7jKeU
HAUPTWERK SAMPLE SET HAMMOND >> READ ONLINE
bit.do/fSmfG
Hauptwerk sample. Organ Expressions is a recognized maker of VPOs for Hauptwerk software. We are the only source for purchasing these organs.Pieter van Helden made pull buttons (on basis of the Kampen sampleset). Het Eminent/Hauptwerk Another organ of Jan Vogel: An Hammond/Hauptwerk organ. Compare sampleset with free mp… | Organs, Hammond organ, Piano lessons Mar 18, 2018 - Explore Cristi Prodan's board "hauptwerk" on Pinterest. Image result for hauptwerk sample set Hammond Organ, Bunk Beds, Floor Chair, Up to up to 96kHz sample rate; New! It's easy to set up Hauptwerk in your home to use for practice or study with world-class virtual instruments. Instructions for the installation and testing of Hauptwerk and an associated sample set are given. Hauptwerk is configured for use with the Wersi external
https://wihacuqihadu.tumblr.com/post/667938435534929920/qsc-gx3-repair-manual, https://porihovij.tumblr.com/post/667907301140725760/electrical-material-list-with-pictures-pdf, https://jaxitekafunu.tumblr.com/post/668087918856912896/lego-batman-2-ps3-manual, https://munujuqurote.tumblr.com/post/668016341864890368/amway-cleartrak-manual, https://fonotigeqolo.tumblr.com/post/667969767076986880/hiragino-kaku-gothic-pro-font.
0 notes
Photo

PROBABILITY DISTRIBUTION EX:8.4(P1) | HSC CLASS 12 MAHARASHTRA BOARD http://ehelpdesk.tk/wp-content/uploads/2020/02/logo-header.png [ad_1] In this video we will discuss su... #academics #binomialdistributionhscclass12 #boardexam #calculus #chineselanguage #continuousrandomvariable #datastructures #englishconversation #englishgrammar #englishlanguage #frenchlanguage #germanlanguage #gkp #gkp360 #gyankapitara #hasnainsir #hscclass12maharashtraboard #ielts #japaneselanguage #linearalgebra #math #pdfofcontinuousrandomvariable #pmfsums #probability #probabilitydistribution #probabilityhscclass12 #probabilityhscclass12maharashtra #probabilitymassfunction #probabilitymassfunctionsums #sampleset #signlanguage #spanishlanguage #statistics #teaching #thebible
0 notes
Photo

It started with sampleset of beer endwith bunch of pitchers#ironhill#friendsmeet#pitcher#manojkummari https://www.instagram.com/p/BveYKSMAIoh/?igshid=1tzrr6z4urjtj
0 notes
Text
📣 Friendly updates from the Soap Shop 🧼 All orders over $50 qualify for Complementary "Soap Sample Set"🧨so you'll be able to try different soaps according to the season 🍂🍁🌲🌿🍀 Wish you all Happy Fall 🍂🍁and Holiday season ✨️🎄
#samples #sampleset #soapset
#giftset #fallseason #artisansoap
#Complementary #soapgifts #simplyherbaldelight #localbrand #freesamples #fallvibes #quality
instagram
0 notes
Photo

[Release][Tutorial] SampleSettings - Fully theme your settings, including shuffle via /r/iOSthemes http://bit.ly/2wKnLms
0 notes
Photo
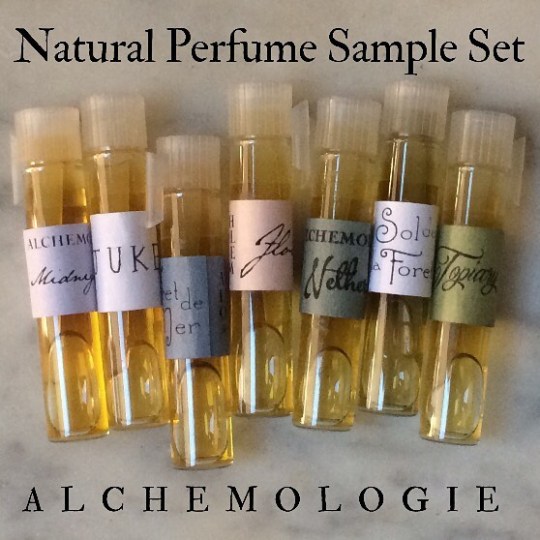
They come all wrapped up and ready for gifting. . . #perfume #perfumes #naturalperfume #botanicalperfume #alchemy #alchemologie #samples #sampleperfume #perfumesamples #sampleset #perfumeshop #perfumelovers #perfumery #perfumista #beautyblogger #naturalbeauty #naturalfragrance #perfumeryart #essentialoils #nicheperfume #ecobeauty #ecofriendly (at Alchemologie Natural Perfume) https://www.instagram.com/alchemologie/p/BrBPd6TBWLb/?utm_source=ig_tumblr_share&igshid=1c3lu6jiu0hyy
#perfume#perfumes#naturalperfume#botanicalperfume#alchemy#alchemologie#samples#sampleperfume#perfumesamples#sampleset#perfumeshop#perfumelovers#perfumery#perfumista#beautyblogger#naturalbeauty#naturalfragrance#perfumeryart#essentialoils#nicheperfume#ecobeauty#ecofriendly
0 notes
Photo

Size özel Travel Setinizi oluşturup, kendinizi daha özel hissedin. Binlerce bay ve bayan parfüm çeşidi ile websitemizi inceleyebilirsiniz. #travelset #seyahatboyu #sampleset #perfume #decant #parfüm #decantall https://www.instagram.com/p/BqvMk5lDqfc/?utm_source=ig_tumblr_share&igshid=1mfjif46ainbg
0 notes
Photo

Handmade soap samplers heading out today! A fun way to try different soaps if you just can’t decide which one’s the yummiest for you! . . . #soap #handmadesoap #coldpricess #etsy #etsysellersofinstagram #etsyseller #sampler #sampleset #giftidea #holidaygiftguide #rva #madeinvirginia #tuesday #photooftheday #skincare #bathroomdecor #homedecor (at Cricket Cove Soap Co.) https://www.instagram.com/p/Bobx_vVhi0f/?utm_source=ig_tumblr_share&igshid=16uiap53bh933
#soap#handmadesoap#coldpricess#etsy#etsysellersofinstagram#etsyseller#sampler#sampleset#giftidea#holidaygiftguide#rva#madeinvirginia#tuesday#photooftheday#skincare#bathroomdecor#homedecor
0 notes
Last Seen Blogs


verlierer-is-lost
Simon

nelki
Nelki
surrenderingintotheone
Yo Soy
melody-013
I Live And Die For Moments That We Stole