#technical analysis charts
Explore tagged Tumblr posts
Visit Tumblr Blog
Explore Tumblr blogs with no restrictions, modern design and the best experience.
Last Seen Tumblr Blogs


Fun Fact
In 2020, 44% of users from Denmark used Tumblr daily.
Text
Technical Analysis Charts: Read Markets with Confidence
Understand how to spot market trends with Technical Analysis Charts through The Stock Learning’s simple and practical program. Learn how to read candlestick patterns, identify support and resistance, and use indicators to make better trading decisions. This beginner-friendly guide helps you turn complex charts into easy tools for finding smart entry and exit points. Whether you’re new to trading or looking to sharpen your skills, you’ll gain the knowledge to act with confidence.
Start your trading journey today — visit The Stock Learning and master technical charts!
0 notes
Text
Importance of chart analysis for equity investments
Image by freepik Chart analysis, or technical analysis, can be quite helpful for equity investment in the Indian stock market. Here are several reasons why it is beneficial: Benefits of Chart Analysis in the Indian Stock Market 1.Trend Identification The Indian stock market, like any other, exhibits trends over time. Chart analysis helps in identifying these trends, allowing investors to ride…
#chart analysis#equity investment#Financial Markets#Indian stock market#investment strategies#market analysis#Market Sentiment#Stock Charts#Stock Market#Stock Trading#Support and Resistance#Technical Analysis#Technical Indicators#Trading Patterns#Trend Identification#Volume Analysis
3 notes
·
View notes
Text

I made a script that counts words in a DM with my bestie and the word "friend" is among the common ones :D (bestie: @naorazy-vavilon)
#pie chart#friendship#yay i have friend#coding#besties#happy#sorry#comforting#data analysis#< technically
3 notes
·
View notes
Text
Technical Analysis in a Nutshell
Technical analysis is a method used to evaluate and forecast the price movements of financial instruments, such as stocks, commodities, and currencies, by analyzing historical price data and trading volumes. Unlike fundamental analysis, which focuses on a company’s financial health, technical analysis relies on patterns, trends, and statistical indicators to make trading decisions. This article…
#Bollinger Bands#Chart Patterns#Divergence#Entry and Exit Points#Exponential Moving Average#Financial Markets#Fundamental Analysis#MACD#Market Movements#Moving Average#Moving Average Convergence Divergence#Oversold Conditions#Position Sizing#Price Charts#Price Movement#Price Movements#Relative Strength#Risk Management#RSI#Security#Stop-Loss#Support And Resistance#Technical Analysis#Trading Decisions#Trading Strategies#Trading Volume#Trend Lines#Volatility
2 notes
·
View notes
Text
06/21/2025 - Gold & Silver Market News
Brought to you by the Free Bullion Investment Guide
06/21: Gold price forecast as Citi predicts a 26% crash - invezz
06/21: Podcast: Go Time for Commodities - Positioning for the Next Commodity Surge: Insights from Adam Rozencwajg - Sprott
06/21: What's Hot: Platinum – Tight supply meets broadening use - WisdomTree
06/21: Graphic: Visualized: Global Inflation Projections in 2025 and 2026 - Visual Capitalist
06/21: Gold Surpasses Euro as the Second-Largest Reserve Currency in the World - U.S. Global Investors
Thank you for your time. Take Care & God Bless, from the Free-Bullion-Investment-Guide.com
#gold#silver#investing#technical analysis#silver prices#charts#gold prices#financial news#news#gold investment news
0 notes
Text
Why the Best Technical Analysis Course Teaches Patience, Not Predictions
Successful trading isn’t about predicting the market—it's about preparing for it. In this blog, discover why the best technical analysis course focuses on building patience, not guesses. At Chart Monks, we train you to wait for high-probability setups backed by price action and demand-supply zones. You'll stop chasing the market and start understanding its rhythm. Whether you're a beginner or tired of overcomplicating things, this course simplifies everything you need to know. Read the full blog to shift your mindset and trading approach. Connect with us at +91-9220943789 and learn the smarter way to trade.
#Trading Analysis Course#Technical Analysis Trading Course#Best Technical Analysis Course#Best Technical Analysis Course Online#Chart Monks
0 notes
Text
youtube
Looking to spot trend reversals before the rest of the market catches on? This video breaks down powerful reversal signals every smart trader should know to maximize profits and minimize losses. In this detailed guide, we uncover the top reversal patterns, indicators, and techniques used by successful traders across the stock, forex, and crypto markets. Learn how to identify momentum shifts, trap zones, and entry/exit points that could change the game for your trading strategy. Whether you're day trading, swing trading, or investing long-term, understanding reversal signals is key to protecting your capital and boosting returns. Websites: https://tradegenie.com/ https://nosheekhan.com/ Twitter - https://twitter.com/marketswizard Facebook - https://www.facebook.com/financialmar Head Office: Trade Genie Inc. 315 South Coast Hwy 101, Encinitas, CA 92024 Phone Number: 212-408-3000 #ReversalSignals #TradingProfits #TechnicalAnalysis #PriceAction #ChartPatterns #StockMarketTips #ForexTrading #CryptoSignals #SwingTrading #DayTrading #TrendReversal #SmartTrading #UnlockProfits #TradingEducation #MarketMoves
#Reversal-Signals#Trading-Profits#Technical-Analysis#Price-Action#Chart-Patterns#Stock-Market-Tips#Forex-Trading#Crypto-Signals#Swing-Trading#Day-Trading#Trend-Reversal#Smart-Trading#Trading-Education#Youtube
0 notes
Text
Nifty Forecast Tomorrow: Expert Predictions and Market Trends You Should Know
If you're looking for the most accurate Nifty forecast for tomorrow, you're not alone. Every day, thousands of traders and investors closely follow the Nifty 50 index, aiming to anticipate the next market move and get a step ahead of the volatility. In this post, we break down key technical levels, current sentiment, and expert-backed strategies to help you prepare for the trading session ahead.
📊 What Is the Nifty 50 and Why Its Forecast Matters
The Nifty 50 is India’s flagship stock market index, representing 50 of the largest and most liquid companies listed on the National Stock Exchange (NSE). It's a key barometer for market trends and investor confidence.
A well-researched forecast for Nifty 50 movement tomorrow can be highly valuable for:
Intraday traders planning entry and exit points.
Swing traders timing short-term opportunities.
Investors staying aligned with macroeconomic trends.
🔍 Nifty 50 Technical Analysis for Tomorrow
1. Key Support and Resistance Levels
Based on today’s market close and recent trading patterns:
Support zones: 22,300 and 22,180
Resistance zones: 22,500 and 22,640
If the index breaks above 22,500 with momentum, it may push higher. A drop below 22,180 could shift sentiment toward bearish.
2. Moving Averages
Nifty is trading above both 20-day and 50-day EMAs, suggesting the trend remains positive.
The Relative Strength Index (RSI) is around 58–60, reflecting healthy momentum without overbought conditions.
3. Candlestick Pattern
Today’s session showed indecision, forming a neutral candle. A breakout candle or a bullish engulfing pattern tomorrow would be a strong confirmation of upward momentum.
🗣️ Market Sentiment & Global Cues
Sentiment in the market remains cautiously optimistic. Some of the key global and domestic factors influencing the Nifty forecast tomorrow include:
U.S. Federal Reserve commentary on interest rates
Movement in crude oil prices
INR/USD exchange rate fluctuations
Institutional investor activity (FII/DII inflow/outflow)
FIIs were net buyers today, a signal that global appetite for Indian equities remains intact — at least for now.
📈 Expert Outlook: Nifty Forecast for Tomorrow
Analysts are leaning towards a mild bullish trend continuing into tomorrow’s session, assuming no sudden negative cues overnight. That said, volatility is likely to spike during the first hour of trade.
Here are some smart trading reminders:
Don’t chase early price gaps.
Stick to well-defined stop losses.
Wait for volume confirmation, especially near breakout zones.
💡 Tip: A breakout above 22,500 on strong volume could provide a high-probability setup for short-term trades.
🛠️ Action Plan for Traders
Intraday Traders
Observe the first 15–30 minute range for market direction.
Indicators like MACD, RSI, and volume spikes are crucial for timing entries.
Use a trailing stop-loss strategy once in profit.
Positional Traders
Consider adding long positions above 22,500 with upside targets around 22,800.
If Nifty dips below 22,180, reassess and wait for a base to form before entering.
🔗 Live Updates and Tools
Want more granular data? For real-time charts, key levels, and analyst videos, check out the full Nifty 50 forecast and live analysis page.
📬 Final Thoughts
A well-informed Nifty prediction for tomorrow helps traders cut through the noise and take calculated risks. No forecast is 100% guaranteed, but combining technical signals, market sentiment, and global cues can give you an edge.
Trade smart. Stay disciplined. And always have a plan.
#nifty forecast tomorrow#nifty 50 prediction#nifty 50 forecast#nifty technical analysis#nifty trend tomorrow#share market forecast#stock market prediction#nifty outlook#nifty analysis#nifty trading strategy#nifty support and resistance#nifty levels tomorrow#intraday trading tips#stock market india#nifty market trend#nifty tomorrow analysis#nifty movement prediction#NSE forecast#indian stock market forecast#market trend analysis#technical analysis nifty 50#nifty 50 chart#fii dii data analysis#stock market update today#trading view nifty#nifty live updates#nifty chart pattern#nifty stock tips#nifty breakout strategy#nifty candlestick analysis
0 notes
Text
Nifty Prediction For Monday, May 12: Volatility Remains High Amid India-Pak Tensions, Key Support At 23,800 - News18
Last Updated:May 10, 2025, 12:58 IST Market experts attributed the selloff to geopolitical concerns following Operation Sindoor Nifty Prediction For May 12. Indian equity markets closed sharply lower on Friday, May 9, amid escalating tensions between India and Pakistan. Both benchmark indices—Sensex and Nifty 50—fell over 1%. The Sensex dropped 880.34 points, or 1.10%, to 79,454.47, while the…

View On WordPress
#geopolitical impact on markets#India VIX#India-Pakistan tensions#Indian stock market forecast#market volatility#Nifty 50 forecast#Nifty 50 levels#Nifty chart analysis#Nifty Monday prediction#Nifty prediction#Nifty support and resistance#Nifty technical analysis#operation sindoor#Sensex and Nifty news#stock market outlook
0 notes
Text
Ajanta Pharma Q4 2025 Conference Call
Search Keyword: Ajanta Pharma share price, Ajanta Pharma stock today, Ajanta Pharma latest share news, Ajanta Pharma stock analysis, Ajanta Pharma share forecast, Ajanta Pharma price target, Ajanta Pharma stock performance, Ajanta Pharma share NSE, Ajanta Pharma share BSE, Ajanta Pharma equity share, Ajanta Pharma share long term, Ajanta Pharma stock for 2025, Is Ajanta Pharma a good buy, Ajanta…
youtube
View On WordPress
#Ajanta Pharma breakout level#Ajanta Pharma dividend history#Ajanta Pharma equity share#Ajanta Pharma latest share news#Ajanta Pharma moving average#Ajanta Pharma price target#Ajanta Pharma return on investment#Ajanta Pharma share BSE#Ajanta Pharma share chart#Ajanta Pharma share forecast#Ajanta Pharma share long term#Ajanta Pharma share NSE#Ajanta Pharma share price#Ajanta Pharma share trends#Ajanta Pharma stock analysis#Ajanta Pharma stock for 2025#Ajanta Pharma stock growth#Ajanta Pharma stock performance#Ajanta Pharma stock today#Ajanta Pharma stock valuation#Ajanta Pharma support resistance#Ajanta Pharma technical analysis#Ajanta Pharma volume analysis#Buy Ajanta Pharma share now#Fundamental analysis Ajanta Pharma#Is Ajanta Pharma a good buy#MACD Ajanta Pharma stock#Multibagger Ajanta Pharma stock#RSI of Ajanta Pharma#Youtube
0 notes
Text
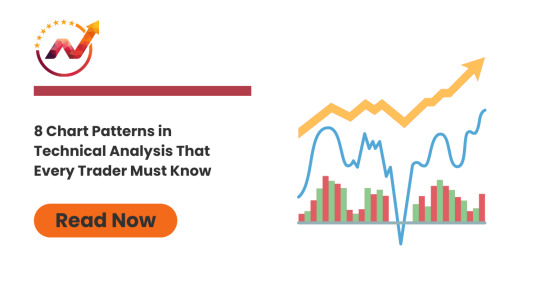
Top 8 Must-Know Chart Patterns in Technical Analysis | NTA®
Discover the 8 essential chart patterns every trader should master. Enhance your trading strategy with insights into market trends and price action analysis.
0 notes
Text
6 RISKY Forex Trades I Took This week!
Feeling the heat of the markets? Over the past three days, I’ve taken six high-conviction trades—five live now, one on deck—and in my latest video I break down exactly why I pulled the trigger, how I managed risk, and what I’m watching next. Whether you’re a seasoned forex trader or just curious how I use fair value gaps across multiple timeframes, this is one you don’t want to miss. What You’ll…
#AUD/CHF#AUD/JPY#CAD/CHF#Chart Analysis#Emotional Discipline#EUR/JPY#Fair Value Gap#Forex Education#Forex Trading#High-Probability Setups#Live Trading#Money Management#Multi-Timeframe Analysis#NZD/CHF#Price Action#Risk Management#Technical Analysis#Trade Breakdown#Trading Strategy#USD/CHF
0 notes
Text
📊 How to Read a Crypto Chart – Beginner Basics!
If crypto charts look like rocket science 🚀—you’re not alone. Here's what to know:
✅ Candles = Price movement over a specific time (green = up, red = down) ✅ Volume = How much is being traded ✅ Support = A price level where people tend to buy ✅ Resistance = A level where people tend to sell
📈 Example: If Bitcoin keeps bouncing off $25K, that’s a support level.
🚀 Don’t overthink it—just start by spotting trends and learning slowly.
📩 Want help reading your first chart? Drop a comment! 🔁 Reblog if you're learning technical analysis!
#crypto#cryptocurrency#bitcoin#blockchain#crypto for beginners#crypto charts#technical analysis#crypto education#investing#Crypto Made Simple#ethereum#DeFi#financial freedom#crypto awareness#trading tips#crypto trading#money mindset#future of money#finance#long term investing#cryptomadesimple
1 note
·
View note
Text
Why Every Crypto Trader Needs TradingView (Even If You’re Just Starting)
When I first got into crypto, I was overwhelmed. Between exchanges, wallets, coins, and candlesticks—I had no idea where to start. But the first tool that actually helped me feel in control was TradingView. I’ve used it for years now, and honestly? I don’t make a move without checking my charts there first. Whether you’re new to crypto or leveling up your trading game, this is one platform that…
#3commas#alerts#automate trading#charting software#crypto#crypto beginner#crypto strategy#Crypto Tools#Crypto trading#pine script#Technical analysis#Trading bots#TradingView
1 note
·
View note
Text
06/20/2025 - Gold & Silver Market News
Brought to you by the Free Bullion Investment Guide
06/20: Gold -2.3% from Record Week-End Price as Citi's 'Bearish' Calls Defies Coin-and-Bar Market Trends - Bullion Vault
06/20: Commodities weekly: Strength in energy and grains offsets pause in precious metals - SAXO
06/20: Gold forecast: XAU/USD off lows as stocks rebound and oil dips - Forex.com
06/20: The CFTC Delays Cot Reports Until Monday Due to Yesterday's Holiday - GoldSeek
06/20: WPIC discusses the 'structural deficit' in Platinum. - Redwood Associates
06/20: Gold: A New Regulatory Asset Class Under Basel III? - finews first
06/20: Is The Dollar's Death Greatly Exaggerated? - Zero Hedge
Thank you for your time. Take Care & God Bless, from the Free-Bullion-Investment-Guide.com
#silver prices#investing#silver#gold#technical analysis#charts#gold prices#financial news#gold investment news#news#platinum price
0 notes
Text
Stop Following Signals – Rethink Your Stock Market Learning Course
Are you truly learning to trade or just following instructions blindly? In our latest blog at Chart Monks, we dive deep into why most stock market learning courses train you to become a follower instead of an independent thinker. If you're relying on signals, tips, or preset strategies, you're not really trading — you're just reacting. This blog shows you how to break free from that cycle and build real trading skills based on price action and market psychology. Read now: Chart Monks. Call: +91-9220943789.
#Best Stock Market Courses Online#Stock Market Course For Professionals#Stock Market Learning Course#Stock Market Trading Courses Online#Stock Market Technical Analysis Course#Stock Market Training#Chart Monks
0 notes