#Research survey techniques
Explore tagged Tumblr posts
Visit Tumblr Blog
Explore Tumblr blogs with no restrictions, modern design and the best experience.
Last Seen Tumblr Blogs


Fun Fact
Users from the US are the majority of Tumblr visitors.
Text
5 Methods of Data Collection for Quantitative Research
Discover five powerful techniques for gathering quantitative data in research, essential for uncovering trends, patterns, and correlations. Explore proven methodologies that empower researchers to collect and analyze data effectively.
#Quantitative research methods#Data collection techniques#Survey design#Statistical analysis#Quantitative data analysis#Research methodology#Data gathering strategies#Quantitative research tools#Sampling methods#Statistical sampling#Questionnaire design#Data collection process#Quantitative data interpretation#Research survey techniques#Data analysis software#Experimental design#Descriptive statistics#Inferential statistics#Population sampling#Data validation methods#Structured interviews#Online surveys#Observation techniques#Quantitative data reliability#Research instrument design#Data visualization techniques#Statistical significance#Data coding procedures#Cross-sectional studies#Longitudinal studies
1 note
·
View note
Text
The study itself is titled, “Long-Term Regret and Satisfaction With Decision Following Gender-Affirming Mastectomy,” and sought to study the rate of regret and satisfaction after 2 years or more following gender affirming top surgery. The study’s results were stunning - in 139 surgery patients, the median regret score was 0/100 and the median satisfaction score was 5/5 with similar means as well. In other words… regret was virtually nonexistent in the study among post-op transgender people. In fact, the regret was so low that many statistical techniques would not even work due to the uniformity of the numbers: In this cross-sectional survey study of participants who underwent gender-affirming mastectomy 2.0 to 23.6 years ago, respondents had a high level of satisfaction with their decision and low rates of decisional regret. The median Satisfaction With Decision score was 5 on a 5-point scale, and the median decisional regret score was 0 on a 100-point scale. This extremely low level of regret and dissatisfaction and lack of variance in scores impeded the ability to determine meaningful associations among these results, clinical outcomes, and demographic information. The numbers are in line with many other studies on satisfaction among transgender people. Detransition rates, for instance, have been pegged at somewhere between 1-3%, with transgender youth seeing very low detransition rates. Surgery regret is in line with at least 27 other studies that show a pooled regret rate of around 1% - compare this to regret rates from things like knee surgery, which can be as high as 30%. Gender affirming care appears to be extremely well tolerated with very low instances of regret when compared to other medically necessary care.
[...]
The intense conservative backlash, to the point of disputing reputable scientific journals, likely stems from the fact that reduced regret rates weaken a central narrative these figures have championed in legal and legislative spaces. Over the past three years, anti-trans entities have showcased political detransitioners, reminiscent of the ex-gay campaigns from the 1990s and 2000s, to argue that regrets over gender transition and detransition are widespread. Some have even asserted detransition rates of up to 80%, a claim that has been broadly debunked. Yet, research consistently struggles to find substantial evidence supporting this narrative. The rarity of detransition and regret is underscored by Florida's inability to enlist a single resident to bear witness against a lawsuit challenging the state's ban on gender-affirming care.
20K notes
·
View notes
Text
"The coral reefs of south Sulawesi are some of the most diverse, colorful and vibrant in the world. At least, they used to be, until they were decimated by dynamite fishing in the 1990s.
As part of a team of coral reef ecologists based in Indonesia and the UK, we study the reefs around Pulau Bontosua, a small Indonesian island in south Sulawesi...
In many places around the world, damage like this might be described as irreparable. But at Pulau Bontosua, the story is different. Here, efforts by the Mars coral restoration program have brought back the coral and important ecosystem functions, as outlined by our new study, published in Current Biology. We found that within just four years, restored reefs grow at the same rate as nearby healthy reefs.
Speedy recovery
The transplanted corals grow remarkably quickly. Within a year, fragments have developed into proper colonies. After two years, they interlock branches with their neighbors. After just four years, they completely overgrow the reef star structures and restoration sites are barely distinguishable from nearby healthy reefs.
The combined growth of many corals generates a complex limestone (calcium carbonate) framework. This provides a habitat for marine life and protects nearby shorelines from storm damage by absorbing up to 97% of coastal wave energy.
We measured the overall growth of the reef framework by calculating its carbonate budget. That's the balance between limestone production (by calcifying corals and coralline algae) and erosion (by grazing sea urchins and fishes, for example). A healthy reef produces up to 20kg of reef structure per square meter per year, while a degraded reef is shrinking rather than growing as erosion exceeds limestone production. Therefore, overall reef growth gives an indication of reef health.
At Pulau Bontosua, our survey data shows that in the years following restoration, coral cover, coral colony sizes, and carbonate production rates tripled. Within four years, restored reefs were growing at the same speed as healthy reefs, and thereby provided the same important ecosystem functions...
Outcomes of any reef restoration project will depend on environmental conditions, natural coral larvae supply, restoration techniques and the effort invested in maintaining the project. This Indonesian project shows that when conditions are right and efforts are well placed, success is possible. Hopefully, this inspires further global efforts to restore functioning coral reefs and to recreate a climate in which they can thrive."
-via Phys.org, March 11, 2024
#coral#coral reef#marine life#marine biology#sea creatures#aquatic#environment#ecology#environmental news#environmental science#climate action#climate hope#ecosystem#conservation#endangered species#indonesia#sulawesi#good news#hope#overfishing#hopepunk#hope posting
6K notes
·
View notes
Text
NB-IoT Smart Meter Market

#NB-IoT Smart Meter Market Overview:#Global NB-IoT Smart Meter Market research provides insights into consumer behavior#industry trends#and market competition through the use of various research techniques#including surveys#interviews#and data analysis. The industry serves a wide range of clients#including businesses#government agencies#and non-profit organizations. NB-IoT Smart Meter Market is highly diverse#with a range of services and specialties#including quantitative and qualitative research#brand research#product testing#customer satisfaction research#and competitive analysis.
0 notes
Text
study methods

the second brain method
this method focuses on organizing the information you learn to maximize effectiveness. a common way of doing this is through the CODE method:
capture - be quick and efficient in how you receive the information
organize - organize the information in a way that works for you
distill - break the information down to its key elements
express - apply the information you’ve learned
* there is a ton of information out there about this method. if you struggle with burnout and knowing where to start, i recommend researching this method further to figure out what works for you.
the pomodoro method
the pomodoro method is a time management method. the most common expression of this method is to pick a task, work for 25 minutes on that task, then take a break for 5 minutes. then, repeat. if you’re planning to work all day, you may up the time spent studying. for example, after a while of this, you may work for 30 minutes at a time, then 40, then 45, and so forth. this method is particularly good for when you’re feeling unmotivated or having a hard time focusing. if you’re still not feeling it after a while, you may start to take longer breaks. for example, you may study for 30 minutes, break for 15, and keep going like that.
the 5 minute rule method
this method is good for when you have to do a shorter task, but you’re procrastinating doing it. this method requires you to dedicate only 5 minutes to do your task. after that, you may stop, but chances are, once you’ve started, finishing won’t be as difficult.
the blurting method
this method is particularly good for revision. the blurting method requires you to read over the content you are learning, then put it away and write down everything you know or can remember. then, check the content and revise everything you didn’t write down.
spaced repetition
spaced repetition requires you to spread out your study reviews over the period of a few days. this has been shown to improve memory. rather than studying one thing at a time, then studying something else the next day and so on, review the information right after you’ve learned it, then recall it after a few hours, then a few days, then a few weeks, and so on. if you’re studying something you will need to remember for an extended period of time, this method would be perfect for you!
active recall
this is my absolute favorite method! it’s been shown to improve your studying immensely and so many people have benefited from practicing active recall. active recall involves retrieving information from your brain, usually done through questions. a good way to do this is to explain the concept to yourself, to someone else, or act like you’re doing a presentation on the subject. after you’ve recalled all of the information you know about the subject, go over your material again and be sure you covered everything and explained everything the best way you could. if you didn’t, review everything you did not remember or got wrong, and go again. do this until you get everything. doing this can also be referred to as the feynman technique.
the SQ3r method
survey - skim your text and identify bolded text, headers, images, etc.
question - generate questions about the text based on what you surveyed. what are the key concepts in this text? what is each paragraph about? what information do i need to take away from this text?
read - read through the entire text and answer the questions you created
recite - summarize what you learned in your own words
review - recall the key concepts and answers to your questions
#girlblog#girlblogger#dream girl#girlblogging#that girl#self care#self love#glow up#it girl#becoming that girl#self development#self improvement#study#study tips#study blog#studyspo#study aesthetic#studyblr#study motivation#studyinspo#motivation#productivity#school#romanticizing school#academic validation#academia#pink academia#pink#academia aesthetic#light academia
4K notes
·
View notes
Text
Writing Notes: Psychological Distancing

Psychological Distance - the degree of a person’s detachment or disengagement from emotional involvement with one or more other people.
Types of Psychological Distancing
Trope, Liberman, & Wakslak (2007) describe 4 types of psychological distancing:
Time: We think about events that are far in the future differently compared to activities that will happen soon. For events in the distant future, we use more abstract terms (e.g., “Paying off my credit card”) compared to near-future events (e.g., “Paying $100 towards my credit card each month”).
Space: We use more abstract terms to describe events that occur within a physically near space than events that happen in a space that is further away.
Social distance: When we describe someone dissimilar to us, then we use more abstract qualities and descriptors (i.e., increasing the distance between them and us) than when describing someone similar to us.
Hypotheticality: (i.e., likelihood) We use more abstract words and terms to describe events that are less likely to happen (i.e., events with a considerable distance) compared to events that are more likely to happen (i.e., events with a small distance).
The concept of psychological distancing is meant to describe our ability to “step back and without an immediate response, survey the environment, and reflect on the course of action instead of being dominated by immediate simulation” (Giesbrecht, Müller, & Miller, 2010, p. 337).
There are 3 main streams among the existing body of research about psychological distancing:
Psychological distancing can refer to the temporal distancing of events in time. For example, events in the distant future are treated differently compared to events in the near future (Trope & Liberman, 2003).
Psychological distancing describes our ability to separate ourselves from people whom we dislike. Specifically, we create space between ourselves and someone else who we perceive as undesirable (Schimel, Pyszczynski, Greenberg, O’Mahen, & Arndt, 2000).
Psychological distancing is rooted in developmental psychology and describes how children create space between their actions and their immediate environment (Giesbrecht et al., 2010).
The first and third streams are the roots of psychological distancing referred here. Together, they suggest the same thing: increasing the distance between ourselves and something else so that we can change the way we approach and think about the current situation.
Therefore, psychological distancing is a psychological technique where we step away from a situation or position so that we can gain perspective.
Gaining perspective through psychological distancing can refer to various outcomes.
For example, perspective can refer to long-term aspects of planning. By gaining perspective, we are better able to define goals and meet deadlines.
Perspective can also refer to the weakened clutch of negative emotions. For example, your partner might do something that makes your blood boil. However, when you gain psychological distancing, you may realize that their behavior did not justify the intense emotional reaction that you felt.
In summary, psychological distancing acts like a wide-angle lens. It allows us to zoom out from our narrow, magnified experience so that we can see events and experiences as part of a more extensive process.
Sources: 1 2 ⚜ More: Notes & References ⚜ Writing Resources PDFs
#writing reference#psychology#writeblr#character development#literature#writers on tumblr#words#lit#dark academia#studyblr#character building#writing prompt#poets on tumblr#langblr#word list#spilled ink#creative writing#writing inspiration#william-adolphe bouguereau#writing resources
63 notes
·
View notes
Text

A/N: Happy Birthday Ju!!!!! (@perfectanamentality) I hope you enjoy ur birthday to the fullest!! Hope you like my gift🥺
CROCHETED LOVE - T.I.
warnings: none <3
I wrote Nanami in here and he has a wife<3
“Nanami! You gotta help me, please!” Ino’s desperate voice can be heard shrilling over the line.
Nanami visibly sighed, “I’ll be there in a few minutes.” Groaning, he hangs up and hops up off the couch.
Mrs. Nanami giggled at the sight of her husband grabbing his coat and keys. “Takuma needs help again?”
He embraced his wife, “Yes, indeed. It’s his girlfriend's birthday today, and he wants to make her something handmade.”
“Why didn’t he do so earlier?”
“He needed to wait until she was hanging out with her friends that way he could do so uninterrupted.”
His wife giggles again, “Well, let’s go save the poor boy.”
Ino swings the door open in a panicked frenzy. He’s covered in multiple colors of yarn, and his always-askewed beanie is now even more out of place.
“Nice! You bought Mrs. Nanami!” Ino shrugged off the yarn and stepped to the side to let them in.
Nanami’s wife surveys the damage. Yarn and scrapped projects were everything.
Nanami sighed for the 47th time today and went to the kitchen to make some coffee. Nanami and his wife were special guests, they could come over anytime and do whatever.
“Kento mentioned you were hand-making something for your girlfriend, is that correct?” His wife picks up a failed attempt at a scarf, or is it a hat?
“That’s right. She’s always making handmade things for me, so I wanted to do the same. Instead of just buying her something at the store, y’know?”
Nanami’s wife had slight tears in her eyes. It was so sweet, what Ino was doing for you. She had met you quite often. You were quite crafty with your hands, always carrying a ball of yarn with you.
She remembers the day that her wedding dress arrived torn apart the day before her wedding with Nanami. She was so devastated, that she was going to cancel in the morning, but only to wake up to find you passed out next to her now-fixed wedding dress.
You stayed up that night to fix her dress, she owes you so much.
“Alright! Let’s do this!” She was pumped up.
Nanami’s wife and Ino spent hours researching easy techniques, and he got better, by a little.
In the end, he managed to crochet a little frog chain key for you, but he scraped it. He wished he paid more attention to what you were doing when he was admiring you.
You returned home after a long day with your friends, Ino greeted you at the door with open arms.
“Hi, baby! How was it hanging with the girls?” He guided you to the couch, letting you relax after a long day.
He brings over a small cake from the fridge and sits next to you.
You eagerly thank your boyfriend for the cake and he sets a small gift box on the coffee table in front of you.
“Aww! Babe, I told you not to buy me anything this year!” You giggle, lightly hitting his arm.
“I didn’t, I made you something this year.” Your eyes widened when he said that.
“What? Y-you made me something?”
You reach for the small box and open it.
It was a small keychain for your messenger bag. It was a tiny frog with big, uneven eyes and a tiny stub for a crown. It was also missing a leg too.
It wasn’t the prettiest, but it was the best damn gift you have ever received.
No one ever took the time or energy to craft anything for you.
Tears well up, and panic ensues within Ino.
“Shit, baby! I’m sorry if it’s ugly, I’ll remake I promise.”
He tries to take it from your hands, but you clutch it close it your chest.
“No! It’s beautiful, Takuma. It’s just no one has ever did something like this for me.”
He chuckles, pulling you into his chest and planting a soft kiss on your forehead.
“Happy birthday, baby.” He whispered.
“Thank you, Takuma. I love you so much.”
“I love you too.”
#ino takuma#ino takuma x reader#ino x reader#ino takuma x you#jjk#takuma ino x reader#ino takuma smut#takuma ino#takuma ino smut#takuma smau#takuma smut#takuma x you#jjk takuma#jjk ino#jjk fluff#jjk imagines#kento nanami#nanami kento
40 notes
·
View notes
Text
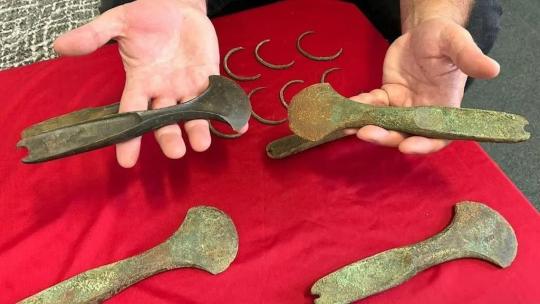
3,600-Year-Old Jewelry and Weapon Hoard Found Under Field in Czech Republic
Archaeologists used metal detectors to find the hoard, which includes several pieces of jewelry and weapons.
Archaeologists discovered a hoard of Bronze Age artifacts while doing routine survey work in a field in the Czech Republic.
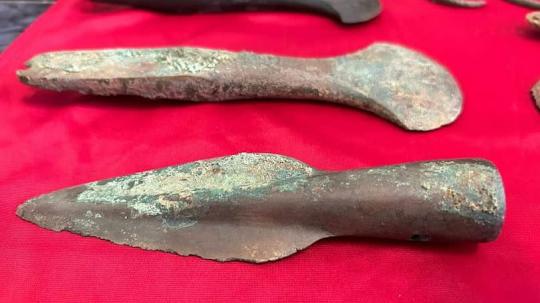
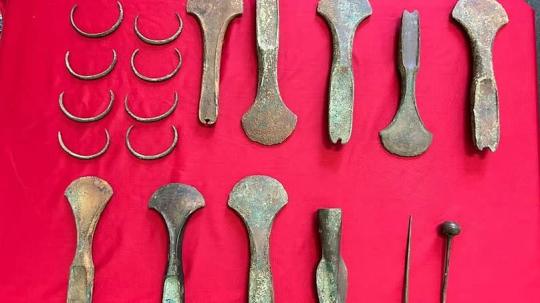
The bronze objects — which include eight arm rings, two pins, eight axes and one spearhead — were found near Budyně nad Ohří, a town about 35 miles (56 kilometers) northwest of Prague, Radio Prague International reported.
Researchers estimate that most of the items, which they found using metal detectors, date to around 1600 B.C.
"Most items are characteristic of the Middle Bronze Age, with only one ax belonging to the earlier period," Martin Trefný, an associate professor at the Museum of the Ř��p Region and the University of Jan Evangelista Purkyně and the curator of the hoard, said in an email. One ax is even older and dates to the Early Bronze Age.
"Axes could have been used as tools or weapons. The latter function also applies to the spearhead," Trefný said. "Bracelets were forearm ornaments, and pins served either to fasten clothing or, for example, to style women's hair."
Archaeologists remain unclear about why the hoard was buried, but they have proposed three possibilities.
"In the first case, the hoards are presumed to have a votive function, meaning they served as offerings to deities," Trefný said. "In the second case, we speak of an economic function, where hoards are interpreted as, for example, storage for manufacturers of the given items."
Alternatively, the buried items could reflect "a crisis situation, where it was necessary to hide the items, for example, from enemies," he said.
The treasure could be worth "millions of crowns," Trefný told Radio Prague International. (One million Czech crowns, or koruna, is about $42,500.)
"All the items testify to the technological advancement of bronze casters and processors in Central Europe 3,500 years ago," Trefný told Live Science. "The composition of the hoard also contributes to understanding the warfare, craft techniques and contemporary fashion of the time. Considering that hoards might have a ritual significance, they can also reveal a bit about the contemporary religion."
In the "near future," these found items will be on display at the Podřipské Museum, located about 30 miles (50 km) north of Prague, Radio Prague International reported.
By Jennifer Nalewicki.
#3600-Year-Old Jewelry and Weapon Hoard Found Under Field in Czech Republic#Budyně nad Ohří#metal detector#metal detecting finds#bronze#ancient artifacts#archeology#archeolgst#history#history news#ancient history#ancient culture#ancient civilizations#bronze age
113 notes
·
View notes
Text
The Science of Discovering the Past: Geophysical Archaeology

By Glab310 - Own work, CC BY 4.0, https://commons.wikimedia.org/w/index.php?curid=113524155
While much of archaeology involves unearthing artifacts, knowing where to find those sites requires research at the surface, as does mapping the site. Geophysical surveys help archaeologists know where to focus their efforts and help them avoid fruitless digs where no artifacts or remaining structures lie below the surface as well as avoiding the destruction of sites that are culturally sensitive, such as cemeteries.

By see above - http://www.archaeophysics.com/3030/index.htmlTransferred from en.wikipedia by SreeBot, Public Domain, https://commons.wikimedia.org/w/index.php?curid=17210746
There are many methods used to map below the surface, some of which can be done with little training while others meld multiple methods for a more complete map of what's under the surface. Those techniques that are more specialized were adapted from those used to explore for minerals. Mineral surveys seek to know what is deep beneath the surface and archaeological sites are relatively near the surface. These surveys also are focused on larger structures that would take a long time to unearth.

Source: https://sha.org/the-montpelier-minelab-experiment/2012/03/
Various methods of performing geophysical surveys and reveal different information. Metal detectors can be used to find caches of metal, but they don't give detailed information of what is below the surface. They can be used to discover new places to focus studies on. They work by inducing eddy currents, or a looping current between the detector and the metal in the ground, which causes a change in how the current flows in the machine, resulting in a signal being reported to the user, either through sound or visual output. Many locations have regulations or laws that dictate how metal detectors can be used and the ownership of those items found.

Public Domain, https://commons.wikimedia.org/w/index.php?curid=109641426
A more precise form of the this falls into two types: Electrical resistance meters and electromagnetic conductivity. Electrical resistance meters work by inserting probes into the soil through which electrical currents are passed and the resistance of the ground around them is detected, revealing the structures beneath as things like stone have different resistance than the soil around them. Electromagnetic conductivity is similar to metal detection in that a magnetic field is created by an electric field of a known frequency while detectors pick up the change. These detectors and currents are stronger than those of metal detectors with a related increase in size of the detector.

By Archaeo-Physics LLC - http://www.archaeophysics.com, Public Domain, https://commons.wikimedia.org/w/index.php?curid=36404337
Ground-penetrating radar uses electromagnetic pulses to detect what is under the surface in a way similar to how radar works in other applications. The pulses are reflected off items under the surface and recorded by the detector. It's possible to discover how things are layered beneath the surface because of the differences in reflections.

By Cargyrak - Own work, CC BY-SA 4.0, https://commons.wikimedia.org/w/index.php?curid=48685015
Lidar is an optical technique that uses light, usually lasers, to map the land. It has the ability to penetrate foliage, such as forest canopies, and allows features beneath the surface to be distinguished. This also allows features that are too large to be distinguished from the ground to be mapped. Lidar has the additional benefit of being easily integrated into Geographical Information Systems, integrated computer hardware and software systems that are used to analyze and visualize geographic data.
25 notes
·
View notes
Text
Also preserved in our archive (Daily updates!)
At least the tool we kinda have is accurate...
Wastewater surveillance has gained attention as an effective method for monitoring regional infection trends. In July 2024, the National Action Plan for Novel Influenza, etc. included the regular implementation of wastewater surveillance during normal times, with results to be published periodically in Japan. However, when viral concentrations in wastewater are measured inadequately or show significant variability, the correlation with actual infection trends may weaken. This study identified the necessary methods for accurately monitoring COVID-19 infection patterns.
The research team analyzed wastewater data obtained from the city of Sapporo in northern Japan between April 2021 and September 2023. The dataset featured high sensitivity (100 times greater than the standard method) and high reproducibility (standard deviation below 0.4 at log10 values) and was supported by a substantial sample size of 15 samples per week, totaling 1,830 samples over a sufficient survey period of two and a half years. The correlation coefficient between the number of infected individuals and the viral concentration in the wastewater was 0.87, indicating that this method effectively tracks regional infection trends. Additionally, the research team concluded desirable survey frequency requires at least three samples, preferably five samples, per week.
The study provides detailed guidance on wastewater surveillance methodologies for understanding infection trends, focusing on data processing, analytical sensitivity, and survey frequency. As wastewater surveillance during normal times becomes more widely implemented and its results increasingly published, this study's findings are expected to serve as valuable resources for decision making.
Source: Osaka University
Journal reference: Murakami, M., et al. (2024) Evaluating survey techniques in wastewater-based epidemiology for accurate COVID-19 incidence estimation. The Science of the Total Environment. doi.org/10.1016/j.scitotenv.2024.176702. www.sciencedirect.com/science/article/pii/S0048969724068591?via%3Dihub
#mask up#covid#pandemic#wear a mask#public health#wear a respirator#covid 19#still coviding#coronavirus#sars cov 2
44 notes
·
View notes
Text
Cluster Sampling: Types, Advantages, Limitations, and Examples
Explore the various types, advantages, limitations, and real-world examples of cluster sampling in our informative blog. Learn how this sampling method can help researchers gather data efficiently and effectively for insightful analysis.
#Cluster sampling#Sampling techniques#Cluster sampling definition#Cluster sampling steps#Types of cluster sampling#Advantages of cluster sampling#Limitations of cluster sampling#Cluster sampling comparison#Cluster sampling examples#Cluster sampling applications#Cluster sampling process#Cluster sampling methodology#Cluster sampling in research#Cluster sampling in surveys#Cluster sampling in statistics#Cluster sampling design#Cluster sampling procedure#Cluster sampling considerations#Cluster sampling analysis#Cluster sampling benefits#Cluster sampling challenges#Cluster sampling vs other methods#Cluster sampling vs stratified sampling#Cluster sampling vs random sampling#Cluster sampling vs systematic sampling#Cluster sampling vs convenience sampling#Cluster sampling vs multistage sampling#Cluster sampling vs quota sampling#Cluster sampling vs snowball sampling#Cluster sampling steps explained
0 notes
Text
Back for a spell

Alright, I'm not really back-back. I mean I haven't suddenly written another 1500 words on a tiny 5 minute segment of a single episode and spent countless hours making GIFs and audio clips to prove a point. Sorry.
But.
Do you remember, what seems like a very long time ago now, I said that I would be away for a bit because I was about to start getting VERY busy with an MSc? Yeah. That happened. It REALLY happened. I don't really sleep or see the outdoors anymore. And if the hubbie didn't cook for me, I probably wouldn't eat too much either. Anyway. The home straight is here! I am now writing my dissertation and what I came here to say was that I would really love it if there are any of you out there who would like to help me, I've written a little survey that forms part of my research. It should take about 20 minutes and it's about phishing training.
I promise (and I really do) this isn't some clever/obvious actual attempt to phish you - I really am doing an MSc in Cyber Security and my dissertation really is about how effective current phishing training techniques are.
If you're able to fill it out, great. If you want to share it so other people can do the same, also great!
I appreciate this probably isn't the sort of content you're accustomed to from me, but it's all I have right now. Outside of that, I actually can't wait to get back to writing GO stuff - I miss those boys so much!
For now though, I shall return back to the darkness behind my desk and say thank you to all in advance! Hopefully see you in *checks calendar* about... 10 weeks?
11 notes
·
View notes
Text
NASA tech to use moonlight to enhance measurements from space
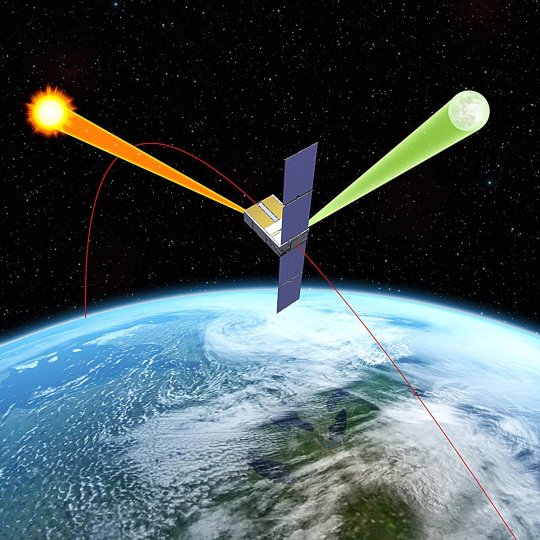
NASA will soon launch a one-of-a-kind instrument, called Arcstone, to improve the quality of data from Earth-viewing sensors in orbit. In this technology demonstration, the mission will measure sunlight reflected from the moon— a technique called lunar calibration. Such measurements of lunar spectral reflectance can ultimately be used to set a high-accuracy, universal standard for use across the international scientific community and commercial space industry.
To ensure satellite and airborne sensors are working properly, researchers calibrate them by comparing the sensor measurements against a known standard measurement. Arcstone will be the first mission exclusively dedicated to measuring lunar reflectance from space as a way to calibrate and improve science data collected by Earth-viewing, in-orbit instruments.
"One of the most challenging tasks in remote sensing from space is achieving required instrument calibration accuracy on-orbit," said Constantine Lukashin, principal investigator for the Arcstone mission and physical scientist at NASA's Langley Research Center in Hampton, Virginia.
"The moon is an excellent and available calibration source beyond Earth's atmosphere. The light reflected off the moon is extremely stable and measurable at a very high level of detail. Arcstone's goal is to improve the accuracy of lunar calibration to increase the quality of spaceborne remote sensing data products for generations to come."
Across its planned six-month mission, Arcstone will use a spectrometer—a scientific instrument that measures and analyzes light by separating it into its constituent wavelengths, or spectrum—to measure lunar spectral reflectance. Expected to launch in late June as a rideshare on a small CubeSat, Arcstone will begin collecting data, a milestone called first light, approximately three weeks after reaching orbit.
"The mission demonstrates a new, more cost-efficient instrument design, hardware performance, operations, and data processing to achieve high-accuracy reference measurements of lunar spectral reflectance," said Lukashin.
Measurements of lunar reflectance taken from the Earth's surface can be affected by interference from the atmosphere, which can complicate calibration efforts. Researchers already use the sun and moon to calibrate spaceborne instruments, but not at a level of precision and agreement that could come from having a universal standard.
Lukashin and colleagues want to increase calibration accuracy by getting above the atmosphere to measure reflected solar wavelengths in a way that provides a stable and universal calibration source. Another recent NASA mission, called the Airborne Lunar Spectral Irradiance mission, also used sensors mounted on high-altitude aircraft to improve lunar irradiance measurements from planes.
There is not an internationally accepted standard (SI-traceable) calibration for lunar reflectance from space across the scientific community or the commercial space industry.
"Dedicated radiometric characterization measurements of the moon have never been acquired from a space-based platform," said Thomas Stone, co-investigator for Arcstone and scientist at the U.S. Geological Survey (USGS). "A high-accuracy, SI-traceable lunar calibration system enables several important capabilities for space-based Earth observing missions, such as calibrating datasets against a common reference—the moon, calibrating sensors on-orbit, and the ability to bridge gaps in past datasets."
If the initial Arcstone technology demonstration is successful, a longer Arcstone mission could allow scientists to make the moon the preferred reference standard for many other satellites. The new calibration standard could also be applied retroactively to previous Earth data records to improve their accuracy or fill in data gaps for data fields. It could also improve high-precision sensor performance on-orbit, which is critical for calibrating instruments that may be sensitive to degradation or hardware breakdown over time in space.
"Earth observations from space play a critical role in monitoring the environmental health of our planet," said Stone. "Lunar calibration is a robust and cost-effective way to achieve high accuracy and inter-consistency of Earth observation datasets, enabling more accurate assessments of Earth's current state and more reliable predictions of future trends."
IMAGE: NASA's Arcstone instrument will be the first mission exclusively dedicated to measuring moonlight, or lunar reflectance, from space as a way to calibrate and improve science data collected by Earth-viewing, in-orbit instruments. Credit: Blue Canyon Technologies
11 notes
·
View notes
Text
Time Travel Question 54: Ancient World and Earlier
If you could travel through time, but only to see something for Research or for Fun, not to change anything, what would you pick? Yes, you may have a Babel Fish in your ear to translate.
These Questions are the result of suggestions a the previous iteration. This category may include suggestions made too late to fall into the correct earlier time grouping. In some cases a culture lasted a really long time and I grouped them by whether it was likely the later or earlier grouping made the most sense with the information I had.
Please add new suggestions below if you have them for future consideration. All cultures and time periods welcome.
#Time Travel#Middle Ages#Ancient World#Early Humans#Neanderthal#Denisovans#Homins#Paleolithic#Prehistory#Megafauna#Extinct Species#Domestication#The Clovis People#Indigenous History#Ancient Egypt#Nefertiti#History of Music#Antikythera device#Ancient Greece#History of Food#Wootz Steelmaking technique#History of India#Old Testament
48 notes
·
View notes
Text
A group of international researchers say they're getting closer and closer to identifying the possible remains of Noah’s Ark – and new test results are promising.
The focus of the research, the Durupinar site in eastern Turkey, was first identified in the 1950s.
For decades, it's been speculated that the boat-shaped site once harbored Noah's Ark, but no definitive proof has emerged. Now, an organization called Noah's Ark Scans believes that recent soil samples point toward the site once housing "ancient wood."
Researchers collected soil samples from the site last September and analyzed them through this winter. The results "show significantly higher levels of organic matter and potassium compared to surrounding areas," according to a recent statement from the organization.
"[The results] provide compelling evidence of a unique, potentially man-made structure beneath the surface, distinct from the surrounding mudflow," Noah's Ark Scans said.
"These findings suggest the presence of decayed wood or other organic materials, consistent with a large, ancient structure preserved within the mudflow," the statement added.
Lead archaeological researcher Andrew Jones told Fox News Digital that researchers are registering 2.72 times more carbon inside the "boat-shaped object" compared to its immediate outside location.
"The soil composition is markedly different from the natural mudflow, indicating something extraordinary at this site."
"The rotting ancient wood inside the boat-shaped area is likely creating a localized soil microenvironment by lowering pH … increasing organic matter [and] elevating potassium," he said.
"Rotting wood directly contributes to soil organic matter," he added.
"As wood decomposes, it breaks down into humus, a stable form of organic matter rich in carbon. This increases the organic matter content in the soil where the wood is located."
In a statement, soil scientist William Crabtree said the results indicate "something extraordinary."
"The soil composition is markedly different from the natural mudflow, indicating something extraordinary at this site," Crabtree stated.
But not all proof of the hypothesis is scientific. The 515-foot-long formation "aligns exactly with the biblical dimensions of Noah’s Ark," according to Noah's Ark Scans.
"Unlike the surrounding volcanic mudflow, the site’s unique soil and subsurface anomalies set it apart," the project noted.
The research builds on previous 3-D ground penetrating radar scans from 2019 that "struck subsurface features," and found anomalies.
"The scans show a 234-foot central corridor and angular structures – potentially rooms or corridors – extending up to 20 feet deep," the project noted in a statement. "These right-angled formations, uncommon in natural geological processes, suggest intentional design. "
Jones said the "presence of hallways and room-like structures points to a man-made origin for the boat shape."
"The re-analysis confirms what we suspected: These are not random shapes in the mudflow," Jones said.
Though no excavations are planned this year, Jones told Fox News Digital the analysis of the site will continue, with additional geophysical surveys and possible core drilling slated for next year.
"We are focused on more non-destructive techniques to understand what's below the ground and more soil analysis as well," Jones said.
The expert added, "Our plan is to do a much larger soil test and take deeper samples from the ground."
#nunyas news#this could be really cool if it's something#but the odds of that are obscenely low#still cool tho
9 notes
·
View notes
Text
A Mayan city lost in the dense jungle of southern Mexico has been revealed. The discovery occurred in the southeastern state of Campeche, and archaeologists have named it Valeriana, after a nearby freshwater lagoon.
“The larger of Valeriana's two monumental precincts has all the hallmarks of a classic Mayan political capital: enclosed plazas connected by a broad causeway; temple pyramids; a ball court; a reservoir formed by damming an arroyo (a seasonal watercourse); and a probable E-Group assemblage, an architectural arrangement that generally indicates a founding date prior to AD 150,” says the study, published in the journal Antiquity.
The city's discovery didn't require breaking through the jungle with machetes or patiently excavating with brushes and spatulas. Nor did researchers need tape measures, binoculars, or compasses to find their way through the thick foliage. Instead, they employed state-of-the-art technology: lasers, drones, and satellite maps. With these tools, they discovered a city hidden for centuries beneath the thick Mexican jungle, unearthing pyramids, enclosed plazas, and an ancient reservoir.
Luke Auld-Thomas, an anthropologist at Northern Arizona University, made the discovery. His analysis revealed a huge network of previously unexplored settlements.
Auld-Thomas and his fellow researchers have succeeded in mapping the city beneath the jungle thanks to airborne laser scanning, better known as lidar (light detection and ranging), a remote-sensing technique that uses pulsed lasers and other data collected through flyovers that can generate accurate three-dimensional models of surface features, revolutionizing the way archaeologists explore the hidden past.
Laser pulses generate a topographic map in a manner similar to how a bat uses echolocation: Laser light is fired from an aircraft, bounces off objects on the ground, and returns to the detector located on the underside of the aircraft. In Mexico, although only a small fraction of the pulses pass through the dense jungle, the large number of pulses emitted allows enough light to reach the ground, creating a map with a resolution of up to 1 meter. Based on the timing and intensity of the returning pulses, the detector can map the contours of the terrain, revealing hills, ditches, and ancient ruins covered in vegetation. The technology is also being integrated into autonomous cars to help them avoid crashes.
“For a long time, our understanding of the Mayan civilization was limited to an area of a few hundred square kilometers,” Auld-Thomas says. “This limited sample was obtained with great effort, with archaeologists painstakingly scouring every square meter, hacking away at vegetation with machetes, only to discover they were standing on a pile of rocks that might have been someone's house 1,500 years ago.”
While Auld-Thomas knew that lidar could be a valuable tool, he was also aware of its high cost. Funders are often reluctant to invest in lidar surveys in areas where there is no visible evidence of Mayan settlement, despite the fact that this civilization reached its peak between 250 and 900 AD.
Campeche: A Center of Dense Urbanization Since the Mayan Era
In this case, the lidar data was originally collected over a decade ago, for completely unrelated purposes. The scans were completely in 2013 by the Mexican firm CartoData, using a Riegl LMS-Q780 sensor. Processing was carried out by the Woods Hole Research Center (WHRC), and the data was made publicly available a few years later by the M-REDD+ Alliance.
The dataset includes three transects and three study blocks. The transects have an approximate width of 275 meters and a total length of 213 kilometers, covering an area of 58.3 square kilometers. The survey blocks cover a total area of 64.1 square kilometers, distributed in three locations: south of the town of Xpuhil, near the archaeological site of Río Bec; near the villages of Dos Lagunas and Bel Ha; and near the town of Ucum, in northern Campeche.
The study mentions that the analysis of 6,764 structures in the lidar data blocks reveals a settlement density of 55.3 structures per square kilometer, comparable to other research in the region. These data are useful for assessing settlement density on a regional scale and exceed values recorded in Belize and Guatemala. However, they do not provide a complete picture of the level of urbanization, which requires analysis of local variability and density gradients. For this purpose, a kernel density estimation was applied to the study blocks, the results of which are consistent with the densities recorded in other Mayan archeological sites such as Oxpemul and Becan.
Archeologists in the 20th century were correct in stating that the interior of Campeche is a substantially anthropogenic landscape, i.e., human-modified, with urbanized areas where rural populations interacted with dense cities. Settlement density data, ranging from 49 to 61 structures per square kilometer, indicate that cities and dense settlements are common in large parts of the central Maya lowlands. New discoveries, such as the city of Valeriana, reinforce this view, showing that urbanization was a widespread phenomenon in the region.
Archaeologists increasingly recognize that the world's tropics and subtropics hosted a wide variety of urban forms in antiquity. Many of these settlements followed a pattern of spatial dispersion, commonly called “low-density urbanism.” However, it is now being recognized that these urban landscapes were not uniform, but exhibited significant variations in settlement density, both within and around cities and between subregions.
At the same time, the growing body of research has revealed a greater abundance of settlements and cities than had previously been contemplated. This has generated a tension between two developments: On the one hand, the recognition of high variability in settlement density and, on the other, evidence of a more densely urbanized past than previously thought.
Although lidar was developed in the 1960s to study clouds and atmospheric particles, its application in archaeology is relatively recent. It was not until the last decade that archaeologists began employing it to unearth hidden landscapes. In 2009, archaeologists Diane and Arlen Chase of the University of Nevada, Las Vegas, pioneered the use of lidar to map a Mayan city, revolutionizing the way ancient civilizations are detected and studied.
According to the study, some researchers argue that the discovered landscapes reflect a high population density, while others suggest that the surveys are biased and overrepresent the most densely populated areas. This leaves open the question of whether as yet unexplored areas could confirm the existence of a higher urban density or show less dense occupation.
22 notes
·
View notes