#Data Analysis with Pandas and Python
Explore tagged Tumblr posts
Visit Tumblr Blog
Explore Tumblr blogs with no restrictions, modern design and the best experience.
Last Seen Tumblr Blogs


Fun Fact
Premium Tumblr themes are available from anywhere between $9 to $49.
Text
Blog Entry for Assignment: Frequency Distributions and Data Analysis
The Program Below is the program I used to analyze the dataset. The code imports the dataset, selects relevant columns, and generates frequency distributions for three chosen variables.
import pandas as pd
#Load the dataset
file_path = r'C:\Users\kauanand\Downloads\gapminder.csv' data = pd.read_csv(file_path)
#Display the first few rows and column names to understand the dataset structure
print(data.head()) print(data.columns)
#Select relevant columns for frequency distributions
selected_columns = ['incomeperperson', 'alcconsumption', 'lifeexpectancy']
#Generate frequency distributions, including missing values
for column in selected_columns: print(f"Frequency Distribution for {column}:\n") print(data[column].value_counts(dropna=False)) print("\n")
Output:
country incomeperperson … employrate urbanrate 0 Afghanistan … 55.7000007629394 24.04 1 Albania 1914.99655094922 … 51.4000015258789 46.72 2 Algeria 2231.99333515006 … 50.5 65.22 3 Andorra 21943.3398976022 … 88.92 4 Angola 1381.00426770244 … 75.6999969482422 56.7
[5 rows x 16 columns] Index(['country', 'incomeperperson', 'alcconsumption', 'armedforcesrate', 'breastcancerper100th', 'co2emissions', 'femaleemployrate', 'hivrate', 'internetuserate', 'lifeexpectancy', 'oilperperson', 'polityscore', 'relectricperperson', 'suicideper100th', 'employrate', 'urbanrate'], dtype='object') Frequency Distribution for incomeperperson:
incomeperperson 23 6243.57131825833 1 268.259449511417 1 26551.8442381829 1 14778.1639288175 1 .. 13577.8798850901 1 20751.8934243568 1 5330.40161203986 1 1860.75389496662 1 320.771889948584 1 Name: count, Length: 191, dtype: int64
Frequency Distribution for alcconsumption:
alcconsumption 26 .1 2 .34 2 5.92 2 3.39 2 .. 12.14 1 3.11 1 11.01 1 10.71 1 4.96 1 Name: count, Length: 181, dtype: int64
Frequency Distribution for lifeexpectancy:
lifeexpectancy 22 73.979 2 72.974 2 81.097 1 62.465 1 .. 79.915 1 75.956 1 79.839 1 76.142 1 51.384 1 Name: count, Length: 190, dtype: int64
Here’s a breakdown of the results:
1. Frequency Distribution for incomeperperson:
The column incomeperperson contains continuous values, so you see several unique values with their counts. For example:
23 appears 1 time,
6243.57131825833 appears 1 time,
268.259449511417 appears 1 time,
... (and so on).
The incomeperperson column has 191 unique values as shown by Length: 191.
2. Frequency Distribution for alcconsumption:
The column alcconsumption also contains continuous data, with some common values appearing multiple times. For example:
26 appears 1 time,
.1 appears 2 times,
.34 appears 2 times,
5.92 appears 2 times,
... (and so on).
This column has 181 unique values as shown by Length: 181.
3. Frequency Distribution for lifeexpectancy:
The column lifeexpectancy contains values representing life expectancy, and you see unique values with their respective counts. For example:
22 appears 1 time,
73.979 appears 2 times,
72.974 appears 2 times,
81.097 appears 1 time,
... (and so on).
This column has 190 unique values as shown by Length: 190.
Summary of the frequency distributions based on the data for the selected variables:
Income per person (incomeperperson):
The values in this column are continuous and vary widely, with several unique values across different income levels.
Most values appear only once, indicating a diverse range of income per person across the countries in the dataset.
There are some repeated values, but they are relatively few, suggesting a wide spread of income levels.
Missing data is not explicitly shown in the frequency distribution, but you can check for NaN values using .isnull().sum() to confirm if any missing data exists.
Alcohol consumption (alcconsumption):
Similar to income, alcohol consumption values are mostly continuous, and the column contains various unique values for alcohol consumption levels.
Some values, like 0.1 and 5.92, are repeated multiple times, suggesting that these alcohol consumption levels are observed across multiple countries.
This column also contains a range of values, some of which may be missing or represented as NaN. To confirm this, you'd need to check for missing values.
Life expectancy (lifeexpectancy):
Life expectancy values also vary across the dataset, with many unique values, indicating differences in life expectancy among the countries.
Some life expectancy values, like 73.979 and 72.974, are repeated, which could represent several countries sharing the same life expectancy.
Missing data might be present, though the distribution suggests that life expectancy values are fairly well populated across the dataset.
In Conclusion:
All three variables contain a wide range of unique values, with a few repetitions, particularly in the cases of alcconsumption and lifeexpectancy, where certain values appear in multiple countries.
There is no immediate evidence of missing data in the frequency distributions, but further checks for NaN values can confirm this.
0 notes
Text
Cracking Wordle (kinda) with Monte Carlo Simulations: A Statistical Approach to Predicting the Best Guesses
Wordle, the viral word puzzle game, has captivated millions worldwide with its simple yet challenging gameplay. The thrill of uncovering the five-letter mystery word within six attempts has led to a surge in interest in word strategies and algorithms. In this blog post, we delve into the application of the Monte Carlo method—a powerful statistical technique—to predict the most likely words in Wordle. We will explore what the Monte Carlo method entails, its real-world applications, and a step-by-step explanation of a Python script that harnesses this method to identify the best guesses using a comprehensive list of acceptable Wordle words from GitHub.
Understanding the Monte Carlo Method
What is the Monte Carlo Method?
The Monte Carlo method is a statistical technique that employs random sampling and statistical modeling to solve complex problems and make predictions. Named after the famous Monte Carlo Casino in Monaco, this method relies on repeated random sampling to obtain numerical results, often used when deterministic solutions are difficult or impossible to calculate.
How Does It Work?
At its core, the Monte Carlo method involves running simulations with random variables to approximate the probability of various outcomes. The process typically involves:
Defining a Model: Establishing the mathematical or logical framework of the problem.
Generating Random Inputs: Using random sampling to create multiple scenarios.
Running Simulations: Executing the model with the random inputs to observe outcomes.
Analyzing Results: Aggregating and analyzing the simulation outcomes to draw conclusions or make predictions.
Real-World Applications
The Monte Carlo method is widely used in various fields, including:
Finance: To evaluate risk and uncertainty in stock prices, investment portfolios, and financial derivatives.
Engineering: For reliability analysis, quality control, and optimization of complex systems.
Physics: In particle simulations, quantum mechanics, and statistical mechanics.
Medicine: For modeling the spread of diseases, treatment outcomes, and medical decision-making.
Climate Science: To predict weather patterns, climate change impacts, and environmental risks.
Applying Monte Carlo to Wordle
Objective
In the context of Wordle, our objective is to use the Monte Carlo method to predict the most likely five-letter words that can be the solution to the puzzle. We will simulate multiple guessing scenarios and evaluate the success rates of different words.
Python Code Explanation
Let's walk through the Python script that accomplishes this task.
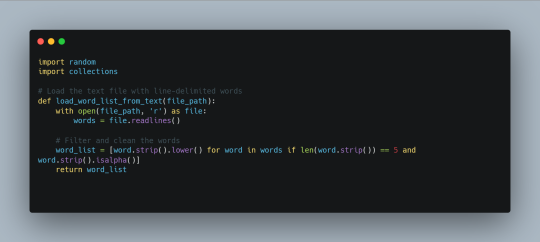
1. Loading the Word List
First, we need a comprehensive list of acceptable five-letter words used in Wordle. We can obtain the list of all 2315 words that will become the official wordle at some point. The script reads the words from a line-delimited text file and filters them to ensure they are valid.
2. Generating Feedback
To simulate Wordle guesses, we need a function to generate feedback based on the game's rules. This function compares the guessed word to the answer and provides feedback on the correctness of each letter.

3. Simulating Wordle Games
The simulate_wordle function performs the Monte Carlo simulations. For each word in the list, it simulates multiple guessing rounds, keeping track of successful guesses within six attempts.

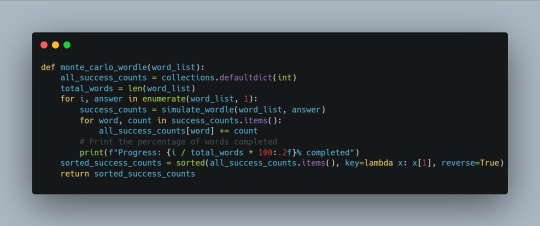
4. Aggregating Results
The monte_carlo_wordle function aggregates the results from all simulations to determine the most likely words. It also includes progress updates to monitor the percentage of words completed.
5. Running the Simulation
Finally, we load the word list from the text file and run the Monte Carlo simulations. The script prints the top 10 most likely words based on the simulation results.

The Top 50 Words (Based on this approach)
For this article I amended the code so that each simulation runs 1000 times instead of 100 to increase accuracy. I have also amended the script to return the top 50 words. Without further ado, here is the list of words most likely to succeed based on this Monte Carlo method:
trope: 10 successes
dopey: 9 successes
azure: 9 successes
theme: 9 successes
beast: 8 successes
prism: 8 successes
quest: 8 successes
brook: 8 successes
chick: 8 successes
batch: 7 successes
twist: 7 successes
twang: 7 successes
tweet: 7 successes
cover: 7 successes
decry: 7 successes
tatty: 7 successes
glass: 7 successes
gamer: 7 successes
rouge: 7 successes
jumpy: 7 successes
moldy: 7 successes
novel: 7 successes
debar: 7 successes
stave: 7 successes
annex: 7 successes
unify: 7 successes
email: 7 successes
kiosk: 7 successes
tense: 7 successes
trend: 7 successes
stein: 6 successes
islet: 6 successes
queen: 6 successes
fjord: 6 successes
sloth: 6 successes
ripen: 6 successes
hutch: 6 successes
waver: 6 successes
geese: 6 successes
crept: 6 successes
bring: 6 successes
ascot: 6 successes
lumpy: 6 successes
amply: 6 successes
eerie: 6 successes
young: 6 successes
glyph: 6 successes
curio: 6 successes
merry: 6 successes
atone: 6 successes
Edit: I ran the same code again, this time running each simulation 10,000 times for each word. You can find the results below:
bluer: 44 successes
grown: 41 successes
motel: 41 successes
stole: 41 successes
abbot: 40 successes
lager: 40 successes
scout: 40 successes
smear: 40 successes
cobra: 40 successes
realm: 40 successes
queer: 39 successes
plaza: 39 successes
naval: 39 successes
tulle: 39 successes
stiff: 39 successes
hussy: 39 successes
ghoul: 39 successes
lumen: 38 successes
inter: 38 successes
party: 38 successes
purer: 38 successes
ethos: 38 successes
abort: 38 successes
drone: 38 successes
eject: 38 successes
wrath: 38 successes
chaos: 38 successes
posse: 38 successes
pudgy: 38 successes
widow: 38 successes
email: 38 successes
dimly: 38 successes
rebel: 37 successes
melee: 37 successes
pizza: 37 successes
heist: 37 successes
avail: 37 successes
nomad: 37 successes
sperm: 37 successes
raise: 37 successes
cruel: 37 successes
prude: 37 successes
latch: 37 successes
ninja: 37 successes
truth: 37 successes
pithy: 37 successes
spiky: 37 successes
tarot: 36 successes
ashen: 36 successes
trail: 36 successes
Conclusion
The Monte Carlo method provides a powerful and flexible approach to solving complex problems, making it an ideal tool for predicting the best Wordle guesses. By simulating multiple guessing scenarios and analyzing the outcomes, we can identify the words with the highest likelihood of being the solution. The Python script presented here leverages the comprehensive list of acceptable Wordle words from GitHub, demonstrating how statistical techniques can enhance our strategies in the game.
Of course, by looking at the list itself it very rarely would allow a player to input the top 6 words in this list and get it right. It's probalistic nature means that although it is more probable that these words are correct, it is not learning as it goes along and therefore would be considered "dumb".
Benefits of the Monte Carlo Approach
Data-Driven Predictions: The Monte Carlo method leverages extensive data to make informed predictions. By simulating numerous scenarios, it identifies patterns and trends that may not be apparent through simple observation or random guessing.
Handling Uncertainty: Wordle involves a significant degree of uncertainty, as the correct word is unknown and guesses are constrained by limited attempts. The Monte Carlo approach effectively manages this uncertainty by exploring a wide range of possibilities.
Scalability: The method can handle large datasets, such as the full list of acceptable Wordle words from GitHub. This scalability ensures that the predictions are based on a comprehensive dataset, enhancing their accuracy.
Optimization: By identifying the top 50 words with the highest success rates, the Monte Carlo method provides a focused list of guesses, optimizing the strategy for solving Wordle puzzles.
Practical Implications
The application of the Monte Carlo approach to Wordle demonstrates its practical value in real-world scenarios. The method can be implemented using Python, with scripts that read word lists, simulate guessing scenarios, and aggregate results. This practical implementation highlights several key aspects:
Efficiency: The Monte Carlo method streamlines the guessing process by focusing on the most promising words, reducing the number of attempts needed to solve the puzzle.
User-Friendly: The approach can be easily adapted to provide real-time feedback and progress updates, making it accessible and user-friendly for Wordle enthusiasts.
Versatility: While this essay focuses on Wordle, the Monte Carlo method’s principles can be applied to other word games and puzzles, showcasing its versatility.
Specific Weaknesses in the Context of Wordle
Non-Deterministic Nature: The Monte Carlo method provides probabilistic predictions rather than deterministic solutions. This means that it cannot guarantee the correct Wordle word but rather offers statistically informed guesses. There is always an element of uncertainty.
2. Dependence on Word List Quality: The accuracy of predictions depends on the comprehensiveness and accuracy of the word list used. If the word list is incomplete or contains errors, the predictions will be less reliable.
3. Time Consumption: Running simulations for a large word list (e.g., thousands of words) can be time-consuming, especially on average computing hardware. This can limit its practicality for users who need quick results.
4. Simplified Feedback Model: The method uses a simplified model to simulate Wordle feedback, which may not capture all nuances of human guessing strategies or advanced linguistic patterns. This can affect the accuracy of the predictions.
The House always wins with Monte Carlo! Is there a better way?
There are several alternative approaches and techniques to improve the Wordle guessing strategy beyond the Monte Carlo method. Each has its own strengths and can be tailored to provide effective results. Here are a few that might offer better or complementary strategies:
1. Machine Learning Models
Using machine learning models can provide a sophisticated approach to predicting Wordle answers:
Neural Networks: Train a neural network on past Wordle answers and feedback. This approach can learn complex patterns and relationships in the data, potentially providing highly accurate predictions.
Support Vector Machines (SVMs): Use SVMs for classification tasks based on features extracted from previous answers. This method can effectively distinguish between likely and unlikely words.
2. Heuristic Algorithms
Heuristic approaches can provide quick and effective solutions:
Greedy Algorithm: This method chooses the best option at each step based on a heuristic, such as maximizing the number of correct letters or minimizing uncertainty. It's simple and fast but may not always find the optimal solution.
Simulated Annealing: This probabilistic technique searches for a global optimum by exploring different solutions and occasionally accepting worse solutions to escape local optima. It can be more effective than a greedy algorithm in finding better solutions.
3. Bayesian Inference
Bayesian inference provides a probabilistic approach to updating beliefs based on new information:
Bayesian Models: Use Bayes’ theorem to update the probability of each word being correct based on feedback from previous guesses. This approach combines prior knowledge with new evidence to make informed guesses.
Hidden Markov Models (HMMs): HMMs can model sequences and dependencies in data, useful for predicting the next word based on previous feedback.
4. Rule-Based Systems
Using a set of predefined rules and constraints can systematically narrow down the list of possible words:
Constraint Satisfaction: This approach systematically applies rules based on Wordle feedback (correct letter and position, correct letter but wrong position, incorrect letter) to filter out unlikely words.
Decision Trees: Construct a decision tree based on the feedback received to explore different guessing strategies. Each node represents a guess, and branches represent the feedback received.
5. Information Theory
Using concepts from information theory can help to reduce uncertainty and optimize guesses:
Entropy-Based Methods: Measure the uncertainty of a system using information entropy and make guesses that maximize the information gained. By choosing words that provide the most informative feedback, these methods can quickly narrow down the possibilities.
Whether you're a Wordle enthusiast or a data science aficionado, the Monte Carlo method offers a fascinating glimpse into the intersection of statistics and gaming. Happy Wordle solving!
1 note
·
View note
Text

Python data science libraries like NumPy, Pandas, and Matplotlib facilitate data manipulation, analysis, and visualization for effective insights and decision-making.
1 note
·
View note
Text
Reshaping and Pivot Tables in Pandas
Unlock the power of data manipulation with Pankaj's latest blog! 🚀 Discover the secrets of reshaping data and mastering pivot tables using Pandas in Python. 🐍 Dive in now and level up your data skills! 💡 #DataScience #Python #Pandas #DataManipulation
In this codes with Pankaj blog , we’ll explore how to reshape data and create pivot tables using Pandas, a powerful data manipulation library in Python. We’ll cover various methods such as pivot(), pivot_table(), stack(), unstack(), melt(), wide_to_long(), get_dummies(), from_dummies(), explode(), crosstab(), cut(), and factorize(). 1. pivot() and pivot_table() 2. stack() and unstack() 3.…

View On WordPress
#codeswithpankaj#coding#data-analysis#data-science#django#machine-learning#pandas#programming#python
1 note
·
View note
Text
Pandas DataFrame Pivot Table: Unlocking Efficient Data Analysis Techniques
Level up your data game with Pandas pivot tables! This guide shows you how to reshape data, uncover secrets, and impress your boss. 🪄 Let's get pivoting! #datascience #datasummary #pythontips
The Pandas DataFrame Pivot Table is a fundamental tool in data manipulation and analysis, allowing data professionals to restructure and summarize data for enhanced insights. By using the pivot_table() function within the Pandas library, users can aggregate and pivot their datasets based on specific parameters, resulting in a clearer visualization of the relationships within the data. This…
View On WordPress
#data-cleaning#data-exploration#data-insights#data-science#data-transformation#data-visualization#pandas-pivot-table#python-data-analysis
0 notes
Text
Python Packages for Data Science
youtube
Dive into the world of Data Science with our latest video. Whether you're new to data analysis or a seasoned pro, Python libraries are your secret to success. 🐍📉🤯
[Library 1: NumPy] "NumPy: Powerful Python library for efficient numerical data operations and arrays."
[Library 2: Pandas] "Pandas: Simplifies data manipulation and analysis with flexible data structures."
[Library 3: Matplotlib] "Matplotlib: Create stunning data visualizations, from basic to 3D graphs."
[Library 4: Scikit-Learn] "Scikit-Learn: Essential toolbox for machine learning, including classification and regression."
[Library 5: Seaborn] "Seaborn: Streamlines complex data visualization with high-level statistical graphics." https://ampersandacademy.com
0 notes
Text
instagram
Learning to code and becoming a data scientist without a background in computer science or mathematics is absolutely possible, but it will require dedication, time, and a structured approach. ✨👌🏻 🖐🏻Here’s a step-by-step guide to help you get started:
1. Start with the Basics:
- Begin by learning the fundamentals of programming. Choose a beginner-friendly programming language like Python, which is widely used in data science.
- Online platforms like Codecademy, Coursera, and Khan Academy offer interactive courses for beginners.
2. Learn Mathematics and Statistics:
- While you don’t need to be a mathematician, a solid understanding of key concepts like algebra, calculus, and statistics is crucial for data science.
- Platforms like Khan Academy and MIT OpenCourseWare provide free resources for learning math.
3. Online Courses and Tutorials:
- Enroll in online data science courses on platforms like Coursera, edX, Udacity, and DataCamp. Look for beginner-level courses that cover data analysis, visualization, and machine learning.
4. Structured Learning Paths:
- Follow structured learning paths offered by online platforms. These paths guide you through various topics in a logical sequence.
5. Practice with Real Data:
- Work on hands-on projects using real-world data. Websites like Kaggle offer datasets and competitions for practicing data analysis and machine learning.
6. Coding Exercises:
- Practice coding regularly to build your skills. Sites like LeetCode and HackerRank offer coding challenges that can help improve your programming proficiency.
7. Learn Data Manipulation and Analysis Libraries:
- Familiarize yourself with Python libraries like NumPy, pandas, and Matplotlib for data manipulation, analysis, and visualization.
For more follow me on instagram.
#studyblr#100 days of productivity#stem academia#women in stem#study space#study motivation#dark academia#classic academia#academic validation#academia#academics#dark acadamia aesthetic#grey academia#light academia#romantic academia#chaotic academia#post grad life#grad student#graduate school#grad school#gradblr#stemblog#stem#stemblr#stem student#engineering college#engineering student#engineering#student life#study
7 notes
·
View notes
Text
Python for Beginners: Launch Your Tech Career with Coding Skills
Are you ready to launch your tech career but don’t know where to start? Learning Python is one of the best ways to break into the world of technology—even if you have zero coding experience.
In this guide, we’ll explore how Python for beginners can be your gateway to a rewarding career in software development, data science, automation, and more.
Why Python Is the Perfect Language for Beginners
Python has become the go-to programming language for beginners and professionals alike—and for good reason:
Simple syntax: Python reads like plain English, making it easy to learn.
High demand: Industries spanning the spectrum are actively seeking Python developers to fuel their technological advancements.
Versatile applications: Python's versatility shines as it powers everything from crafting websites to driving artificial intelligence and dissecting data.
Whether you want to become a software developer, data analyst, or AI engineer, Python lays the foundation.
What Can You Do With Python?
Python is not just a beginner language—it’s a career-building tool. Here are just a few career paths where Python is essential:
Web Development: Frameworks like Django and Flask make it easy to build powerful web applications. You can even enroll in a Python Course in Kochi to gain hands-on experience with real-world web projects.
Data Science & Analytics: For professionals tackling data analysis and visualization, the Python ecosystem, featuring powerhouses like Pandas, NumPy, and Matplotlib, sets the benchmark.
Machine Learning & AI: Spearheading advancements in artificial intelligence development, Python boasts powerful tools such as TensorFlow and scikit-learn.
Automation & Scripting: Simple yet effective Python scripts offer a pathway to amplified efficiency by automating routine workflows.
Cybersecurity & Networking: The application of Python is expanding into crucial domains such as ethical hacking, penetration testing, and the automation of network processes.
How to Get Started with Python
Starting your Python journey doesn't require a computer science degree. Success hinges on a focused commitment combined with a thoughtfully structured educational approach.
Step 1: Install Python
Download and install Python from python.org. It's free and available for all platforms.
Step 2: Choose an IDE
Use beginner-friendly tools like Thonny, PyCharm, or VS Code to write your code.
Step 3: Learn the Basics
Focus on:
Variables and data types
Conditional statements
Loops
Functions
Lists and dictionaries
If you prefer guided learning, a reputable Python Institute in Kochi can offer structured programs and mentorship to help you grasp core concepts efficiently.
Step 4: Build Projects
Learning by doing is key. Start small:
Build a calculator
Automate file organization
Create a to-do list app
As your skills grow, you can tackle more complex projects like data dashboards or web apps.
How Python Skills Can Boost Your Career
Adding Python to your resume instantly opens up new opportunities. Here's how it helps:
Higher employability: Python is one of the top 3 most in-demand programming languages.
Better salaries: Python developers earn competitive salaries across the globe.
Remote job opportunities: Many Python-related jobs are available remotely, offering flexibility.
Even if you're not aiming to be a full-time developer, Python skills can enhance careers in marketing, finance, research, and product management.
If you're serious about starting a career in tech, learning Python is the smartest first step you can take. It’s beginner-friendly, powerful, and widely used across industries.
Whether you're a student, job switcher, or just curious about programming, Python for beginners can unlock countless career opportunities. Invest time in learning today—and start building the future you want in tech.
Globally recognized as a premier educational hub, DataMites Institute delivers in-depth training programs across the pivotal fields of data science, artificial intelligence, and machine learning. They provide expert-led courses designed for both beginners and professionals aiming to boost their careers.
Python Modules Explained - Different Types and Functions - Python Tutorial
youtube
#python course#python training#python#learnpython#pythoncourseinindia#pythoncourseinkochi#pythoninstitute#python for data science#Youtube
3 notes
·
View notes
Text
Why Learning Python is the Perfect First Step in Coding
Learning Python is an ideal way to dive into programming. Its simplicity and versatility make it the perfect language for beginners, whether you're looking to develop basic skills or eventually dive into fields like data analysis, web development, or machine learning.
Start by focusing on the fundamentals: learn about variables, data types, conditionals, and loops. These core concepts are the building blocks of programming, and Python’s clear syntax makes them easier to grasp. Interactive platforms like Codecademy, Khan Academy, and freeCodeCamp offer structured, step-by-step lessons that are perfect for beginners, so start there.
Once you’ve got a handle on the basics, apply what you’ve learned by building small projects. For example, try coding a simple calculator, a basic guessing game, or even a text-based story generator. These small projects will help you understand how programming concepts work together, giving you confidence and helping you identify areas where you might need a bit more practice.
When you're ready to move beyond the basics, Python offers many powerful libraries that open up new possibilities. Dive into pandas for data analysis, matplotlib for data visualization, or even Django if you want to explore web development. Each library offers a set of tools that helps you do more complex tasks, and learning them will expand your coding skillset significantly.
Keep practicing, and don't hesitate to look at code written by others to see how they approach problems. Coding is a journey, and with every line you write, you’re gaining valuable skills that will pay off in future projects.
FREE Python and R Programming Course on Data Science, Machine Learning, Data Analysis, and Data Visualization

#learntocode#python for beginners#codingjourney#programmingbasics#web development#datascience#machinelearning#pythonprojects#codingcommunity#python#free course
10 notes
·
View notes
Text
Python Libraries to Learn Before Tackling Data Analysis
To tackle data analysis effectively in Python, it's crucial to become familiar with several libraries that streamline the process of data manipulation, exploration, and visualization. Here's a breakdown of the essential libraries:
1. NumPy
- Purpose: Numerical computing.
- Why Learn It: NumPy provides support for large multi-dimensional arrays and matrices, along with a collection of mathematical functions to operate on these arrays efficiently.
- Key Features:
- Fast array processing.
- Mathematical operations on arrays (e.g., sum, mean, standard deviation).
- Linear algebra operations.
2. Pandas
- Purpose: Data manipulation and analysis.
- Why Learn It: Pandas offers data structures like DataFrames, making it easier to handle and analyze structured data.
- Key Features:
- Reading/writing data from CSV, Excel, SQL databases, and more.
- Handling missing data.
- Powerful group-by operations.
- Data filtering and transformation.
3. Matplotlib
- Purpose: Data visualization.
- Why Learn It: Matplotlib is one of the most widely used plotting libraries in Python, allowing for a wide range of static, animated, and interactive plots.
- Key Features:
- Line plots, bar charts, histograms, scatter plots.
- Customizable charts (labels, colors, legends).
- Integration with Pandas for quick plotting.
4. Seaborn
- Purpose: Statistical data visualization.
- Why Learn It: Built on top of Matplotlib, Seaborn simplifies the creation of attractive and informative statistical graphics.
- Key Features:
- High-level interface for drawing attractive statistical graphics.
- Easier to use for complex visualizations like heatmaps, pair plots, etc.
- Visualizations based on categorical data.
5. SciPy
- Purpose: Scientific and technical computing.
- Why Learn It: SciPy builds on NumPy and provides additional functionality for complex mathematical operations and scientific computing.
- Key Features:
- Optimized algorithms for numerical integration, optimization, and more.
- Statistics, signal processing, and linear algebra modules.
6. Scikit-learn
- Purpose: Machine learning and statistical modeling.
- Why Learn It: Scikit-learn provides simple and efficient tools for data mining, analysis, and machine learning.
- Key Features:
- Classification, regression, and clustering algorithms.
- Dimensionality reduction, model selection, and preprocessing utilities.
7. Statsmodels
- Purpose: Statistical analysis.
- Why Learn It: Statsmodels allows users to explore data, estimate statistical models, and perform tests.
- Key Features:
- Linear regression, logistic regression, time series analysis.
- Statistical tests and models for descriptive statistics.
8. Plotly
- Purpose: Interactive data visualization.
- Why Learn It: Plotly allows for the creation of interactive and web-based visualizations, making it ideal for dashboards and presentations.
- Key Features:
- Interactive plots like scatter, line, bar, and 3D plots.
- Easy integration with web frameworks.
- Dashboards and web applications with Dash.
9. TensorFlow/PyTorch (Optional)
- Purpose: Machine learning and deep learning.
- Why Learn It: If your data analysis involves machine learning, these libraries will help in building, training, and deploying deep learning models.
- Key Features:
- Tensor processing and automatic differentiation.
- Building neural networks.
10. Dask (Optional)
- Purpose: Parallel computing for data analysis.
- Why Learn It: Dask enables scalable data manipulation by parallelizing Pandas operations, making it ideal for big datasets.
- Key Features:
- Works with NumPy, Pandas, and Scikit-learn.
- Handles large data and parallel computations easily.
Focusing on NumPy, Pandas, Matplotlib, and Seaborn will set a strong foundation for basic data analysis.
9 notes
·
View notes
Text
Unlocking the Power of Data: Essential Skills to Become a Data Scientist

In today's data-driven world, the demand for skilled data scientists is skyrocketing. These professionals are the key to transforming raw information into actionable insights, driving innovation and shaping business strategies. But what exactly does it take to become a data scientist? It's a multidisciplinary field, requiring a unique blend of technical prowess and analytical thinking. Let's break down the essential skills you'll need to embark on this exciting career path.
1. Strong Mathematical and Statistical Foundation:
At the heart of data science lies a deep understanding of mathematics and statistics. You'll need to grasp concepts like:
Linear Algebra and Calculus: Essential for understanding machine learning algorithms and optimizing models.
Probability and Statistics: Crucial for data analysis, hypothesis testing, and drawing meaningful conclusions from data.
2. Programming Proficiency (Python and/or R):
Data scientists are fluent in at least one, if not both, of the dominant programming languages in the field:
Python: Known for its readability and extensive libraries like Pandas, NumPy, Scikit-learn, and TensorFlow, making it ideal for data manipulation, analysis, and machine learning.
R: Specifically designed for statistical computing and graphics, R offers a rich ecosystem of packages for statistical modeling and visualization.
3. Data Wrangling and Preprocessing Skills:
Raw data is rarely clean and ready for analysis. A significant portion of a data scientist's time is spent on:
Data Cleaning: Handling missing values, outliers, and inconsistencies.
Data Transformation: Reshaping, merging, and aggregating data.
Feature Engineering: Creating new features from existing data to improve model performance.
4. Expertise in Databases and SQL:
Data often resides in databases. Proficiency in SQL (Structured Query Language) is essential for:
Extracting Data: Querying and retrieving data from various database systems.
Data Manipulation: Filtering, joining, and aggregating data within databases.
5. Machine Learning Mastery:
Machine learning is a core component of data science, enabling you to build models that learn from data and make predictions or classifications. Key areas include:
Supervised Learning: Regression, classification algorithms.
Unsupervised Learning: Clustering, dimensionality reduction.
Model Selection and Evaluation: Choosing the right algorithms and assessing their performance.
6. Data Visualization and Communication Skills:
Being able to effectively communicate your findings is just as important as the analysis itself. You'll need to:
Visualize Data: Create compelling charts and graphs to explore patterns and insights using libraries like Matplotlib, Seaborn (Python), or ggplot2 (R).
Tell Data Stories: Present your findings in a clear and concise manner that resonates with both technical and non-technical audiences.
7. Critical Thinking and Problem-Solving Abilities:
Data scientists are essentially problem solvers. You need to be able to:
Define Business Problems: Translate business challenges into data science questions.
Develop Analytical Frameworks: Structure your approach to solve complex problems.
Interpret Results: Draw meaningful conclusions and translate them into actionable recommendations.
8. Domain Knowledge (Optional but Highly Beneficial):
Having expertise in the specific industry or domain you're working in can give you a significant advantage. It helps you understand the context of the data and formulate more relevant questions.
9. Curiosity and a Growth Mindset:
The field of data science is constantly evolving. A genuine curiosity and a willingness to learn new technologies and techniques are crucial for long-term success.
10. Strong Communication and Collaboration Skills:
Data scientists often work in teams and need to collaborate effectively with engineers, business stakeholders, and other experts.
Kickstart Your Data Science Journey with Xaltius Academy's Data Science and AI Program:
Acquiring these skills can seem like a daunting task, but structured learning programs can provide a clear and effective path. Xaltius Academy's Data Science and AI Program is designed to equip you with the essential knowledge and practical experience to become a successful data scientist.
Key benefits of the program:
Comprehensive Curriculum: Covers all the core skills mentioned above, from foundational mathematics to advanced machine learning techniques.
Hands-on Projects: Provides practical experience working with real-world datasets and building a strong portfolio.
Expert Instructors: Learn from industry professionals with years of experience in data science and AI.
Career Support: Offers guidance and resources to help you launch your data science career.
Becoming a data scientist is a rewarding journey that blends technical expertise with analytical thinking. By focusing on developing these key skills and leveraging resources like Xaltius Academy's program, you can position yourself for a successful and impactful career in this in-demand field. The power of data is waiting to be unlocked – are you ready to take the challenge?
3 notes
·
View notes
Text
Understanding Outliers in Machine Learning and Data Science

In machine learning and data science, an outlier is like a misfit in a dataset. It's a data point that stands out significantly from the rest of the data. Sometimes, these outliers are errors, while other times, they reveal something truly interesting about the data. Either way, handling outliers is a crucial step in the data preprocessing stage. If left unchecked, they can skew your analysis and even mess up your machine learning models.
In this article, we will dive into:
1. What outliers are and why they matter.
2. How to detect and remove outliers using the Interquartile Range (IQR) method.
3. Using the Z-score method for outlier detection and removal.
4. How the Percentile Method and Winsorization techniques can help handle outliers.
This guide will explain each method in simple terms with Python code examples so that even beginners can follow along.
1. What Are Outliers?
An outlier is a data point that lies far outside the range of most other values in your dataset. For example, in a list of incomes, most people might earn between $30,000 and $70,000, but someone earning $5,000,000 would be an outlier.
Why Are Outliers Important?
Outliers can be problematic or insightful:
Problematic Outliers: Errors in data entry, sensor faults, or sampling issues.
Insightful Outliers: They might indicate fraud, unusual trends, or new patterns.
Types of Outliers
1. Univariate Outliers: These are extreme values in a single variable.
Example: A temperature of 300°F in a dataset about room temperatures.
2. Multivariate Outliers: These involve unusual combinations of values in multiple variables.
Example: A person with an unusually high income but a very low age.
3. Contextual Outliers: These depend on the context.
Example: A high temperature in winter might be an outlier, but not in summer.
2. Outlier Detection and Removal Using the IQR Method
The Interquartile Range (IQR) method is one of the simplest ways to detect outliers. It works by identifying the middle 50% of your data and marking anything that falls far outside this range as an outlier.
Steps:
1. Calculate the 25th percentile (Q1) and 75th percentile (Q3) of your data.
2. Compute the IQR:
{IQR} = Q3 - Q1
Q1 - 1.5 \times \text{IQR}
Q3 + 1.5 \times \text{IQR} ] 4. Anything below the lower bound or above the upper bound is an outlier.
Python Example:
import pandas as pd
# Sample dataset
data = {'Values': [12, 14, 18, 22, 25, 28, 32, 95, 100]}
df = pd.DataFrame(data)
# Calculate Q1, Q3, and IQR
Q1 = df['Values'].quantile(0.25)
Q3 = df['Values'].quantile(0.75)
IQR = Q3 - Q1
# Define the bounds
lower_bound = Q1 - 1.5 * IQR
upper_bound = Q3 + 1.5 * IQR
# Identify and remove outliers
outliers = df[(df['Values'] < lower_bound) | (df['Values'] > upper_bound)]
print("Outliers:\n", outliers)
filtered_data = df[(df['Values'] >= lower_bound) & (df['Values'] <= upper_bound)]
print("Filtered Data:\n", filtered_data)
Key Points:
The IQR method is great for univariate datasets.
It works well when the data isn’t skewed or heavily distributed.
3. Outlier Detection and Removal Using the Z-Score Method
The Z-score method measures how far a data point is from the mean, in terms of standard deviations. If a Z-score is greater than a certain threshold (commonly 3 or -3), it is considered an outlier.
Formula:
Z = \frac{(X - \mu)}{\sigma}
is the data point,
is the mean of the dataset,
is the standard deviation.
Python Example:
import numpy as np
# Sample dataset
data = {'Values': [12, 14, 18, 22, 25, 28, 32, 95, 100]}
df = pd.DataFrame(data)
# Calculate mean and standard deviation
mean = df['Values'].mean()
std_dev = df['Values'].std()
# Compute Z-scores
df['Z-Score'] = (df['Values'] - mean) / std_dev
# Identify and remove outliers
threshold = 3
outliers = df[(df['Z-Score'] > threshold) | (df['Z-Score'] < -threshold)]
print("Outliers:\n", outliers)
filtered_data = df[(df['Z-Score'] <= threshold) & (df['Z-Score'] >= -threshold)]
print("Filtered Data:\n", filtered_data)
Key Points:
The Z-score method assumes the data follows a normal distribution.
It may not work well with skewed datasets.
4. Outlier Detection Using the Percentile Method and Winsorization
Percentile Method:
In the percentile method, we define a lower percentile (e.g., 1st percentile) and an upper percentile (e.g., 99th percentile). Any value outside this range is treated as an outlier.
Winsorization:
Winsorization is a technique where outliers are not removed but replaced with the nearest acceptable value.
Python Example:
from scipy.stats.mstats import winsorize
import numpy as np
Sample data
data = [12, 14, 18, 22, 25, 28, 32, 95, 100]
Calculate percentiles
lower_percentile = np.percentile(data, 1)
upper_percentile = np.percentile(data, 99)
Identify outliers
outliers = [x for x in data if x < lower_percentile or x > upper_percentile]
print("Outliers:", outliers)
# Apply Winsorization
winsorized_data = winsorize(data, limits=[0.01, 0.01])
print("Winsorized Data:", list(winsorized_data))
Key Points:
Percentile and Winsorization methods are useful for skewed data.
Winsorization is preferred when data integrity must be preserved.
Final Thoughts
Outliers can be tricky, but understanding how to detect and handle them is a key skill in machine learning and data science. Whether you use the IQR method, Z-score, or Wins
orization, always tailor your approach to the specific dataset you’re working with.
By mastering these techniques, you’ll be able to clean your data effectively and improve the accuracy of your models.
#science#skills#programming#bigdata#books#machinelearning#artificial intelligence#python#machine learning#data centers#outliers#big data#data analysis#data analytics#data scientist#database#datascience#data
4 notes
·
View notes
Text
Scope Computers
🚀 Become a Data Science Expert – From Basics to Breakthroughs! Step into one of the most in-demand careers of the 21st century with our cutting-edge Data Science Course. Whether you're starting fresh or upskilling, this course is your gateway to mastering data analysis, machine learning, and AI-powered insights.
🔍 What You’ll Learn:
Programming with Python – from zero to hero
Data wrangling & visualization with Pandas, Matplotlib, and Seaborn
Machine Learning algorithms with Scikit-learn
Deep Learning with TensorFlow & Keras
Real-world projects & case studies from finance, healthcare, and e-commerce
Tools like Power BI, SQL, and more
🎯 Why This Course Stands Out: ✔ Beginner-friendly with step-by-step guidance ✔ Taught by experienced data scientists ✔ Project-based learning to build your portfolio ✔ Interview prep, resume building, and placement assistance ✔ Recognized certification upon completion
💼 Whether you aim to become a Data Analyst, Data Scientist, or AI Developer, this course equips you with the practical skills and confidence to succeed in today’s data-driven world.
✨ Start your journey today—no prior coding experience needed!

#scopecomputers#training#science#datasciencetraining#sciencebasedtraining#DataScience#OfflineTraining#CareerBoost#JodhpurCourse#DataScienceTraining#pythoncode#pythonlearning#machinelearningalgorithms#machinelearningengineering#artificial_intelligence#datascientist#dataanalyst#javaprogrammer#sqldeveloper
2 notes
·
View notes
Text
How to Become a Data Scientist in 2025 (Roadmap for Absolute Beginners)

Want to become a data scientist in 2025 but don’t know where to start? You’re not alone. With job roles, tech stacks, and buzzwords changing rapidly, it’s easy to feel lost.
But here’s the good news: you don’t need a PhD or years of coding experience to get started. You just need the right roadmap.
Let’s break down the beginner-friendly path to becoming a data scientist in 2025.
✈️ Step 1: Get Comfortable with Python
Python is the most beginner-friendly programming language in data science.
What to learn:
Variables, loops, functions
Libraries like NumPy, Pandas, and Matplotlib
Why: It’s the backbone of everything you’ll do in data analysis and machine learning.
🔢 Step 2: Learn Basic Math & Stats
You don’t need to be a math genius. But you do need to understand:
Descriptive statistics
Probability
Linear algebra basics
Hypothesis testing
These concepts help you interpret data and build reliable models.
📊 Step 3: Master Data Handling
You’ll spend 70% of your time cleaning and preparing data.
Skills to focus on:
Working with CSV/Excel files
Cleaning missing data
Data transformation with Pandas
Visualizing data with Seaborn/Matplotlib
This is the “real work” most data scientists do daily.
🧬 Step 4: Learn Machine Learning (ML)
Once you’re solid with data handling, dive into ML.
Start with:
Supervised learning (Linear Regression, Decision Trees, KNN)
Unsupervised learning (Clustering)
Model evaluation metrics (accuracy, recall, precision)
Toolkits: Scikit-learn, XGBoost
🚀 Step 5: Work on Real Projects
Projects are what make your resume pop.
Try solving:
Customer churn
Sales forecasting
Sentiment analysis
Fraud detection
Pro tip: Document everything on GitHub and write blogs about your process.
✏️ Step 6: Learn SQL and Databases
Data lives in databases. Knowing how to query it with SQL is a must-have skill.
Focus on:
SELECT, JOIN, GROUP BY
Creating and updating tables
Writing nested queries
🌍 Step 7: Understand the Business Side
Data science isn’t just tech. You need to translate insights into decisions.
Learn to:
Tell stories with data (data storytelling)
Build dashboards with tools like Power BI or Tableau
Align your analysis with business goals
🎥 Want a Structured Way to Learn All This?
Instead of guessing what to learn next, check out Intellipaat’s full Data Science course on YouTube. It covers Python, ML, real projects, and everything you need to build job-ready skills.
https://www.youtube.com/watch?v=rxNDw68XcE4
🔄 Final Thoughts
Becoming a data scientist in 2025 is 100% possible — even for beginners. All you need is consistency, a good learning path, and a little curiosity.
Start simple. Build as you go. And let your projects speak louder than your resume.
Drop a comment if you’re starting your journey. And don’t forget to check out the free Intellipaat course to speed up your progress!
2 notes
·
View notes
Text
https://www.bipamerica.org/data-scientists-toolkit-top-python-libraries
A Data Scientist's toolkit heavily relies on Python libraries to handle data processing, analysis, and modeling. NumPy is essential for numerical computations and array operations, while Pandas provides powerful tools for data manipulation and analysis. Matplotlib and Seaborn are key for data visualization, enabling the creation of insightful charts and graphs.
5 notes
·
View notes
Text
What are the skills needed for a data scientist job?
It’s one of those careers that’s been getting a lot of buzz lately, and for good reason. But what exactly do you need to become a data scientist? Let’s break it down.
Technical Skills
First off, let's talk about the technical skills. These are the nuts and bolts of what you'll be doing every day.
Programming Skills: At the top of the list is programming. You’ll need to be proficient in languages like Python and R. These are the go-to tools for data manipulation, analysis, and visualization. If you’re comfortable writing scripts and solving problems with code, you’re on the right track.
Statistical Knowledge: Next up, you’ve got to have a solid grasp of statistics. This isn’t just about knowing the theory; it’s about applying statistical techniques to real-world data. You’ll need to understand concepts like regression, hypothesis testing, and probability.
Machine Learning: Machine learning is another biggie. You should know how to build and deploy machine learning models. This includes everything from simple linear regressions to complex neural networks. Familiarity with libraries like scikit-learn, TensorFlow, and PyTorch will be a huge plus.
Data Wrangling: Data isn’t always clean and tidy when you get it. Often, it’s messy and requires a lot of preprocessing. Skills in data wrangling, which means cleaning and organizing data, are essential. Tools like Pandas in Python can help a lot here.
Data Visualization: Being able to visualize data is key. It’s not enough to just analyze data; you need to present it in a way that makes sense to others. Tools like Matplotlib, Seaborn, and Tableau can help you create clear and compelling visuals.
Analytical Skills
Now, let’s talk about the analytical skills. These are just as important as the technical skills, if not more so.
Problem-Solving: At its core, data science is about solving problems. You need to be curious and have a knack for figuring out why something isn’t working and how to fix it. This means thinking critically and logically.
Domain Knowledge: Understanding the industry you’re working in is crucial. Whether it’s healthcare, finance, marketing, or any other field, knowing the specifics of the industry will help you make better decisions and provide more valuable insights.
Communication Skills: You might be working with complex data, but if you can’t explain your findings to others, it’s all for nothing. Being able to communicate clearly and effectively with both technical and non-technical stakeholders is a must.
Soft Skills
Don’t underestimate the importance of soft skills. These might not be as obvious, but they’re just as critical.
Collaboration: Data scientists often work in teams, so being able to collaborate with others is essential. This means being open to feedback, sharing your ideas, and working well with colleagues from different backgrounds.
Time Management: You’ll likely be juggling multiple projects at once, so good time management skills are crucial. Knowing how to prioritize tasks and manage your time effectively can make a big difference.
Adaptability: The field of data science is always evolving. New tools, techniques, and technologies are constantly emerging. Being adaptable and willing to learn new things is key to staying current and relevant in the field.
Conclusion
So, there you have it. Becoming a data scientist requires a mix of technical prowess, analytical thinking, and soft skills. It’s a challenging but incredibly rewarding career path. If you’re passionate about data and love solving problems, it might just be the perfect fit for you.
Good luck to all of you aspiring data scientists out there!
#artificial intelligence#career#education#coding#jobs#programming#success#python#data science#data scientist#data security
9 notes
·
View notes