#Data Science Management
Explore tagged Tumblr posts
Visit Tumblr Blog
Explore Tumblr blogs with no restrictions, modern design and the best experience.
Last Seen Tumblr Blogs


Fun Fact
1,644 Tumblr posts in 1 second.
Text
Integrating Data Science Management with Business Strategy: Aligning Goals and Objectives

#Data Science Management#PG Diploma in Data Science#PGDM in Data Science#Data Visualization#Artificial Intelligenc#Data-Driven Culture#Business Strategy in Data Science#Professional Development
1 note
·
View note
Text
Driving Business Transformation with Data Science: Case Studies and Insights

#Data Science Colleges in India#Business Growth#Data Science Management#Data Science Course#Industry Case Studies#Data Analytics#Artificial Intelligence#Emerging Technologies#Big Data
1 note
·
View note
Text
Fostering Innovation in Data Science: How PGDM Students Can Drive Change
#Data Science#Data Science Management#Colleges in India#Top Colleges in Bangalore#Data Science Courses#Management#Colleges for Data Science#Data Visualization#Certification Courses#Skills Development
1 note
·
View note
Text
Building a Data-Driven Organization: Lessons from Data Science Management

#Data Science#Data Science Management#Colleges in India#Top Colleges in Bangalore#Data Science Courses#Management#Colleges for Data Science#Data Visualization#Certification Courses#Skills Development
1 note
·
View note
Text


13/100 days of productivity
i am slowly getting my head above water, not only by getting things done but by realizing people don't secretly hate me (i know but be patient i only realized this yesterday)
academically speaking: python python python different types of regressions different models python python data tables APIs python python pyt*loses her mind*
#studyblr#university#uni#coffee#college#uni student#university student#bookblr#dark academia#information management#information science#library science#study inspiration#study studyspo#study motivation#100 days of productivity#uni inspiration#uni life#food#books#barista#uni motivation#international student#python#coding#data science#student#uni student aesthetic#studyblr aesthetic#uni aesthetic
47 notes
·
View notes
Text
So I was Tasha Yar at a Halloween party this year, and had this conversation
rando: yeah she's Yar -- if she were Data, her uniform would be a different color
me: -pause- No. Yar and Data wear the same color uniform
rando: Are you sure? I think he wears blue
me: I am very sure
rando: I SWEAR he wears blue, you know, the sciences uniform! Let's google this
me: We don't need to google this because I literally have pictures of him saved on my phone
this is the first picture i pull up

#not me drunkenly slurring “hes not in sciences hes chief management operations officer”#which isn't even correct its operations management officer#not me Well Actuallying myself after the fact#anyways one point this girl and i did both agree on was that he would look good in any color uniform 😌#star trek tng#data tng#data soong
77 notes
·
View notes
Text
"From Passion to Profession: Steps to Enter the Tech Industry"
How to Break into the Tech World: Your Comprehensive Guide
In today’s fast-paced digital landscape, the tech industry is thriving and full of opportunities. Whether you’re a student, a career changer, or someone passionate about technology, you may be wondering, “How do I get into the tech world?” This guide will provide you with actionable steps, resources, and insights to help you successfully navigate your journey.
Understanding the Tech Landscape
Before you start, it's essential to understand the various sectors within the tech industry. Key areas include:
Software Development: Designing and building applications and systems.
Data Science: Analyzing data to support decision-making.
Cybersecurity: Safeguarding systems and networks from digital threats.
Product Management: Overseeing the development and delivery of tech products.
User Experience (UX) Design: Focusing on the usability and overall experience of tech products.
Identifying your interests will help you choose the right path.
Step 1: Assess Your Interests and Skills
Begin your journey by evaluating your interests and existing skills. Consider the following questions:
What areas of technology excite me the most?
Do I prefer coding, data analysis, design, or project management?
What transferable skills do I already possess?
This self-assessment will help clarify your direction in the tech field.
Step 2: Gain Relevant Education and Skills
Formal Education
While a degree isn’t always necessary, it can be beneficial, especially for roles in software engineering or data science. Options include:
Computer Science Degree: Provides a strong foundation in programming and system design.
Coding Bootcamps: Intensive programs that teach practical skills quickly.
Online Courses: Platforms like Coursera, edX, and Udacity offer courses in various tech fields.
Self-Learning and Online Resources
The tech industry evolves rapidly, making self-learning crucial. Explore resources like:
FreeCodeCamp: Offers free coding tutorials and projects.
Kaggle: A platform for data science practice and competitions.
YouTube: Channels dedicated to tutorials on coding, design, and more.
Certifications
Certifications can enhance your credentials. Consider options like:
AWS Certified Solutions Architect: Valuable for cloud computing roles.
Certified Information Systems Security Professional (CISSP): Great for cybersecurity.
Google Analytics Certification: Useful for data-driven positions.
Step 3: Build a Portfolio
A strong portfolio showcases your skills and projects. Here’s how to create one:
For Developers
GitHub: Share your code and contributions to open-source projects.
Personal Website: Create a site to display your projects, skills, and resume.
For Designers
Design Portfolio: Use platforms like Behance or Dribbble to showcase your work.
Case Studies: Document your design process and outcomes.
For Data Professionals
Data Projects: Analyze public datasets and share your findings.
Blogging: Write about your data analysis and insights on a personal blog.
Step 4: Network in the Tech Community
Networking is vital for success in tech. Here are some strategies:
Attend Meetups and Conferences
Search for local tech meetups or conferences. Websites like Meetup.com and Eventbrite can help you find relevant events, providing opportunities to meet professionals and learn from experts.
Join Online Communities
Engage in online forums and communities. Use platforms like:
LinkedIn: Connect with industry professionals and share insights.
Twitter: Follow tech influencers and participate in discussions.
Reddit: Subreddits like r/learnprogramming and r/datascience offer valuable advice and support.
Seek Mentorship
Finding a mentor can greatly benefit your journey. Reach out to experienced professionals in your field and ask for guidance.
Step 5: Gain Practical Experience
Hands-on experience is often more valuable than formal education. Here’s how to gain it:
Internships
Apply for internships, even if they are unpaid. They offer exposure to real-world projects and networking opportunities.
Freelancing
Consider freelancing to build your portfolio and gain experience. Platforms like Upwork and Fiverr can connect you with clients.
Contribute to Open Source
Engaging in open-source projects can enhance your skills and visibility. Many projects on GitHub are looking for contributors.
Step 6: Prepare for Job Applications
Crafting Your Resume
Tailor your resume to highlight relevant skills and experiences. Align it with the job description for each application.
Writing a Cover Letter
A compelling cover letter can set you apart. Highlight your passion for technology and what you can contribute.
Practice Interviewing
Prepare for technical interviews by practicing coding challenges on platforms like LeetCode or HackerRank. For non-technical roles, rehearse common behavioral questions.
Step 7: Stay Updated and Keep Learning
The tech world is ever-evolving, making it crucial to stay current. Subscribe to industry newsletters, follow tech blogs, and continue learning through online courses.
Follow Industry Trends
Stay informed about emerging technologies and trends in your field. Resources like TechCrunch, Wired, and industry-specific blogs can provide valuable insights.
Continuous Learning
Dedicate time each week for learning. Whether through new courses, reading, or personal projects, ongoing education is essential for long-term success.
Conclusion
Breaking into the tech world may seem daunting, but with the right approach and commitment, it’s entirely possible. By assessing your interests, acquiring relevant skills, building a portfolio, networking, gaining practical experience, preparing for job applications, and committing to lifelong learning, you’ll be well on your way to a rewarding career in technology.
Embrace the journey, stay curious, and connect with the tech community. The tech world is vast and filled with possibilities, and your adventure is just beginning. Take that first step today and unlock the doors to your future in technology!
contact Infoemation wensite: https://agileseen.com/how-to-get-to-tech-world/ Phone: 01722-326809 Email: [email protected]
#tech career#how to get into tech#technology jobs#software development#data science#cybersecurity#product management#UX design#tech education#networking in tech#internships#freelancing#open source contribution#tech skills#continuous learning#job application tips
9 notes
·
View notes
Text
Intelligent Data Management in Life Sciences: A Game Changer for the Pharmaceutical Industry

In the fast-paced world of life sciences and pharmaceuticals, data management is crucial for driving innovation, enhancing compliance, and ensuring patient safety. With an ever-growing volume of data being generated across clinical trials, drug development, and regulatory compliance, pharmaceutical companies face the challenge of managing and analyzing this vast amount of data efficiently. Intelligent data management offers a solution to these challenges, ensuring that organizations in the life sciences industry can harness the full potential of their data.
Mastech InfoTrellis is a leader in implementing AI-first data management solutions, enabling pharmaceutical companies to streamline their operations, improve decision-making, and accelerate their research and development efforts. This blog explores the critical role of intelligent data management in the pharmaceutical industry, focusing on how Mastech InfoTrellis helps companies navigate data complexity to enhance business outcomes.
What Is Intelligent Data Management in Life Sciences?
Intelligent data management refers to the use of advanced technologies, such as artificial intelligence (AI), machine learning (ML), and automation, to manage, analyze, and leverage data in a way that improves operational efficiency and decision-making. In the life sciences industry, data is generated from various sources, including clinical trials, electronic health records (EHR), genomic research, and regulatory filings. Intelligent data management solutions help pharmaceutical companies streamline the collection, organization, and analysis of this data, making it easier to extract actionable insights and comply with stringent regulatory requirements.
Mastech InfoTrellis applies cutting-edge data management solutions tailored to the pharmaceutical industry, focusing on improving data accessibility, enhancing data governance, and enabling real-time analytics for better decision-making.
Join - ReimAIgined Intelligence at Informatica World 2025
The Importance of Data Management in the Pharmaceutical Industry
Effective data management is the backbone of the pharmaceutical industry. With the increasing volume of data generated in drug discovery, clinical trials, and regulatory compliance, pharmaceutical companies need intelligent systems to handle this data efficiently. Poor data management can lead to significant challenges, such as:
Regulatory non-compliance: In the pharmaceutical industry, compliance with global regulations, including those from the FDA and EMA, is paramount. Mishandling data or failing to track changes in regulations can lead to severe penalties and delays in product approvals.
Data silos: In many organizations, data is stored in different departments or systems, making it difficult to access and analyze holistically. This leads to inefficiencies and delays in decision-making.
Inaccurate data insights: Inaccurate or incomplete data can hinder the development of new drugs or the identification of critical health trends, affecting the overall success of research and development projects.
Intelligent data management solutions, such as those offered by Mastech InfoTrellis, address these issues by ensuring that data is accurate, accessible, and actionable, helping pharmaceutical companies optimize their workflows and drive better business outcomes.
Key Benefits of Intelligent Data Management in Life Sciences
1. Improved Data Governance and Compliance
In the pharmaceutical industry, data governance is a critical function, particularly when it comes to regulatory compliance. Intelligent data management solutions automate the processes of data validation, audit trails, and reporting, ensuring that all data handling processes comply with industry regulations.
Mastech InfoTrellis provides Informatica CDGC (Cloud Data Governance and Compliance), which ensures that data management processes align with industry standards such as Good Clinical Practice (GCP), Good Manufacturing Practice (GMP), and 21 CFR Part 11. This integration enhances data traceability and ensures that pharmaceutical companies can provide accurate and timely reports to regulatory bodies.
2. Enhanced Data Access and Collaboration
In a complex, multi-departmental organization like a pharmaceutical company, it is essential to have data that is easily accessible to the right stakeholders at the right time. Intelligent data management systems ensure that data from clinical trials, research teams, and regulatory departments is integrated into a unified platform.
With Mastech InfoTrellis's AI-powered Reltio MDM (Master Data Management) solution, pharmaceutical companies can break down data silos and provide a 360-degree view of their operations. This enables seamless collaboration between teams and faster decision-making across departments.
3. Faster Drug Development and Innovation
Pharmaceutical companies must make data-driven decisions quickly to bring new drugs to market efficiently. Intelligent data management accelerates the process by enabling faster access to real-time data, reducing the time spent on data gathering and analysis.
By leveraging AI and machine learning algorithms, Mastech InfoTrellis can automate data analysis, providing real-time insights into clinical trial results and research data. This accelerates the identification of promising drug candidates and speeds up the development process.
4. Real-Time Analytics for Better Decision-Making
In life sciences, every minute counts, especially during clinical trials and regulatory submissions. Intelligent data management systems provide pharmaceutical companies with real-time analytics that can help them make informed decisions faster.
By applying AI-powered analytics, pharmaceutical companies can quickly identify trends, predict outcomes, and optimize clinical trial strategies. This allows them to make data-backed decisions that improve drug efficacy, reduce adverse reactions, and ensure patient safety.
Mastech InfoTrellis: Transforming Data Management in the Pharmaceutical Industry
Mastech InfoTrellis is at the forefront of intelligent data management in the life sciences sector. The company's AI-first approach combines the power of Reltio MDM, Informatica CDGC, and AI-driven analytics to help pharmaceutical companies streamline their data management processes, improve data quality, and accelerate decision-making.
By leveraging Master Data Management (MDM) and Cloud Data Governance solutions, Mastech InfoTrellis empowers pharmaceutical companies to:
Integrate data from multiple sources for a unified view
Enhance data accuracy and integrity for better decision-making
Ensure compliance with global regulatory standards
Optimize the drug development process and improve time-to-market
Real-World Use Case: Improving Clinical Trial Efficiency
One real-world example of how intelligent data management is revolutionizing the pharmaceutical industry is the use of Mastech InfoTrellis's Reltio MDM solution in clinical trials. By integrating data from multiple trial sites, research teams, and regulatory bodies, Mastech InfoTrellis helped a major pharmaceutical company reduce the time spent on data gathering and processing by over 30%, enabling them to focus on analyzing results and making quicker decisions. This improvement led to a faster drug approval process and better patient outcomes.
People Also Ask
How does data management benefit the pharmaceutical industry?
Data management in the pharmaceutical industry ensures that all data, from clinical trials to regulatory filings, is accurate, accessible, and compliant with industry regulations. It helps streamline operations, improve decision-making, and speed up drug development.
What is the role of AI in pharmaceutical data management?
AI enhances pharmaceutical data management by automating data analysis, improving data accuracy, and providing real-time insights. AI-driven analytics allow pharmaceutical companies to identify trends, predict outcomes, and optimize clinical trials.
What are the challenges of data management in the pharmaceutical industry?
The pharmaceutical industry faces challenges such as data silos, regulatory compliance, and the sheer volume of data generated. Intelligent data management solutions help address these challenges by integrating data, automating governance, and providing real-time analytics.
Conclusion: The Future of Data Management in Life Sciences
Intelligent data management is no longer just an option for pharmaceutical companies—it's a necessity. With the power of AI, machine learning, and advanced data integration tools, Mastech InfoTrellis is helping pharmaceutical companies improve efficiency, compliance, and decision-making. By adopting these solutions, life sciences organizations can not only enhance their current operations but also position themselves for future growth and innovation.
As the pharmaceutical industry continues to evolve, intelligent data management will play a critical role in transforming how companies develop and deliver life-changing therapies to the market.
2 notes
·
View notes
Text
whining, ive been at work late everyday this week and today is no exception.
#i love science i do just sometimes my own time management skills bite me in the ass#and sometimes i dont want to waste a week on one thing when i KNOW if i just push a little i can do 2-3 things#i like getting data what can i say. research is a gatcha game and im addicted#LMFAO#bunny rambles
6 notes
·
View notes
Text
ive recently been having a lot of thoughts on politics and science and social media and the intersections of & interactions between the three
#i speak#none of them fully formed. not even enough to really initiate a discussion on it#i need to find someone else who has also thought about this and chat. hear other opinions to concretize my own#maybe ill look up some papers this week since i have a break#but like. the role of a scientist in politics and politics in science and how much should they be allowed to overlap#social media allowing laypeople in both areas to speak as though they are experts and creating dangerous noise that muddies actual info#how do we manage to work through that to properly get our messages across to try to handle public discourse and keep it grounded in truth#while simultaneously changing the way we teach future generations about logic; the scientific method; and how to interpret meaningful data#because obviously the way its taught now isnt working#etc etc#in the end it all comes back to my belief that logic and/or proofs and/or broader philosophy should be mandatorily taught in schools
4 notes
·
View notes
Text
Building a Data-Driven Organization: Lessons from Data Science Management

#Data Science#Data Science Management#Colleges in India#Top Colleges in Bangalore#Data Science Courses#Management#Colleges for Data Science#Data Visualization#Certification Courses#Skills Development
1 note
·
View note
Text
What Are the Qualifications for a Data Scientist?
In today's data-driven world, the role of a data scientist has become one of the most coveted career paths. With businesses relying on data for decision-making, understanding customer behavior, and improving products, the demand for skilled professionals who can analyze, interpret, and extract value from data is at an all-time high. If you're wondering what qualifications are needed to become a successful data scientist, how DataCouncil can help you get there, and why a data science course in Pune is a great option, this blog has the answers.
The Key Qualifications for a Data Scientist
To succeed as a data scientist, a mix of technical skills, education, and hands-on experience is essential. Here are the core qualifications required:
1. Educational Background
A strong foundation in mathematics, statistics, or computer science is typically expected. Most data scientists hold at least a bachelor’s degree in one of these fields, with many pursuing higher education such as a master's or a Ph.D. A data science course in Pune with DataCouncil can bridge this gap, offering the academic and practical knowledge required for a strong start in the industry.
2. Proficiency in Programming Languages
Programming is at the heart of data science. You need to be comfortable with languages like Python, R, and SQL, which are widely used for data analysis, machine learning, and database management. A comprehensive data science course in Pune will teach these programming skills from scratch, ensuring you become proficient in coding for data science tasks.
3. Understanding of Machine Learning
Data scientists must have a solid grasp of machine learning techniques and algorithms such as regression, clustering, and decision trees. By enrolling in a DataCouncil course, you'll learn how to implement machine learning models to analyze data and make predictions, an essential qualification for landing a data science job.
4. Data Wrangling Skills
Raw data is often messy and unstructured, and a good data scientist needs to be adept at cleaning and processing data before it can be analyzed. DataCouncil's data science course in Pune includes practical training in tools like Pandas and Numpy for effective data wrangling, helping you develop a strong skill set in this critical area.
5. Statistical Knowledge
Statistical analysis forms the backbone of data science. Knowledge of probability, hypothesis testing, and statistical modeling allows data scientists to draw meaningful insights from data. A structured data science course in Pune offers the theoretical and practical aspects of statistics required to excel.
6. Communication and Data Visualization Skills
Being able to explain your findings in a clear and concise manner is crucial. Data scientists often need to communicate with non-technical stakeholders, making tools like Tableau, Power BI, and Matplotlib essential for creating insightful visualizations. DataCouncil’s data science course in Pune includes modules on data visualization, which can help you present data in a way that’s easy to understand.
7. Domain Knowledge
Apart from technical skills, understanding the industry you work in is a major asset. Whether it’s healthcare, finance, or e-commerce, knowing how data applies within your industry will set you apart from the competition. DataCouncil's data science course in Pune is designed to offer case studies from multiple industries, helping students gain domain-specific insights.
Why Choose DataCouncil for a Data Science Course in Pune?
If you're looking to build a successful career as a data scientist, enrolling in a data science course in Pune with DataCouncil can be your first step toward reaching your goals. Here’s why DataCouncil is the ideal choice:
Comprehensive Curriculum: The course covers everything from the basics of data science to advanced machine learning techniques.
Hands-On Projects: You'll work on real-world projects that mimic the challenges faced by data scientists in various industries.
Experienced Faculty: Learn from industry professionals who have years of experience in data science and analytics.
100% Placement Support: DataCouncil provides job assistance to help you land a data science job in Pune or anywhere else, making it a great investment in your future.
Flexible Learning Options: With both weekday and weekend batches, DataCouncil ensures that you can learn at your own pace without compromising your current commitments.
Conclusion
Becoming a data scientist requires a combination of technical expertise, analytical skills, and industry knowledge. By enrolling in a data science course in Pune with DataCouncil, you can gain all the qualifications you need to thrive in this exciting field. Whether you're a fresher looking to start your career or a professional wanting to upskill, this course will equip you with the knowledge, skills, and practical experience to succeed as a data scientist.
Explore DataCouncil’s offerings today and take the first step toward unlocking a rewarding career in data science! Looking for the best data science course in Pune? DataCouncil offers comprehensive data science classes in Pune, designed to equip you with the skills to excel in this booming field. Our data science course in Pune covers everything from data analysis to machine learning, with competitive data science course fees in Pune. We provide job-oriented programs, making us the best institute for data science in Pune with placement support. Explore online data science training in Pune and take your career to new heights!
#In today's data-driven world#the role of a data scientist has become one of the most coveted career paths. With businesses relying on data for decision-making#understanding customer behavior#and improving products#the demand for skilled professionals who can analyze#interpret#and extract value from data is at an all-time high. If you're wondering what qualifications are needed to become a successful data scientis#how DataCouncil can help you get there#and why a data science course in Pune is a great option#this blog has the answers.#The Key Qualifications for a Data Scientist#To succeed as a data scientist#a mix of technical skills#education#and hands-on experience is essential. Here are the core qualifications required:#1. Educational Background#A strong foundation in mathematics#statistics#or computer science is typically expected. Most data scientists hold at least a bachelor’s degree in one of these fields#with many pursuing higher education such as a master's or a Ph.D. A data science course in Pune with DataCouncil can bridge this gap#offering the academic and practical knowledge required for a strong start in the industry.#2. Proficiency in Programming Languages#Programming is at the heart of data science. You need to be comfortable with languages like Python#R#and SQL#which are widely used for data analysis#machine learning#and database management. A comprehensive data science course in Pune will teach these programming skills from scratch#ensuring you become proficient in coding for data science tasks.#3. Understanding of Machine Learning
3 notes
·
View notes
Text
Top 10 PGDM Colleges for Data Science in Bangalore
In today's data-driven world, the demand for skilled data scientists is on the rise, making it an opportune time for aspiring professionals to pursue a Post Graduate Diploma in Management (PGDM) with a specialization in data science. Bangalore, known as the Silicon Valley of India, is home to a plethora of prestigious institutions offering specialized PGDM programs in data science.
#pgdm#pgdm colleges#top pgdm colleges#management#data science#colleges in bangalore#data science institute
2 notes
·
View notes
Text
The mission of the Gordon Ford College of Business is to actively support and engage students, faculty, staff, and community in academic and lifelong professional development, providing the foundation needed to lead in today's diverse business environment.

#supply chain#Sales#Marketing#management#Human Resources#Financial Planning#finance#economics and business analytics#economics#data analytics#cybersecurity#business data analytics#actuarial sciences#Accounting#Business
3 notes
·
View notes
Text
Assignment 4: Creating Graphs for Your Data
PREVIOUS CONTENT
Assignment 1.
Assignment 2.
Assignment 3.
Link to download the dataset here.
Link to download the codebook here.
WHAT TO SUBMIT:
Once you have written a successful program that creates univariate and bivariate graphs, create a blog entry where you post your program and the graphs that you have created. Write a few sentences describing what your graphs reveal in terms of your individual variables and the relationship between them.
Download the graph program here.
In the last assignment (3), I had made the data management that I thought necessary. Now is time to create the graphics that represent this data.
I did that in two ways, in the first one I made the Quantitative->Quantitave method generating a scatterplot and the second one was a Qualitative->Quantitative method that creates a bar graph. Before I present the result of the relationship between the two variables in the graph, let’s see the histogram and the metrics extracted in each attribute separated.
Univariate graphs
Incidence of breast cancer
The first attribute was the incidence of breast cancer in 100,000 female residents during the 2002 year. As it is a quantitative attribute, was generated the histogram of the data. #Univariate histogram of the incidence of breast cancer in 100,000 female residents during the 2002 year.seaborn.distplot(sub1["breastCancer100th"].dropna(), kde=False);plt.xlabel('Incidence of breast cancer in 100,000 female residents during the 2002 year.')plt.ylabel('Number of counties.')plt.title('Histogram of the Incidence of Breast Cancer.')plt.show()
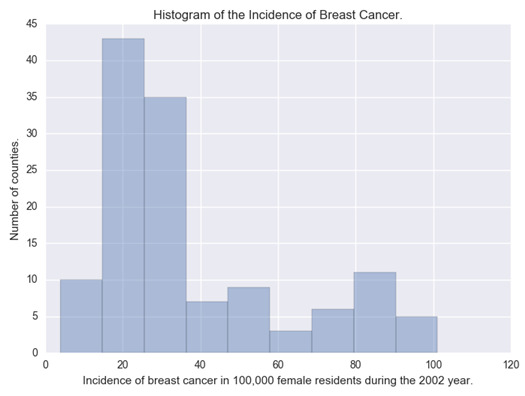
We can observe in the histogram that most of the countries have an incidence of cancer around 30 and 40 cases per 100,000 females. The extracted metrics of this attribute were: desc1 = sub1["breastCancer100th"].describe()print(desc1) count 129.000000mean 37.987597std 24.323873min 3.90000025% 20.60000050% 29.70000075% 50.300000max 101.100000Name: breastCancer100th, dtype: float64
With this, we can see that 75% of the countries have an incidence of breast cancer under 50.30 per 100,000 females.
Sugar consumption
The second attribute is the sugar consumption. For this attribute, I have made two graphs: one that shows the histogram of the original data and the other one that shows the bar graph of this attribute relocated into categories.
Histogram
#Univariate histogram of the Mean of the sugar consumption (grams per person and day) between 1961 and 2002.seaborn.distplot(sub1["meanSugarPerson"].dropna(), kde=False);plt.xlabel('Mean of the sugar consumption (grams per person and day) between 1961 and 2002.')plt.ylabel('Number of counties.')plt.title('Histogram of the Sugar Consumption.')plt.show()
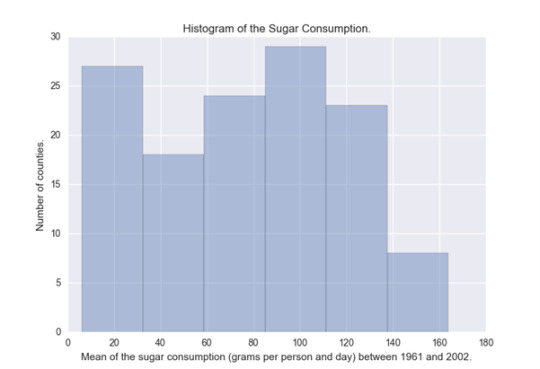
This histogram is almost evenly distributed, we can see that the countries that have the most sugar consumption are in the 20 and the 110 grams per person. desc2 = sub1["meanSugarPerson"].describe()print(desc2) count 129.000000mean 76.238394std 42.488004min 6.13238125% 42.20642950% 79.71452475% 110.307619max 163.861429Name: meanSugarPerson, dtype: float64
The mean of sugar consumption is 76.24 and we can see that 75% of the countries have a consumption of sugar under 110.31 grams per day.
Bar graph
#Univariate bar graph of the Mean of the sugar consumption (grams per person and day) between 1961 and 2002.seaborn.countplot(x="sugar_consumption", data=sub1)plt.xlabel('Mean of the sugar consumption (grams per person and day) between 1961 and 2002.')plt.ylabel('Number of counties.')plt.title('Histogram of the Sugar Consumption.')plt.show()

Where the consumption is:
(0) Desirable between 0 and 30 g.
(1) Raised between 30 and 60 g.
(2) Borderline high between 60 and 90 g.
(3) High between 90 and 120 g.
(4) Very high under 120g.
The bar graph behaved very similarly to the histogram.
Bivariate graphs
The two bivariate graphics are presented below: #Bivariate Scatterplot Q->Q - Incidence of breast cancer versus sugar consumptionscat1 = seaborn.regplot(x="meanSugarPerson", y="breastCancer100th", fit_reg=True, data=sub1)plt.xlabel('Mean of the sugar consumption between 1961 and 2002.')plt.ylabel('Incidence of breast cancer in 100,000 female residents during the 2002 year.')plt.title('Scatterplot for the association between the incidence of breast cancer and the sugar consumption.')plt.show() #Bivariate bar graph C->Q - Incidence of breast cancer versus sugar consumptionseaborn.factorplot(x='sugar_consumption', y='breastCancer100th', data=sub1, kind="bar", ci=None)plt.xlabel('Mean of the sugar consumption between 1961 and 2002.')plt.ylabel('Incidence of breast cancer in 100,000 female residents during the 2002 year.')plt.title('Bar graph for the Association between the incidence of breast cancer and the sugar consumption.')plt.show()
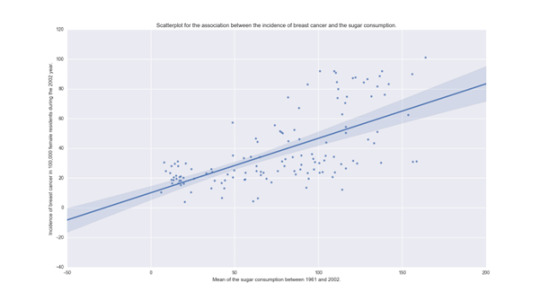
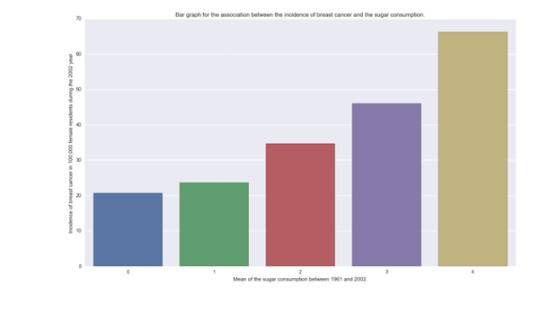
In both graphics, we can see that there is a relation with the incidence of breast cancer and the consumption of sugar. While sugar consumption is increased the incidence of new breast cancer cases is increased too.
Review criteria
Your assessment will be based on the evidence you provide that you have completed all the steps. When relevant, gradients in the scoring will be available to reward clarity (for example, you will get one point for submitting graphs that do not accurately represent your data, but two points if the data is accurately represented). In all cases, consider that the peer assessing your work is likely not an expert in the field you are analyzing. You will be assessed equally in your description of your frequency distributions.
Specific rubric items, and their point values, are as follows:
Was a univariate graph created for each of the selected variables? (2 points)
Was a bivariate graph created for the selected variables? (2 points)
Did the summary describe what the graphs revealed in terms of the individual variables and the relationship between them? (2 points)
2 notes
·
View notes
Text
Mastering Marketing: Emotion-Driven Brands, Data-Powered Insights & Behavioral Change
Coca‑Cola “New Coke” Case & the Birth of the Garrison Group
Mistake diagnosed: Focused on “taste” not emotion, so New Coke failed emotionally.
Solution: Built an in‑house “think tank” to study emotional branding → Paul Garrison spun this out as the Garrison Group consultancy.
Core Marketing Concepts
Marketing = sell more stuff to more people, for more money, more often, more efficiently.
Marketing vs. Communications
Marketing sets the target, the brand associations, and the desired behavior (i.e. the “why” and “who”).
Communications is how you convey those associations (ads, social media, reels, etc.).
4 Functions of Business: production, finance, HR, marketing—all aim to make money, but marketing’s toolset centers on emotion + behavior.
Brand = the cluster of functional + emotional associations a large group holds in their heads.
Positioning is done by consumers’ perceptions, not by marketers—our role is to influence it.
Needs, Wants & Demand
Need = a fundamental human requirement (functional or emotional).
Want = culturally shaped expression of a need (e.g. quick breakfast → šmav atka vs. burger vs. ramen).
Demand = wants backed by willingness & ability to pay.
Marketing cycle:
Influence associations (branding)
→ drive behavior (habits)
→ generate revenue
→ reinvest in branding
Correct approach:
Define target—e.g. 60+ German couples (have money, time, crave new experiences)
Identify insights/pain points (e.g. safety, comfort, cultural immersion)
Craft communications to build desired associations → drive bookings
Key takeaway: Always lead with target + insight → desired associations → communications → behavior → revenue.
#BUS360#Marketing Management#Summer2025#MBA#mba core#12 june 2025#marketing#marketing strategy#behavioral science#brand building#emotional branding#consumer insights#data driven marketing#market research#customer behavior#brand loyalty#marketing psychology
0 notes