#Data cleansing in Python
Explore tagged Tumblr posts
Visit Tumblr Blog
Explore Tumblr blogs with no restrictions, modern design and the best experience.
Last Seen Tumblr Blogs


Fun Fact
The average Tumblr user visits about 67 pages every month.
Text
A Beginner’s Guide to Data Cleaning Techniques

Data is the lifeblood of any modern organization. However, raw data is rarely ready for analysis. Before it can be used for insights, data must be cleaned, refined, and structured—a process known as data cleaning. This blog will explore essential data-cleaning techniques, why they are important, and how beginners can master them.
#data cleaning techniques#data cleansing#data scrubbing#business intelligence#Data Cleaning Challenges#Removing Duplicate Records#Handling Missing Data#Correcting Inconsistencies#Python#pandas#R#OpenRefine#Microsoft Excel#Tools for Data Cleaning#data cleaning steps#dplyr and tidyr#basic data cleaning features#Data validation
0 notes
Text
[Python] PySpark to M, SQL or Pandas
Hace tiempo escribí un artículo sobre como escribir en pandas algunos códigos de referencia de SQL o M (power query). Si bien en su momento fue de gran utilidad, lo cierto es que hoy existe otro lenguaje que representa un fuerte pie en el análisis de datos.
Spark se convirtió en el jugar principal para lectura de datos en Lakes. Aunque sea cierto que existe SparkSQL, no quise dejar de traer estas analogías de código entre PySpark, M, SQL y Pandas para quienes estén familiarizados con un lenguaje, puedan ver como realizar una acción con el otro.
Lo primero es ponernos de acuerdo en la lectura del post.
Power Query corre en capas. Cada linea llama a la anterior (que devuelve una tabla) generando esta perspectiva o visión en capas. Por ello cuando leamos en el código #“Paso anterior” hablamos de una tabla.
En Python, asumiremos a "df" como un pandas dataframe (pandas.DataFrame) ya cargado y a "spark_frame" a un frame de pyspark cargado (spark.read)
Conozcamos los ejemplos que serán listados en el siguiente orden: SQL, PySpark, Pandas, Power Query.
En SQL:
SELECT TOP 5 * FROM table
En PySpark
spark_frame.limit(5)
En Pandas:
df.head()
En Power Query:
Table.FirstN(#"Paso Anterior",5)
Contar filas
SELECT COUNT(*) FROM table1
spark_frame.count()
df.shape()
Table.RowCount(#"Paso Anterior")
Seleccionar filas
SELECT column1, column2 FROM table1
spark_frame.select("column1", "column2")
df[["column1", "column2"]]
#"Paso Anterior"[[Columna1],[Columna2]] O podría ser: Table.SelectColumns(#"Paso Anterior", {"Columna1", "Columna2"} )
Filtrar filas
SELECT column1, column2 FROM table1 WHERE column1 = 2
spark_frame.filter("column1 = 2") # OR spark_frame.filter(spark_frame['column1'] == 2)
df[['column1', 'column2']].loc[df['column1'] == 2]
Table.SelectRows(#"Paso Anterior", each [column1] == 2 )
Varios filtros de filas
SELECT * FROM table1 WHERE column1 > 1 AND column2 < 25
spark_frame.filter((spark_frame['column1'] > 1) & (spark_frame['column2'] < 25)) O con operadores OR y NOT spark_frame.filter((spark_frame['column1'] > 1) | ~(spark_frame['column2'] < 25))
df.loc[(df['column1'] > 1) & (df['column2'] < 25)] O con operadores OR y NOT df.loc[(df['column1'] > 1) | ~(df['column2'] < 25)]
Table.SelectRows(#"Paso Anterior", each [column1] > 1 and column2 < 25 ) O con operadores OR y NOT Table.SelectRows(#"Paso Anterior", each [column1] > 1 or not ([column1] < 25 ) )
Filtros con operadores complejos
SELECT * FROM table1 WHERE column1 BETWEEN 1 and 5 AND column2 IN (20,30,40,50) AND column3 LIKE '%arcelona%'
from pyspark.sql.functions import col spark_frame.filter( (col('column1').between(1, 5)) & (col('column2').isin(20, 30, 40, 50)) & (col('column3').like('%arcelona%')) ) # O spark_frame.where( (col('column1').between(1, 5)) & (col('column2').isin(20, 30, 40, 50)) & (col('column3').contains('arcelona')) )
df.loc[(df['colum1'].between(1,5)) & (df['column2'].isin([20,30,40,50])) & (df['column3'].str.contains('arcelona'))]
Table.SelectRows(#"Paso Anterior", each ([column1] > 1 and [column1] < 5) and List.Contains({20,30,40,50}, [column2]) and Text.Contains([column3], "arcelona") )
Join tables
SELECT t1.column1, t2.column1 FROM table1 t1 LEFT JOIN table2 t2 ON t1.column_id = t2.column_id
Sería correcto cambiar el alias de columnas de mismo nombre así:
spark_frame1.join(spark_frame2, spark_frame1["column_id"] == spark_frame2["column_id"], "left").select(spark_frame1["column1"].alias("column1_df1"), spark_frame2["column1"].alias("column1_df2"))
Hay dos funciones que pueden ayudarnos en este proceso merge y join.
df_joined = df1.merge(df2, left_on='lkey', right_on='rkey', how='left') df_joined = df1.join(df2, on='column_id', how='left')Luego seleccionamos dos columnas df_joined.loc[['column1_df1', 'column1_df2']]
En Power Query vamos a ir eligiendo una columna de antemano y luego añadiendo la segunda.
#"Origen" = #"Paso Anterior"[[column1_t1]] #"Paso Join" = Table.NestedJoin(#"Origen", {"column_t1_id"}, table2, {"column_t2_id"}, "Prefijo", JoinKind.LeftOuter) #"Expansion" = Table.ExpandTableColumn(#"Paso Join", "Prefijo", {"column1_t2"}, {"Prefijo_column1_t2"})
Group By
SELECT column1, count(*) FROM table1 GROUP BY column1
from pyspark.sql.functions import count spark_frame.groupBy("column1").agg(count("*").alias("count"))
df.groupby('column1')['column1'].count()
Table.Group(#"Paso Anterior", {"column1"}, {{"Alias de count", each Table.RowCount(_), type number}})
Filtrando un agrupado
SELECT store, sum(sales) FROM table1 GROUP BY store HAVING sum(sales) > 1000
from pyspark.sql.functions import sum as spark_sum spark_frame.groupBy("store").agg(spark_sum("sales").alias("total_sales")).filter("total_sales > 1000")
df_grouped = df.groupby('store')['sales'].sum() df_grouped.loc[df_grouped > 1000]
#”Grouping” = Table.Group(#"Paso Anterior", {"store"}, {{"Alias de sum", each List.Sum([sales]), type number}}) #"Final" = Table.SelectRows( #"Grouping" , each [Alias de sum] > 1000 )
Ordenar descendente por columna
SELECT * FROM table1 ORDER BY column1 DESC
spark_frame.orderBy("column1", ascending=False)
df.sort_values(by=['column1'], ascending=False)
Table.Sort(#"Paso Anterior",{{"column1", Order.Descending}})
Unir una tabla con otra de la misma característica
SELECT * FROM table1 UNION SELECT * FROM table2
spark_frame1.union(spark_frame2)
En Pandas tenemos dos opciones conocidas, la función append y concat.
df.append(df2) pd.concat([df1, df2])
Table.Combine({table1, table2})
Transformaciones
Las siguientes transformaciones son directamente entre PySpark, Pandas y Power Query puesto que no son tan comunes en un lenguaje de consulta como SQL. Puede que su resultado no sea idéntico pero si similar para el caso a resolver.
Analizar el contenido de una tabla
spark_frame.summary()
df.describe()
Table.Profile(#"Paso Anterior")
Chequear valores únicos de las columnas
spark_frame.groupBy("column1").count().show()
df.value_counts("columna1")
Table.Profile(#"Paso Anterior")[[Column],[DistinctCount]]
Generar Tabla de prueba con datos cargados a mano
spark_frame = spark.createDataFrame([(1, "Boris Yeltsin"), (2, "Mikhail Gorbachev")], inferSchema=True)
df = pd.DataFrame([[1,2],["Boris Yeltsin", "Mikhail Gorbachev"]], columns=["CustomerID", "Name"])
Table.FromRecords({[CustomerID = 1, Name = "Bob", Phone = "123-4567"]})
Quitar una columna
spark_frame.drop("column1")
df.drop(columns=['column1']) df.drop(['column1'], axis=1)
Table.RemoveColumns(#"Paso Anterior",{"column1"})
Aplicar transformaciones sobre una columna
spark_frame.withColumn("column1", col("column1") + 1)
df.apply(lambda x : x['column1'] + 1 , axis = 1)
Table.TransformColumns(#"Paso Anterior", {{"column1", each _ + 1, type number}})
Hemos terminado el largo camino de consultas y transformaciones que nos ayudarían a tener un mejor tiempo a puro código con PySpark, SQL, Pandas y Power Query para que conociendo uno sepamos usar el otro.
#spark#pyspark#python#pandas#sql#power query#powerquery#notebooks#ladataweb#data engineering#data wrangling#data cleansing
0 notes
Text
Data Analysis: Turning Information into Insight
In nowadays’s digital age, statistics has come to be a vital asset for businesses, researchers, governments, and people alike. However, raw facts on its personal holds little value till it's far interpreted and understood. This is wherein records evaluation comes into play. Data analysis is the systematic manner of inspecting, cleansing, remodeling, and modeling facts with the objective of coming across beneficial information, drawing conclusions, and helping selection-making.
What Is Data Analysis In Research

What is Data Analysis?
At its middle, records analysis includes extracting meaningful insights from datasets. These datasets can variety from small and based spreadsheets to large and unstructured facts lakes. The primary aim is to make sense of data to reply questions, resolve issues, or become aware of traits and styles that are not without delay apparent.
Data evaluation is used in truely every enterprise—from healthcare and finance to marketing and education. It enables groups to make proof-based choices, improve operational efficiency, and advantage aggressive advantages.
Types of Data Analysis
There are several kinds of information evaluation, every serving a completely unique purpose:
1. Descriptive Analysis
Descriptive analysis answers the question: “What happened?” It summarizes raw facts into digestible codecs like averages, probabilities, or counts. For instance, a store might analyze last month’s sales to decide which merchandise achieved satisfactory.
2. Diagnostic Analysis
This form of evaluation explores the reasons behind beyond outcomes. It answers: “Why did it occur?” For example, if a agency sees a surprising drop in internet site visitors, diagnostic evaluation can assist pinpoint whether or not it changed into because of a technical problem, adjustments in search engine marketing rating, or competitor movements.
3. Predictive Analysis
Predictive analysis makes use of historical information to forecast destiny consequences. It solutions: “What is probable to occur?” This includes statistical models and system getting to know algorithms to pick out styles and expect destiny trends, such as customer churn or product demand.
4. Prescriptive Analysis
Prescriptive analysis provides recommendations primarily based on facts. It solutions: “What have to we do?” This is the maximum advanced type of analysis and often combines insights from predictive analysis with optimization and simulation techniques to manual selection-making.
The Data Analysis Process
The technique of information analysis commonly follows those steps:
1. Define the Objective
Before diving into statistics, it’s essential to without a doubt recognize the question or trouble at hand. A well-defined goal guides the entire analysis and ensures that efforts are aligned with the preferred outcome.
2. Collect Data
Data can come from numerous sources which includes databases, surveys, sensors, APIs, or social media. It’s important to make certain that the records is relevant, timely, and of sufficient high-quality.
3. Clean and Prepare Data
Raw information is regularly messy—it may comprise missing values, duplicates, inconsistencies, or mistakes. Data cleansing involves addressing these problems. Preparation may include formatting, normalization, or growing new variables.
Four. Analyze the Data
Tools like Excel, SQL, Python, R, or specialized software consisting of Tableau, Power BI, and SAS are typically used.
5. Interpret Results
Analysis isn't pretty much numbers; it’s about meaning. Interpreting effects involves drawing conclusions, explaining findings, and linking insights lower back to the authentic goal.
6. Communicate Findings
Insights have to be communicated effectively to stakeholders. Visualization tools including charts, graphs, dashboards, and reports play a vital position in telling the story behind the statistics.
7. Make Decisions and Take Action
The last aim of statistics analysis is to tell selections. Whether it’s optimizing a advertising marketing campaign, improving customer support, or refining a product, actionable insights flip data into real-global effects.
Tools and Technologies for Data Analysis
A big selection of gear is available for facts analysis, each suited to distinct tasks and talent levels:
Excel: Great for small datasets and short analysis. Offers capabilities, pivot tables, and charts.
Python: Powerful for complicated facts manipulation and modeling. Popular libraries consist of Pandas, NumPy, Matplotlib, and Scikit-learn.
R: A statistical programming language extensively used for statistical analysis and statistics visualization.
SQL: Essential for querying and handling information saved in relational databases.
Tableau & Power BI: User-friendly enterprise intelligence equipment that flip facts into interactive visualizations and dashboards.
Healthcare: Analyzing affected person statistics to enhance treatment plans, predict outbreaks, and control resources.
Finance: Detecting fraud, coping with threat, and guiding investment techniques.
Retail: Personalizing advertising campaigns, managing inventory, and optimizing pricing.
Sports: Enhancing performance through participant records and game analysis.
Public Policy: Informing choices on schooling, transportation, and financial improvement.
Challenges in Data Analysis
Data Quality: Incomplete, old, or incorrect information can lead to deceptive conclusions.
Data Privacy: Handling sensitive records requires strict adherence to privacy guidelines like GDPR.
Skill Gaps: There's a developing demand for skilled information analysts who can interpret complicated facts sets.
Integration: Combining facts from disparate resources may be technically hard.
Bias and Misinterpretation: Poorly designed analysis can introduce bias or lead to wrong assumptions.
The Future of Data Analysis
As facts keeps to grow exponentially, the sector of facts analysis is evolving rapidly. Emerging developments include:
Artificial Intelligence (AI) & Machine Learning: Automating evaluation and producing predictive fashions at scale.
Real-Time Analytics: Enabling decisions based totally on live data streams for faster reaction.
Data Democratization: Making records handy and understandable to everybody in an business enterprise
2 notes
·
View notes
Text

The Comprehensive Guide to Web Development, Data Management, and More
Introduction
Everything today is technology driven in this digital world. There's a lot happening behind the scenes when you use your favorite apps, go to websites, and do other things with all of those zeroes and ones — or binary data. In this blog, I will be explaining what all these terminologies really means and other basics of web development, data management etc. We will be discussing them in the simplest way so that this becomes easy to understand for beginners or people who are even remotely interested about technology. JOIN US
What is Web Development?
Web development refers to the work and process of developing a website or web application that can run in a web browser. From laying out individual web page designs before we ever start coding, to how the layout will be implemented through HTML/CSS. There are two major fields of web development — front-end and back-end.
Front-End Development
Front-end development, also known as client-side development, is the part of web development that deals with what users see and interact with on their screens. It involves using languages like HTML, CSS, and JavaScript to create the visual elements of a website, such as buttons, forms, and images. JOIN US
HTML (HyperText Markup Language):
HTML is the foundation of all website, it helps one to organize their content on web platform. It provides the default style to basic elements such as headings, paragraphs and links.
CSS (Cascading Style Sheets):
styles and formats HTML elements. It makes an attractive and user-friendly look of webpage as it controls the colors, fonts, layout.
JavaScript :
A language for adding interactivity to a website Users interact with items, like clicking a button to send in a form or viewing images within the slideshow. JOIN US
Back-End Development
The difference while front-end development is all about what the user sees, back end involves everything that happens behind. The back-end consists of a server, database and application logic that runs on the web.
Server:
A server is a computer that holds website files and provides them to the user browser when they request it. Server-Side: These are populated by back-end developers who build and maintain servers using languages like Python, PHP or Ruby.
Database:
The place where a website keeps its data, from user details to content and settings The database is maintained with services like MySQL, PostgreSQL, or MongoDB. JOIN US
Application Logic —
the code that links front-end and back-end It takes user input, gets data from the database and returns right informations to front-end area.

Why Proper Data Management is Absolutely Critical
Data management — Besides web development this is the most important a part of our Digital World. What Is Data Management? It includes practices, policies and procedures that are used to collect store secure data in controlled way.
Data Storage –
data after being collected needs to be stored securely such data can be stored in relational databases or cloud storage solutions. The most important aspect here is that the data should never be accessed by an unauthorized source or breached. JOIN US
Data processing:
Right from storing the data, with Big Data you further move on to process it in order to make sense out of hordes of raw information. This includes cleansing the data (removing errors or redundancies), finding patterns among it, and producing ideas that could be useful for decision-making.
Data Security:
Another important part of data management is the security of it. It refers to defending data against unauthorized access, breaches or other potential vulnerabilities. You can do this with some basic security methods, mostly encryption and access controls as well as regular auditing of your systems.
Other Critical Tech Landmarks
There are a lot of disciplines in the tech world that go beyond web development and data management. Here are a few of them:
Cloud Computing
Leading by example, AWS had established cloud computing as the on-demand delivery of IT resources and applications via web services/Internet over a decade considering all layers to make it easy from servers up to top most layer. This will enable organizations to consume technology resources in the form of pay-as-you-go model without having to purchase, own and feed that infrastructure. JOIN US
Cloud Computing Advantages:
Main advantages are cost savings, scalability, flexibility and disaster recovery. Resources can be scaled based on usage, which means companies only pay for what they are using and have the data backed up in case of an emergency.
Examples of Cloud Services:
Few popular cloud services are Amazon Web Services (AWS), Microsoft Azure, and Google Cloud. These provide a plethora of services that helps to Develop and Manage App, Store Data etc.
Cybersecurity
As the world continues to rely more heavily on digital technologies, cybersecurity has never been a bigger issue. Protecting computer systems, networks and data from cyber attacks is called Cyber security.
Phishing attacks, Malware, Ransomware and Data breaches:
This is common cybersecurity threats. These threats can bear substantial ramifications, from financial damages to reputation harm for any corporation.
Cybersecurity Best Practices:
In order to safeguard against cybersecurity threats, it is necessary to follow best-practices including using strong passwords and two-factor authorization, updating software as required, training employees on security risks.
Artificial Intelligence and Machine Learning
Artificial Intelligence (AI) and Machine Learning (ML) represent the fastest-growing fields of creating systems that learn from data, identifying patterns in them. These are applied to several use-cases like self driving cars, personalization in Netflix.
AI vs ML —
AI is the broader concept of machines being able to carry out tasks in a way we would consider “smart”. Machine learning is a type of Artificial Intelligence (AI) that provides computers with the ability to learn without being explicitly programmed. JOIN US
Applications of Artificial Intelligence and Machine Learning: some common applications include Image recognition, Speech to text, Natural language processing, Predictive analytics Robotics.
Web Development meets Data Management etc.
We need so many things like web development, data management and cloud computing plus cybersecurity etc.. but some of them are most important aspects i.e. AI/ML yet more fascinating is where these fields converge or play off each other.
Web Development and Data Management
Web Development and Data Management goes hand in hand. The large number of websites and web-based applications in the world generate enormous amounts of data — from user interactions, to transaction records. Being able to manage this data is key in providing a fantastic user experience and enabling you to make decisions based on the right kind of information.
E.g. E-commerce Website, products data need to be saved on server also customers data should save in a database loosely coupled with orders and payments. This data is necessary for customization of the shopping experience as well as inventory management and fraud prevention.
Cloud Computing and Web Development
The development of the web has been revolutionized by cloud computing which gives developers a way to allocate, deploy and scale applications more or less without service friction. Developers now can host applications and data in cloud services instead of investing for physical servers.
E.g. A start-up company can use cloud services to roll out the web application globally in order for all users worldwide could browse it without waiting due unavailability of geolocation prohibited access.
The Future of Cybersecurity and Data Management
Which makes Cybersecurity a very important part of the Data management. The more data collected and stored by an organization, the greater a target it becomes for cyber threats. It is important to secure this data using robust cybersecurity measures, so that sensitive information remains intact and customer trust does not weaken. JOIN US
Ex: A healthcare provider would have to protect patient data in order to be compliant with regulations such as HIPAA (Health Insurance Portability and Accountability Act) that is also responsible for ensuring a degree of confidentiality between a provider and their patients.
Conclusion
Well, in a nutshell web-developer or Data manager etc are some of the integral parts for digital world.
As a Business Owner, Tech Enthusiast or even if you are just planning to make your Career in tech — it is important that you understand these. With the progress of technology never slowing down, these intersections are perhaps only going to come together more strongly and develop into cornerstones that define how we live in a digital world tomorrow.
With the fundamental knowledge of web development, data management, automation and ML you will manage to catch up with digital movements. Whether you have a site to build, ideas data to manage or simply interested in what’s hot these days, skills and knowledge around the above will stand good for changing tech world. JOIN US
#Technology#Web Development#Front-End Development#Back-End Development#HTML#CSS#JavaScript#Data Management#Data Security#Cloud Computing#AWS (Amazon Web Services)#Cybersecurity#Artificial Intelligence (AI)#Machine Learning (ML)#Digital World#Tech Trends#IT Basics#Beginners Guide#Web Development Basics#Tech Enthusiast#Tech Career#america
4 notes
·
View notes
Text
From Exploration to Enchantment: Unveiling the Artistry of Data Science
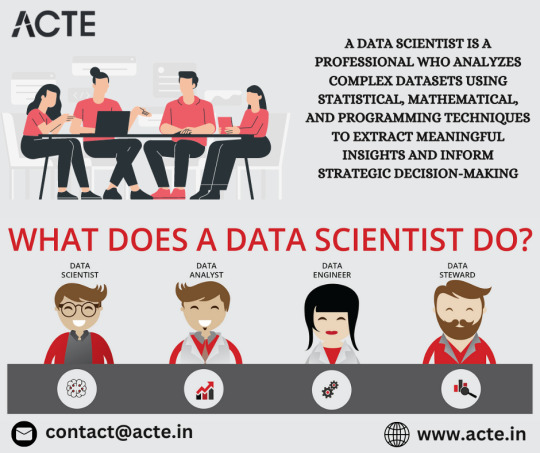
In the dynamic realm of technology, where data has become the lifeblood of decision-making, data scientists emerge as the modern-day wizards wielding statistical prowess, machine learning magic, and programming spells. Choosing the Best Data Science Institute can further accelerate your journey into this thriving industry. But what exactly does a data scientist do, and how do they weave their spells to extract meaningful insights from the vast tapestry of data? Let's embark on a journey to demystify the role and responsibilities of a data scientist.
1. Data Exploration and Cleaning: Navigating the Data Seas
The odyssey begins with a deep dive into the vast data seas. Data scientists embark on a voyage of exploration, understanding the intricacies of datasets, identifying patterns, and cleansing the data to ensure its accuracy and relevance. This phase lays the foundation for the subsequent stages of analysis.
2. Statistical Analysis: Illuminating Patterns in the Darkness
Armed with statistical techniques, data scientists illuminate the darkness within the data. They apply statistical analysis to unveil trends, patterns, and relationships, transforming raw data into actionable insights. This statistical alchemy provides the groundwork for making informed decisions.
3. Machine Learning: Casting Predictive Spells
The heart of the data scientist's craft lies in machine learning—the art of teaching machines to learn from data. They develop and implement machine learning models, predicting outcomes, classifying data, or uncovering hidden patterns. It's a realm where algorithms become the guiding stars.
4. Data Visualization: Painting a Picture for All
To communicate the magic discovered within the data, data scientists harness the power of data visualization. Through charts, graphs, and dashboards, they paint a vivid picture, making complex insights accessible and compelling for both technical and non-technical stakeholders.
5. Feature Engineering: Crafting the Building Blocks
Much like a skilled architect, a data scientist engages in feature engineering. They carefully select and transform relevant features within the data, enhancing the performance and predictive power of machine learning models.
6. Predictive Modeling: Foretelling the Future
The crystal ball of a data scientist is the predictive model. Building upon historical data, they create models to forecast future trends, behaviors, or outcomes, guiding organizations towards proactive decision-making.
7. Algorithm Development: Coding the Spells
In the enchanting world of data science, programming becomes the language of spellcasting. Data scientists design and implement algorithms, utilizing languages such as Python or R to extract valuable information from the data tapestry.
8. Collaboration: Bridging Realms
No sorcerer works in isolation. Data scientists collaborate with cross-functional teams, translating data-driven insights into tangible business objectives. This collaboration ensures that the magic woven from data aligns seamlessly with the broader goals of the organization.
9. Continuous Learning: Evolving with the Arcane
In a landscape where technological evolutions are constant, data scientists embrace continuous learning. They stay abreast of the latest developments in data science, machine learning, and relevant technologies to refine their craft and adapt to the ever-changing tides of industry trends.
10. Ethical Considerations: Guardians of Data Integrity
As stewards of data, data scientists bear the responsibility of ethical considerations. They navigate the ethical landscape, ensuring the privacy and security of data while wielding their analytical powers for the greater good.
In conclusion, a data scientist's journey is one of constant exploration, analysis, and collaboration—a symphony of skills and knowledge harmonized to reveal the hidden melodies within data. In a world where data has become a strategic asset, data scientists are the custodians of its magic, turning raw information into insights that shape the destiny of organizations. Choosing the best Data Science Courses in Chennai is a crucial step in acquiring the necessary expertise for a successful career in the evolving landscape of data science.
4 notes
·
View notes
Text
Tapping into Fresh Insights: Kroger Grocery Data Scraping
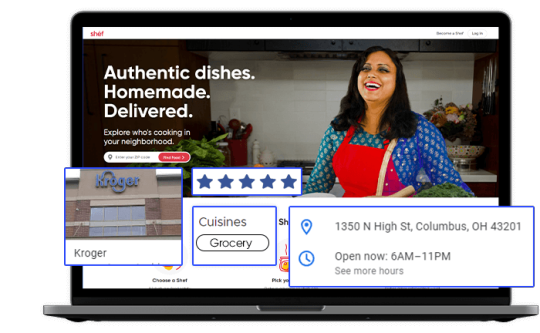
In today's data-driven world, the retail grocery industry is no exception when it comes to leveraging data for strategic decision-making. Kroger, one of the largest supermarket chains in the United States, offers a wealth of valuable data related to grocery products, pricing, customer preferences, and more. Extracting and harnessing this data through Kroger grocery data scraping can provide businesses and individuals with a competitive edge and valuable insights. This article explores the significance of grocery data extraction from Kroger, its benefits, and the methodologies involved.
The Power of Kroger Grocery Data
Kroger's extensive presence in the grocery market, both online and in physical stores, positions it as a significant source of data in the industry. This data is invaluable for a variety of stakeholders:
Kroger: The company can gain insights into customer buying patterns, product popularity, inventory management, and pricing strategies. This information empowers Kroger to optimize its product offerings and enhance the shopping experience.
Grocery Brands: Food manufacturers and brands can use Kroger's data to track product performance, assess market trends, and make informed decisions about product development and marketing strategies.
Consumers: Shoppers can benefit from Kroger's data by accessing information on product availability, pricing, and customer reviews, aiding in making informed purchasing decisions.
Benefits of Grocery Data Extraction from Kroger
Market Understanding: Extracted grocery data provides a deep understanding of the grocery retail market. Businesses can identify trends, competition, and areas for growth or diversification.
Product Optimization: Kroger and other retailers can optimize their product offerings by analyzing customer preferences, demand patterns, and pricing strategies. This data helps enhance inventory management and product selection.
Pricing Strategies: Monitoring pricing data from Kroger allows businesses to adjust their pricing strategies in response to market dynamics and competitor moves.
Inventory Management: Kroger grocery data extraction aids in managing inventory effectively, reducing waste, and improving supply chain operations.
Methodologies for Grocery Data Extraction from Kroger
To extract grocery data from Kroger, individuals and businesses can follow these methodologies:
Authorization: Ensure compliance with Kroger's terms of service and legal regulations. Authorization may be required for data extraction activities, and respecting privacy and copyright laws is essential.
Data Sources: Identify the specific data sources you wish to extract. Kroger's data encompasses product listings, pricing, customer reviews, and more.
Web Scraping Tools: Utilize web scraping tools, libraries, or custom scripts to extract data from Kroger's website. Common tools include Python libraries like BeautifulSoup and Scrapy.
Data Cleansing: Cleanse and structure the scraped data to make it usable for analysis. This may involve removing HTML tags, formatting data, and handling missing or inconsistent information.
Data Storage: Determine where and how to store the scraped data. Options include databases, spreadsheets, or cloud-based storage.
Data Analysis: Leverage data analysis tools and techniques to derive actionable insights from the scraped data. Visualization tools can help present findings effectively.
Ethical and Legal Compliance: Scrutinize ethical and legal considerations, including data privacy and copyright. Engage in responsible data extraction that aligns with ethical standards and regulations.
Scraping Frequency: Exercise caution regarding the frequency of scraping activities to prevent overloading Kroger's servers or causing disruptions.
Conclusion
Kroger grocery data scraping opens the door to fresh insights for businesses, brands, and consumers in the grocery retail industry. By harnessing Kroger's data, retailers can optimize their product offerings and pricing strategies, while consumers can make more informed shopping decisions. However, it is crucial to prioritize ethical and legal considerations, including compliance with Kroger's terms of service and data privacy regulations. In the dynamic landscape of grocery retail, data is the key to unlocking opportunities and staying competitive. Grocery data extraction from Kroger promises to deliver fresh perspectives and strategic advantages in this ever-evolving industry.
#grocerydatascraping#restaurant data scraping#food data scraping services#food data scraping#fooddatascrapingservices#zomato api#web scraping services#grocerydatascrapingapi#restaurantdataextraction
4 notes
·
View notes
Text
Unlock the Future: Enroll in the Best Data Analytics Course in Coimbatore for Career Growth

Students who want to start a profession in the present era—where every choice is guided by data—should know how to make use of instruments that maximize its potential. Modern decision making is based on data analytics, which is therefore one of the most sought-after abilities in this age. Learning this will open doors in every sector. Enrolling in a data analytics course in Coimbatore is a prudent professional choice rather than a possibility anymore. At Xploreitcorp, we understand the need of upskill using our extensive course meant to provide useful experience. Though theory is vital, we make sure students are prepared for the professional environment by emphasizing frameworks including Power BI, industry tools, and real-time projects.
Value of Data Analytics for Students of Today
From social media interactions, financial transactions, medical records, gadgets under sensor control, data is created at an unbelievable pace every day. Companies need a competitive edge, hence learning how to analyze this data guarantees priceless knowledge. This is the reason data analytics professionals are so sought for. For students, knowing analytics offers a variety of professional routes in banking, e-commerce, logistics, education, and many more sectors of industry.
Using Python or R, a structured data analytics course in Coimbatore offered in teaches the foundations of statistics, data interpretation, coding, and visualization. These abilities enable students performing data cleansing, analysis, and visualization to tell a story with the data for many stakeholders. Moreover, data literacy improves decision-making and problem-solving abilities—qualities absolutely important in many disciplines outside of analytics.
Why is Coimbatore turning out to be a Data Analytics Education Hub?
Coimbatore, sometimes known as the Manchester of South India, is also a hive for technology innovation and education. The city is today home to a thriving startup culture and an expanding IT industry that gives students the much-needed chance to study and use knowledge in practical settings. Serious students will find the city ideal because of its reasonably low cost of living, contemporary infrastructure, qualified coaches, and friendly vibe.
In Coimbatore, a data analytics course in coimbatore closes the theory-practicing gap. While being world-class, the Xploreitcorp courses provided here are meant to satisfy the needs of the local businesses. Apart from courses, students can also benefit from professional networking, internships, and career counseling services catered to the employment situation of the city.
Powerful Partner in Data Analytics Training: Power BI
In data analysis, information presentation is absolutely important. Power BI data visualization and interactive dashboards help to clearly and simply show complicated data.
Many businesses have so embraced Power BI since it helps them. Students are thus enrolling in data analytics courses in Coimbatore in order to pick up Power BI during their training.
Power BI helps analysts turn complex data into easily understandable dashboards with instant interpretation capability. For students, knowing Power BI is learning how to use data visualizations to create stories. When this is combined with core analytics training, the student acquires the ideal mix of highly sought-after skills by companies.
Integrated Learning at Xploreitcorp
Xploreitcorp supports customized instruction. Our Coimbatore data analytics training is meant to be industry-aligned, hands-on, interactive, From day one, students engage with actual data sets under the direction of seasoned professionals who inspire them to approach data difficulties holistically. Important courses on preprocessing data, statistical analysis, basic machine learning, Python and SQL programming are also ones in which we cover.
To let students experience one of the top business intelligence systems worldwide, we also include Power BI within the course. Although some students would rather take a standalone Power BI training in Coimbatore, our combined approach guarantees they get the best of both worlds. Students graduate with a thorough knowledge of the analytics pipeline having learnt to manipulate, analyse, and visualise data.
Establishing solid career foundations
Many students in Coimbatore start a data analytics study because of its possibilities. Students who graduate qualify for jobs like Data Analyst, Business Intelligence Developer, Marketing Analyst, and Operations Analyst. These very profitable roles offer lots of room for development, innovation, and influence.
Using tools including Power BI, Excel, Tableau, Python, and SQL, students hone their skills. Students create portfolios employers value in addition to real-time tasks include fraud detection, customer segmentation, or sales forecasting. Whether they are startups or big corporations, the useful skills acquired from these initiatives can help students in any line of work.
Why Students Should Opt for a Coimbatore Power BI Course?
Students of the data analytics course in Coimbatore also get access to a Power BI course in Coimbatore. This short-term course helps students improve their visualization methods, dashboard modification and DAX (Data Analysis Expressions) data computation performance.
One thing is being able to evaluate data; yet, presenting it in a business-centric style offers far more value. Designed for such, Power BI is applied at Xploreitcorp to equip students to create dashboards for all business scenarios. Being able to see and analyze helps pupils to stand out and be future ready.
Certificates for Value-adding
Certifications have remained valuable in the competitive career scene of today as a sign of reputation. Learners of the data analytics course in Coimbatore with us in receive a certificate verifying their competencies in statistics, programming, and data analytics. Those who finish the optional Power BI course in coimbatore also get a certificate certifying them on business intelligence competency.
These certifications acknowledge your dedication to lifelong learning as much as they will benefit you in your field. Having a recognized certification from Xploreitcorp makes a world of difference as so many employers use certifications as a basic screening tool in the recruiting process.
What Makes Xploreitcorp Special?
We are rather proud of Xploreitcorp since it pioneered student-oriented education strategies. While many other colleges use antiquated, useless syllabi, we update our course of instruction to accommodate new market advancements. Our classrooms are set to support active learning, and our trainers come from many rich practical experiences.
Education, we are aware, transcends the four classroom walls. We thus also provide individualized private career advising sessions, seminars for developing resumes, and even interview preparation tools. Students can review the subjects whenever it would be most convenient by having lifetime access to the recorded sessions and resources.
The friendly culture of Coimbatore for students
Students would be wise to choose Coimbatore because of is rich in resources and friendly surroundings. Affordable housing, well-connected public transportation, co-working centers, and an active student body create a full ecosystem for development and learning. The city hosts regular tech meet-ups, coding hackathons, and guest lecturers to enable students stay current with new trends.
Choosing a data analytics course in Coimbatore is more than just signing up for a class; it's about joining a community that really values education, creativity, and professional successes.
Finally, use data to help you shape your future.
As sectors more rely on data for decision-making, the demand for qualified experts is growing. Enrolling in a data analytics course in Coimbatore enables students to start along the path toward a fast-growing and gratifying profession. Coupled with a Power BI course in Coimbatore, the training offers an exceptional mix of analytical abilities and visual storytelling, hence enhancing its value.
At Xploreitcorp, we educate and inspire leaders, analysts, and critical thinkers going beyond just tools. Our goal is to give students knowledge with relevance and impact. Whether you are a recent graduate, student in college, or someone wishing to change careers, here is a chance to create a future based on facts.
FAQs:
1.Who may enrol in Coimbatore's data analytics program?
Welcome are students, new graduates, professionals wishing to enter data roles.
2.Is the data analytics curriculum including Power BI?
Indeed, basic to intermediate Power BI is offered; advanced students can enrol in a focused Power BI training in Coimbatore.
3.Does prior programming expertise count?
No, our course fit beginners and begins with basics.
4.Will my completion of the course lead to certification?
Yes, Xploreitcorp offers acknowledged certifications for Power BI and analytics courses.
5.Does the program promote job placement?
True. We offer placement support, interview training, and resume help.
0 notes
Text
How AI is Revolutionizing Financial Modelling and Decision-Making in 2025
In 2025, the world of finance is experiencing a paradigm shift. Artificial Intelligence (AI) has rapidly moved from theoretical conversations in boardrooms to practical implementation across investment firms, startups, and Fortune 500 companies. Among the most profoundly impacted areas is financial modelling—the backbone of decision-making in finance.
Once a manual, spreadsheet-heavy process prone to human error and cognitive bias, financial modelling is being transformed by the power of AI. Automation, machine learning, and intelligent analytics are enabling finance professionals to build smarter, faster, and more reliable models. But while AI is revolutionizing how we work, understanding its integration into finance requires a solid foundation—and that’s where the Best Financial Modelling Certification Course in Bangalore becomes essential.
Let’s dive into how AI is reshaping the finance function and why upskilling is more important than ever.
The Traditional Financial Modelling Landscape
Traditionally, financial modelling involves projecting a company's financial performance using tools like Excel, based on assumptions related to revenues, costs, capital expenditures, and growth rates. It’s widely used in:
Investment banking
Private equity and venture capital
Corporate finance
Equity research
M&A analysis
Start-up fundraising
However, manual modelling processes come with limitations:
Time-consuming and error-prone
Based on static assumptions
Difficult to adapt to fast-changing markets
Heavy reliance on historical data
This is exactly where AI is stepping in—and excelling.
How AI is Transforming Financial Modelling
1. Automation of Repetitive Tasks
AI-powered tools can now automate the bulk of data gathering, cleansing, and integration tasks. What once took analysts hours can now be done in seconds.
Example: Tools like Microsoft Excel now include AI-driven “Ideas” features that help identify trends and anomalies in financial data automatically.
2. Advanced Forecasting with Machine Learning
Machine learning (ML) models can predict financial performance based on historical trends, current data, and external market conditions—making forecasts far more accurate and dynamic.
Use Case: An AI model can forecast sales based on hundreds of variables like customer behavior, market sentiment, and macroeconomic indicators—well beyond traditional revenue drivers.
3. Natural Language Processing (NLP)
NLP allows AI systems to process vast amounts of unstructured financial data—like earnings call transcripts, news articles, and regulatory filings—to extract key insights.
Impact: Analysts can now integrate qualitative factors into models, which was previously difficult with purely quantitative tools.
4. Scenario Modelling and Risk Analysis
AI algorithms can simulate hundreds of financial scenarios in seconds, helping decision-makers better understand risk and identify optimal strategies.
Real-world Example: In credit modelling, AI can assess borrower risk not just based on credit history but also by evaluating alternative data sources like payment behavior or social signals.
AI in Financial Modelling Tools
Several platforms are already integrating AI to enhance financial modelling:
Alteryx – Automates analytics and data workflows, popular among finance professionals for complex data manipulation.
Datarails – Combines Excel with real-time data analytics for CFOs and FP&A teams.
IBM Planning Analytics – Uses AI for advanced planning, budgeting, and forecasting.
Python & R – Open-source programming languages with powerful libraries like TensorFlow and Scikit-learn used for building custom AI models.
These tools, once reserved for data scientists, are now being adopted by finance professionals—provided they have the right training.
Why Upskilling is Non-Negotiable
AI is not replacing finance professionals—it’s transforming their role from data crunchers to strategic thinkers. However, this shift demands new skills:
Understanding how AI algorithms work
Building and interpreting machine learning models
Integrating AI tools into traditional financial workflows
Making data-driven, ethical, and accountable decisions
To thrive in this new era, finance professionals must bridge the gap between traditional financial knowledge and modern technological fluency.
Why the Best Financial Modelling Certification Course in Bangalore is the Smart Move
Bangalore, India’s tech capital, is now becoming a hub for fintech and finance talent. If you’re looking to future-proof your career, enrolling in the Best Financial Modelling Certification Course in Bangalore offers a decisive edge.
What You’ll Learn:
Core Excel-based financial modelling techniques
Company valuation: DCF, comparables, and precedent transactions
Integration of AI tools and Python in financial analysis
Forecasting models using machine learning
Real-world case studies, project work, and industry mentorship
Key Benefits:
Learn from industry experts with AI and finance experience
Gain hands-on exposure to the latest tools used in top finance firms
Become job-ready for roles in investment banking, FP&A, private equity, and fintech
Build a strong professional network in one of the fastest-growing cities in India
Final Thoughts: Embrace the Future with Confidence
The age of AI-enhanced financial modelling is here—and it’s only going to grow. For finance professionals, this is not a threat, but an incredible opportunity to work smarter, make better decisions, and deliver more value.
By blending traditional finance skills with modern AI capabilities, you’ll be uniquely positioned to lead in this era of data-driven strategy.
So take the first step—enroll in the Best Financial Modelling Certification Course in Bangalore and future-proof your finance career today.
0 notes
Text
data cleansing
🧹 Common Data Cleansing Tasks ChatGPT Can Handle
ChatGPT is capable of assisting with various data cleaning operations, including:
Standardizing text formats: Converting text to a consistent case (e.g., all uppercase or lowercase).
Correcting inconsistent entries: Aligning variations of similar entries (e.g., "NY" vs. "New York").
Handling missing values: Identifying and filling in missing data points.
Removing duplicates: Detecting and eliminating duplicate records.
Parsing and formatting dates: Ensuring date fields follow a consistent format.
Flattening nested data structures: Transforming complex data into a flat, tabular format.
Validating data entries: Checking for and correcting invalid data entries.robertorocha.infoPackt
For instance, in a dataset containing employee information, ChatGPT can standardize inconsistent name formats and unify various date formats for joining dates. KDnuggets+2Packt+2robertorocha.info+2
🛠️ How to Use ChatGPT for Data Cleaning
To utilize ChatGPT for data cleaning, follow these steps:tirabassi.com
Prepare Your Dataset: Ensure your data is in a structured format, such as CSV or Excel.
Upload the File: In ChatGPT, click the "+" icon to upload your dataset.
Describe the Cleaning Task: Clearly specify what cleaning operations you want to perform. For example:https://data-finder.co.uk/service/data-cleansing/
"Please standardize the 'Employee Name' column to title case and convert the 'Joining Date' column to the YYYY-MM-DD format."
Review and Execute: ChatGPT will generate and execute Python code to perform the specified cleaning tasks, providing you with the cleaned dataset.Medium+2OpenAI+2Packt+2
This approach is particularly beneficial for users without extensive coding experience, as ChatGPT handles the scripting and execution of data cleaning operations. Medium+3OpenAI+3StatsAmerica+3
⚠️ Considerations and Limitations
While ChatGPT offers significant advantages in data cleaning, be mindful of the following:
Accuracy: ChatGPT performs best with well-defined tasks. Ambiguous instructions may lead to suboptimal results.
Data Sensitivity: Avoid uploading confidential or sensitive data, especially when using non-enterprise versions of ChatGPT.
Scalability: For very large datasets (e.g., millions of rows), consider breaking the data into smaller chunks or using specialized data processing tools. OpenAI Community
📚 Additional Resources
For a visual guide on using ChatGPT for data cleaning, you might find this tutorial helpful:
Feel free to share a sample of your dataset or describe your specific data cleaning
1 note
·
View note
Text
data cleansing
What is Data Cleansing and Why Is It Important?
In today’s digital age, data is one of the most valuable assets for any business. However, not all data is useful. Inaccurate, duplicate, or incomplete information can lead to poor decision-making, loss of revenue, and damaged reputations. That’s where data cleansing comes into play.
Data cleansing, also known as data cleaning or data scrubbing, is the process of detecting and correcting (or removing) corrupt, inaccurate, or irrelevant records from a dataset. The goal is to improve data quality so that it can be used effectively for business intelligence, marketing, operations, and analytics.
Key Steps in Data Cleansing
Removing Duplicate Records Duplicate entries can inflate figures and lead to misleading insights. Identifying and deleting these copies ensures that each customer, transaction, or product is only recorded once.
Correcting Inaccurate Data Errors in spelling, formatting, or inconsistent data entries are common. For example, “New York” might appear as “NY” or “N.Y.” A standard format should be enforced to ensure consistency.
Filling in Missing Information Missing data can cause gaps in reports and analysis. Where possible, missing fields should be completed using reliable sources or inferred through data relationships.
Standardizing Data Formats Formatting data uniformly (e.g., date formats, phone numbers, currency symbols) across all entries ensures compatibility and easy integration with different systems.
Validating Data Accuracy Comparing data against trusted external sources (like official databases) can help verify the accuracy of information such as addresses, emails, and contact details.
Why Businesses Need Data Cleansing
Improved Decision Making Clean data leads to more accurate reports, which helps management make better strategic decisions.
Enhanced Customer Experience Clean and accurate customer data allows for personalized and effective communication, increasing customer satisfaction and retention.
Increased Efficiency Employees spend less time correcting errors and more time on productive tasks. Automation of clean data can streamline operations.
Cost Reduction Bad data can result in wasted marketing spend, incorrect orders, and misinformed strategies. Data cleansing minimizes these costly errors.
Compliance and Risk Management Many industries have strict regulations around data privacy and accuracy. Clean data helps businesses stay compliant and avoid fines or legal issues.
Tools and Techniques for Data Cleansing
There are many software tools that support data cleansing, including Microsoft Excel, OpenRefine, Talend, Trifacta, and more advanced platforms like Informatica and SAS Data Quality. Techniques often involve scripting (e.g., Python or SQL), machine learning for identifying patterns, and manual reviews for sensitive or complex data sets.
Conclusion
Clean data is crucial for business success. Without it, even the best strategies and tools can fail. By investing in regular data cleansing, organizations not only protect their operations but also empower their teams to perform better with confidence in the information they rely on. It’s not just about cleaning data—it's about unlocking its full value.
0 notes
Text
The Complete Guide to Spotfire: Analytics, Visualization, and Expert Training
Businesses want powerful gear to investigate, visualize, and interpret complicated datasets correctly. Spotfire Analyticsis one such platform that permits corporations to convert uncooked statistics into actionable insights. Whether you're looking for superior Spotfire Data Visualization, custom Spotfire Development, or professional QA Consulting Services, Tech Innovations gives complete answers to help you leverage Spotfire's full ability.
What is Spotfire Analytics?
The business intelligence and information analytics platform Spotfire Analytics comes from TIBCO via its development method. The platform gives organizations the power to study and break down significant data collections in real-time through visualization tools. Spotfire enables customers to construct interactive dashboards and predictive models alongside AI-pushed insights by way of its smooth-to-use drag-and-drop interface, which calls for minimum coding heritage.
Key Features of Spotfire Analytics:
Interactive Dashboards – Create dynamic visualizations for better decision-making.
The platform features predictive analytics capabilities along with built-in statistical tools in addition to machine learning functions.
Real-Time Data Processing – Connect to multiple data sources for live insights.
Users can enhance functionality through the implementation of R, Python, and IronPython scripts.
Spotfire Data Visualization: Turning Data into Insights
Spotfire Data Visualization stands as the most distinctive characteristic of Spotfire's system. Information systems available in Spotfire empower business users to develop various visualizations, including heat maps, scatter plots and bar charts, which expose hidden patterns.
Why Choose Spotfire for Data Visualization?
Standard users need no technical knowledge to operate this interface.
Interactive Visualizations – Drill down into data with just a few clicks.
Customizable Dashboards – Tailor reports to meet business needs.
Collaboration Tools – Share insights across teams seamlessly.
Kanika Tech Innovations helps businesses maximize their Spotfire Data Visualization potential by designing custom dashboards that align with specific business goals.
Spotfire Development: Custom Solutions for Your Business
The analytics requirements of every business are different, so Spotfire Development adapts the platform to match specific organizational needs. The development team at Kanika Tech Innovations handles all of Spotfire's development projects, which include both system integration and customized scripting work.
Spotfire Development Services Include:
Custom Scripting & Automation – The platform requires no technical expertise from users to operate its interface.
API Integrations – Drill down into data with just a few clicks.
Performance Optimization – The system enables users to create personalized dashboards according to their specific business requirements.
Cloud & On-Premise Deployment – Share insights across teams seamlessly.
Enhance Data Quality with QA Consulting Services
Accurate data functions as the fundamental base which supports successful analytics operations. Kanika Tech Innovations provides QA Consulting Services to maintain data consistency along with reliability and integrity inside Spotfire platforms.
Our QA Services Include:
Data Validation & Cleansing – The data validation and cleansing process removes both errors and duplicate data entries.
Dashboard Testing – Verifying visualizations for accuracy.
Performance Testing –The evaluation of dashboard performance provides assurance regarding efficient dashboard loading speed.
Security Audits – Protecting sensitive business data.
Expert Spotfire Training for Your Team
Organizations need proper training to fully utilize Spotfire's capabilities. Kanika Tech Innovations provides Spotfire Training programs designed for beginners and advanced users alike.
Spotfire Training Modules:
Introduction to Spotfire Analytics – Basic navigation and visualization.
Advanced Data Analysis – Predictive modeling and scripting form the advanced aspect of data analytics within Spotfire.
Dashboard Development – Building interactive reports.
Administration & Deployment – Building interactive reports.
Through experience-based training, we guarantee your team will reach maximum Spotfire capabilities to achieve better workplace performance and decisions.
Why Choose Kanika Tech Innovations?
Certified Spotfire Experts – Years of experience in analytics and BI.
Custom Solutions – Tailored to your business needs.
End-to-End Support – The company supports customers across every phase, from project launch to training completion.
Proven Track Record – The company maintains trust between customers in various business sectors, including enterprise and academic institutions.
Final Thoughts
Spotfire Analytics is a game-changer for businesses looking to harness the power of data. With Spotfire Data Visualization, custom Spotfire Development, QA Consulting Services, and expert Spotfire Training, Innovations ensures you get the most out of this powerful platform.
1 note
·
View note
Text
How Generative AI Platform Development Is Transforming Legacy Systems into Smart, Self-Optimizing Digital Engines?
Legacy systems once defined the backbone of enterprise IT infrastructure. But in today’s fast-paced, data-rich environment, they often fall short—limited by rigid architectures, manual processes, and an inability to learn or adapt. Enter Generative AI platform development. This transformative technology is not just modernizing outdated systems—it’s evolving them into intelligent, self-optimizing engines that can learn, adapt, and improve with minimal human intervention.

In this blog, we explore how generative AI is breathing new life into legacy systems, unlocking hidden efficiencies, and enabling scalable innovation across industries.
Why Legacy Systems Hold Enterprises Back
Legacy systems—though critical to operations—were built in a different era. Many suffer from:
Inflexible architectures that are hard to scale or integrate.
Outdated programming languages with dwindling support.
Manual data processing prone to human error.
High maintenance costs with limited ROI.
Despite this, they contain valuable business logic, historical data, and infrastructure investments. Rather than rip and replace, enterprises are turning to generative AI to augment and future-proof their legacy assets.
What Is Generative AI Platform Development?
Generative AI platform development involves building AI-powered systems that can generate outputs—such as code, text, processes, or insights—autonomously. These platforms leverage foundation models, machine learning pipelines, and real-time data integrations to continuously evolve, improve, and adapt based on feedback and context.
When applied to legacy systems, generative AI platforms can:
Translate and refactor old code
Generate documentation for obscure processes
Suggest optimizations in real time
Automate routine operations
Personalize workflows across departments
Core Capabilities That Modernize Legacy Systems
1. AI-Driven Code Refactoring
One of the most powerful applications of generative AI is in automatic code translation. Using models trained on millions of code examples, platforms can convert COBOL or .NET systems into modern, cloud-native languages like Python or Java, reducing technical debt without manual reengineering.
2. Automated Process Discovery and Optimization
Generative AI can ingest data logs and legacy documentation to uncover workflows and inefficiencies. It then proposes process improvements, or even generates automated scripts and bots to optimize performance.
3. Smart Data Integration and Cleansing
Legacy databases often have siloed, inconsistent data. Generative AI platforms can unify these silos using data mapping, intelligent transformation, and anomaly detection—improving data quality while preparing it for analytics or AI applications.
4. Natural Language Interfaces for Old Systems
With generative AI, users can query legacy systems using natural language. This bridges usability gaps, eliminates training barriers, and democratizes access to business insights for non-technical employees.
5. Self-Learning Algorithms
Legacy platforms can now learn from past behavior. By feeding operational data into generative AI models, businesses can enable predictive maintenance, dynamic resource allocation, and AI-assisted decision-making.
Industry Use Cases: From Static to Smart
Finance
Banks with legacy mainframes use generative AI to automate compliance reporting, modernize core banking services, and enable real-time fraud detection—all without overhauling the entire tech stack.
Healthcare
Hospitals are integrating generative AI with EHRs to improve clinical documentation, identify anomalies in patient records, and automate repetitive tasks for staff—all while preserving critical legacy infrastructure.
Manufacturing
Legacy ERP systems are being enhanced with generative AI to forecast supply chain disruptions, recommend inventory restocking schedules, and reduce downtime using predictive insights.
Business Benefits of Generative AI for Legacy Modernization
Reduced Modernization Cost: Avoid the need for full system replacement.
Faster Time to Value: Improvements and automation can be deployed incrementally.
Enhanced Scalability: Systems adapt to increasing data volumes and business complexity.
Improved Employee Experience: Natural language and automation reduce cognitive load.
Future-Ready Infrastructure: Platforms become agile, secure, and cloud-compatible.
Challenges to Address
While generative AI is a powerful enabler, successful implementation requires:
Data governance: Legacy systems may hold unstructured or sensitive data.
Model alignment: Tailoring AI models to understand domain-specific processes.
Security protocols: Protecting integrated platforms from vulnerabilities.
Change management: Training teams to trust and collaborate with AI-enhanced tools.
These are surmountable with a clear roadmap and the right AI development partner.
A Step-by-Step Path to AI Platform Integration
Audit your legacy systems for compatibility, data quality, and usage.
Identify high-value use cases such as automation, reporting, or workflow enhancement.
Start small with pilots using generative AI for documentation, chat interfaces, or analytics.
Scale gradually across departments with platform-wide automation and optimization.
Continuously fine-tune models with operational feedback and human oversight.
The Future of Enterprise Systems Is Generative
Generative AI platform development is no longer experimental—it’s strategic. As more organizations shift from static operations to dynamic, AI-powered workflows, legacy systems will not be left behind. Instead, they’ll evolve into intelligent engines that power innovation, reduce costs, and unlock growth.
Whether you’re in finance, healthcare, logistics, or manufacturing, now is the time to transform your legacy foundation into a self-optimizing digital powerhouse.
0 notes
Text
The top Data Engineering trends to look for in 2025

Data engineering is the unsung hero of our data-driven world. It's the critical discipline that builds and maintains the robust infrastructure enabling organizations to collect, store, process, and analyze vast amounts of data. As we navigate mid-2025, this foundational field is evolving at an unprecedented pace, driven by the exponential growth of data, the insatiable demand for real-time insights, and the transformative power of AI.
Staying ahead of these shifts is no longer optional; it's essential for data engineers and the organizations they support. Let's dive into the key data engineering trends that are defining the landscape in 2025.
1. The Dominance of the Data Lakehouse
What it is: The data lakehouse architecture continues its strong upward trajectory, aiming to unify the best features of data lakes (flexible, low-cost storage for raw, diverse data types) and data warehouses (structured data management, ACID transactions, and robust governance). Why it's significant: It offers a single platform for various analytics workloads, from BI and reporting to AI and machine learning, reducing data silos, complexity, and redundancy. Open table formats like Apache Iceberg, Delta Lake, and Hudi are pivotal in enabling lakehouse capabilities. Impact: Greater data accessibility, improved data quality and reliability for analytics, simplified data architecture, and cost efficiencies. Key Technologies: Databricks, Snowflake, Amazon S3, Azure Data Lake Storage, Apache Spark, and open table formats.
2. AI-Powered Data Engineering (Including Generative AI)
What it is: Artificial intelligence, and increasingly Generative AI, are becoming integral to data engineering itself. This involves using AI/ML to automate and optimize various data engineering tasks. Why it's significant: AI can significantly boost efficiency, reduce manual effort, improve data quality, and even help generate code for data pipelines or transformations. Impact: * Automated Data Integration & Transformation: AI tools can now automate aspects of data mapping, cleansing, and pipeline optimization. * Intelligent Data Quality & Anomaly Detection: ML algorithms can proactively identify and flag data quality issues or anomalies in pipelines. * Optimized Pipeline Performance: AI can help in tuning and optimizing the performance of data workflows. * Generative AI for Code & Documentation: LLMs are being used to assist in writing SQL queries, Python scripts for ETL, and auto-generating documentation. Key Technologies: AI-driven ETL/ELT tools, MLOps frameworks integrated with DataOps, platforms with built-in AI capabilities (e.g., Databricks AI Functions, AWS DMS with GenAI).
3. Real-Time Data Processing & Streaming Analytics as the Norm
What it is: The demand for immediate insights and actions based on live data streams continues to grow. Batch processing is no longer sufficient for many use cases. Why it's significant: Businesses across industries like e-commerce, finance, IoT, and logistics require real-time capabilities for fraud detection, personalized recommendations, operational monitoring, and instant decision-making. Impact: A shift towards streaming architectures, event-driven data pipelines, and tools that can handle high-throughput, low-latency data. Key Technologies: Apache Kafka, Apache Flink, Apache Spark Streaming, Apache Pulsar, cloud-native streaming services (e.g., Amazon Kinesis, Google Cloud Dataflow, Azure Stream Analytics), and real-time analytical databases.
4. The Rise of Data Mesh & Data Fabric Architectures
What it is: * Data Mesh: A decentralized sociotechnical approach that emphasizes domain-oriented data ownership, treating data as a product, self-serve data infrastructure, and federated computational governance. * Data Fabric: An architectural approach that automates data integration and delivery across disparate data sources, often using metadata and AI to provide a unified view and access to data regardless of where it resides. Why it's significant: Traditional centralized data architectures struggle with the scale and complexity of modern data. These approaches offer greater agility, scalability, and empower domain teams. Impact: Improved data accessibility and discoverability, faster time-to-insight for domain teams, reduced bottlenecks for central data teams, and better alignment of data with business domains. Key Technologies: Data catalogs, data virtualization tools, API-based data access, and platforms supporting decentralized data management.
5. Enhanced Focus on Data Observability & Governance
What it is: * Data Observability: Going beyond traditional monitoring to provide deep visibility into the health and state of data and data pipelines. It involves tracking data lineage, quality, freshness, schema changes, and distribution. * Data Governance by Design: Integrating robust data governance, security, and compliance practices directly into the data lifecycle and infrastructure from the outset, rather than as an afterthought. Why it's significant: As data volumes and complexity grow, ensuring data quality, reliability, and compliance (e.g., GDPR, CCPA) becomes paramount for building trust and making sound decisions. Regulatory landscapes, like the EU AI Act, are also making strong governance non-negotiable. Impact: Improved data trust and reliability, faster incident resolution, better compliance, and more secure data handling. Key Technologies: AI-powered data observability platforms, data cataloging tools with governance features, automated data quality frameworks, and tools supporting data lineage.
6. Maturation of DataOps and MLOps Practices
What it is: * DataOps: Applying Agile and DevOps principles (automation, collaboration, continuous integration/continuous delivery - CI/CD) to the entire data analytics lifecycle, from data ingestion to insight delivery. * MLOps: Extending DevOps principles specifically to the machine learning lifecycle, focusing on streamlining model development, deployment, monitoring, and retraining. Why it's significant: These practices are crucial for improving the speed, quality, reliability, and efficiency of data and machine learning pipelines. Impact: Faster delivery of data products and ML models, improved data quality, enhanced collaboration between data engineers, data scientists, and IT operations, and more reliable production systems. Key Technologies: Workflow orchestration tools (e.g., Apache Airflow, Kestra), CI/CD tools (e.g., Jenkins, GitLab CI), version control systems (Git), containerization (Docker, Kubernetes), and MLOps platforms (e.g., MLflow, Kubeflow, SageMaker, Azure ML).
The Cross-Cutting Theme: Cloud-Native and Cost Optimization
Underpinning many of these trends is the continued dominance of cloud-native data engineering. Cloud platforms (AWS, Azure, GCP) provide the scalable, flexible, and managed services that are essential for modern data infrastructure. Coupled with this is an increasing focus on cloud cost optimization (FinOps for data), as organizations strive to manage and reduce the expenses associated with large-scale data processing and storage in the cloud.
The Evolving Role of the Data Engineer
These trends are reshaping the role of the data engineer. Beyond building pipelines, data engineers in 2025 are increasingly becoming architects of more intelligent, automated, and governed data systems. Skills in AI/ML, cloud platforms, real-time processing, and distributed architectures are becoming even more crucial.
Global Relevance, Local Impact
These global data engineering trends are particularly critical for rapidly developing digital economies. In countries like India, where the data explosion is immense and the drive for digital transformation is strong, adopting these advanced data engineering practices is key to harnessing data for innovation, improving operational efficiency, and building competitive advantages on a global scale.
Conclusion: Building the Future, One Pipeline at a Time
The field of data engineering is more dynamic and critical than ever. The trends of 2025 point towards more automated, real-time, governed, and AI-augmented data infrastructures. For data engineering professionals and the organizations they serve, embracing these changes means not just keeping pace, but actively shaping the future of how data powers our world.
1 note
·
View note
Text
Say Goodbye to Latency: Alltick API Delivers Real-Time Market Data!
In the fast-paced financial market, what does 15 minutes mean? While traditional market data still shows you "historical prices," Bitcoin may have surged by 10%, futures contracts could have triggered margin calls, and forex rates might have experienced wild fluctuations. This is the decision gap created by delayed data—you only see the market's "past."
Alltick API was created to solve this pain point. As a next-generation standardized data interface solution, Alltick redefines how financial data is accessed through technological innovation. Our API delivers real-time market data streams across all asset classes, including stocks, forex, futures, and cryptocurrencies, with millisecond response times. Say goodbye to the traditional 15-minute delay trap, and make every trading decision based on the "now" of the market.
Why Choose Alltick Data Interfaces?
✅ Zero-Latency Direct Exchange Connection Utilizing a distributed data collection architecture, we connect directly to over 50 top exchanges, including NYSE, NASDAQ, and CME, with data update frequencies precise to the microsecond.
✅ Comprehensive Interface Ecosystem We offer various data interface formats, including RESTful, WebSocket, and FIX protocols, perfectly supporting the diverse needs of high-frequency trading systems, mobile apps, and quantitative analysis platforms, with the capacity for billions of API calls daily.
✅ Intelligent Data Cleansing Engine With built-in mechanisms for anomaly filtering, data completion, and multi-source validation, we ensure that every piece of market data transmitted undergoes strict standardization, allowing direct integration with your trading algorithms without the need for secondary cleansing.
✅ Developer-Friendly Design We provide SDKs in Python, Java, C++, and comprehensive technical documentation, allowing you to complete data interface calls in just 3 lines of code. Whether you’re an independent developer or an enterprise user, the 10-minute onboarding experience will completely change your perception of financial data services.
Innovation Scenarios Driven by Data Interfaces
Quantitative Trading Teams: Build high-frequency arbitrage strategies based on real-time tick data.
Smart Investment Platforms: Create an exceptional user experience with millisecond market updates.
Blockchain Projects: Accurately capture signals of cryptocurrency market fluctuations.
Fintech Companies: Rapidly establish proprietary market analysis systems.
“In the world of algorithmic trading, speed is synonymous with excess returns.” — A CTO of a private equity firm remarked after using Alltick API.
Register now to receive a 7-day full-feature trial and experience how a no-latency data interface can inject "time value" into your trading system. Visit the Alltick website for dedicated technical support, and let us help you turn data interfaces into your core competitive advantage!
【Alltick API—Making Real-Time Data Your Second Nature】 Seize the market opportunity by eliminating every millisecond of delay.

0 notes
Text
Data Engineer vs Data Analyst vs Data Scientist vs ML Engineer: Choose Your Perfect Data Career!
In today’s rapidly evolving tech world, career opportunities in data-related fields are expanding like never before. However, with multiple roles like Data Engineer vs Data Analyst vs Data Scientist vs ML Engineer, newcomers — and even seasoned professionals — often find it confusing to understand how these roles differ.
At Yasir Insights, we think that having clarity makes professional selections more intelligent. We’ll go over the particular duties, necessary abilities, and important differences between these well-liked Data Engineer vs Data Analyst vs Data Scientist vs ML Engineer data positions in this blog.
Also Read: Data Engineer vs Data Analyst vs Data Scientist vs ML Engineer
Introduction to Data Engineer vs Data Analyst vs Data Scientist vs ML Engineer
The Data Science and Machine Learning Development Lifecycle (MLDLC) includes stages like planning, data gathering, preprocessing, exploratory analysis, modelling, deployment, and optimisation. In order to effectively manage these intricate phases, the burden is distributed among specialised positions, each of which plays a vital part in the project’s success.
Data Engineer
Who is a Data Engineer?
The basis of the data ecosystem is built by data engineers. They concentrate on collecting, sanitising, and getting data ready for modelling or further analysis. Think of them as mining precious raw materials — in this case, data — from complex and diverse sources.
Key Responsibilities:
Collect and extract data from different sources (APIS, databases, web scraping).
Design and maintain scalable data pipelines.
Clean, transform, and store data in warehouses or lakes.
Optimise database performance and security.
Required Skills:
Strong knowledge of Data Structures and Algorithms.
Expertise in Database Management Systems (DBMS).
Familiarity with Big Data tools (like Hadoop, Spark).
Hands-on experience with cloud platforms (AWS, Azure, GCP).
Proficiency in building and managing ETL (Extract, Transform, Load) pipelines.
Data Analyst
Who is a Data Analyst?
Data analysts take over once the data has been cleansed and arranged. Their primary responsibility is to evaluate data in order to get valuable business insights. They provide answers to important concerns regarding the past and its causes.
Key Responsibilities:
Perform Exploratory Data Analysis (EDA).
Create visualisations and dashboards to represent insights.
Identify patterns, trends, and correlations in datasets.
Provide reports to support data-driven decision-making.
Required Skills:
Strong Statistical knowledge.
Proficiency in programming languages like Python or R.
Expertise in Data Visualisation tools (Tableau, Power BI, matplotlib).
Excellent communication skills to present findings clearly.
Experience working with SQL databases.
Data Scientist
Who is a Data Scientist?
Data Scientists build upon the work of Data Analysts by developing predictive models and machine learning algorithms. While analysts focus on the “what” and “why,” Data Scientists focus on the “what’s next.”
Key Responsibilities:
Design and implement Machine Learning models.
Perform hypothesis testing, A/B testing, and predictive analytics.
Derive strategic insights for product improvements and new innovations.
Communicate technical findings to stakeholders.
Required Skills:
Mastery of Statistics and Probability.
Strong programming skills (Python, R, SQL).
Deep understanding of Machine Learning algorithms.
Ability to handle large datasets using Big Data technologies.
Critical thinking and problem-solving abilities.
Machine Learning Engineer
Who is a Machine Learning Engineer?
Machine Learning Engineers (MLES) take the models developed by Data Scientists and make them production-ready. They ensure models are deployed, scalable, monitored, and maintained effectively in real-world systems.
Key Responsibilities:
Deploy machine learning models into production environments.
Optimise and scale ML models for performance and efficiency.
Continuously monitor and retrain models based on real-time data.
Collaborate with software engineers and data scientists for integration.
Required Skills:
Strong foundations in Linear Algebra, Calculus, and Probability.
Mastery of Machine Learning frameworks (TensorFlow, PyTorch, Scikit-learn).
Proficiency in programming languages (Python, Java, Scala).
Knowledge of Distributed Systems and Software Engineering principles.
Familiarity with MLOps tools for automation and monitoring.
Summary: Data Engineer vs Data Analyst vs Data Scientist vs ML Engineer
Data Engineer
Focus Area: Data Collection & Processing
Key Skills: DBMS, Big Data, Cloud Computing
Objective: Build and maintain data infrastructure
Data Analyst
Focus Area: Data Interpretation & Reporting
Key Skills: Statistics, Python/R, Visualisation Tools
Objective: Analyse data and extract insights
Data Scientist
Focus Area: Predictive Modelling
Key Skills: Machine Learning, Statistics, Data Analysis
Objective: Build predictive models and strategies
Machine Learning Engineer
Focus Area: Model Deployment & Optimisation
Key Skills: ML Frameworks, Software Engineering
Objective: Deploy and optimise ML models in production
Frequently Asked Questions (FAQS)
Q1: Can a Data Engineer become a Data Scientist?
Yes! With additional skills in machine learning, statistics, and model building, a Data Engineer can transition into a Data Scientist role.
Q2: Is coding necessary for Data Analysts?
While deep coding isn’t mandatory, familiarity with SQL, Python, or R greatly enhances a Data Analyst’s effectiveness.
Q3: What is the difference between a Data Scientist and an ML Engineer?
Data Scientists focus more on model development and experimentation, while ML Engineers focus on deploying and scaling those models.
Q4: Which role is the best for beginners?
If you love problem-solving and analysis, start as a Data Analyst. If you enjoy coding and systems, a Data Engineer might be your path.
Published By:
Mirza Yasir Abdullah Baig
Repost This Article and built Your Connection With Others
0 notes
Text
Transform Your Future: Enroll in the Best Data Analytics Course in Coimbatore for Real-World Success

Data nowadays is more than just a set of figures in the modern society. It is a priceless tool. Globally, it drives economic activity, corporate strategies, and innovation as well as business policies. For students—especially those who want to guarantee their future—the science and artistic ability of data analytics calls for mastering. Perhaps the finest choice you could make to forward your analytics career is enrolling in a data analytics course in Coimbatore. Through rigorous training and practical industry experience, Xploreitcorp is well-known for turning unassuming ability into polished professionals.
The number of data-related career prospects is exploding as digital and automated companies together with AI-powered decision making gain increasing appeal. Learning Excel, SQL, Python, and data visualization tools like Power BI is therefore absolutely vital in turn. All of these fundamental abilities should be taught in a thorough data analytics course in Coimbatore so that students may pursue rich futures in many different fields.
Coimbatore Contactless Learning Made Simple Using Data Analytics
The picture of Coimbatore has evolved from one of a merely industrial or textile city. Coimbatore is today a digitally advanced learning and innovation metropolis. There are many IT companies, colleges, startups, and an established ecosystem there all of which offer unmatched professional training. Apart from all this, Coimbatore appeals more to students since its low cost of living makes it reasonable.
Now rising in Coimbatore are institutes such Xploreitcorp that provide training courses and assist graduates in finding employment, hence enhancing the appeal of this city. This institute offers both online and offline courses so students may follow strategies by working on real-life situations. Perfect for professionals searching for a Coimbatore data analytics degree, the city is ideal for students wishing to join the cutthroat tech sector.
What a data analytics course in Coimbatore will teach you?
The Coimbatore data analytics course offered by Xploreitcorp has a thorough syllabus meant to expose students completely in the subject. From data collecting, data cleansing, data modeling, data interpretation all the way to data visualization, you will be practically exposed. Before diving into Python for scripting, machine learning, and much more, students study the basics of Excel and Statistics then master more sophisticated tools like SQL for data extraction.
Still far more helpful, though, is the hands-on project approach of the course. Students are instructed in solving problems using actual datasets spanning many fields, including retail, logistics, healthcare, and finance. Design dashboards and business insights and rehearsed, which all help to ensure you are interpreting concepts in real-time so your ready from day one.
The part Power BI plays in data analytics
Without a great data visualization tool, no modern analytics toolbox is whole. Any aspiring data professional must be able to communicate insights using interactive dashboards; this is taught in the Power BI course available at Xploreitcorp. We at Xploreitcorp make sure our students become experts in Data Analytics with Power BI, so we integrate the Power BI course in Coimbatore into our data analytics program.
Users of Power BI can develop real-time dashboards including several data sources. For stakeholders, reports are simple to produce and patterns and trends are readily apparent. For students hoping to land in markets needing data storytelling services, Power BI abilities can boost value.
Combining the Power BI course in coimbatore with data analytics training results in an all-rounded expert who not only understands data but also knows how to use data presentation strategies to make important decisions, hence enhancing business intelligence.
Professional Prospects Following Course Completion
Following Coimbatore data analytics courses, new opportunities abound: the need for professionals is growing as businesses look to data to boost efficiency and cut costs while forecasting future trends. With some extra training, graduates from the program will be able to readily enter positions including Data Analyst, Business Intelligence Analyst, Reporting Analyst, Power BI Developer, and even Data Scientist.
Having concurrently finished the Power BI course in Coimbatore puts you on a higher level. Combining visualizing and reporting techniques with analytics powers a strong career profile. Your professional abilities—in IT, healthcare, banking, e-commerce, manufacturing, or even marketing—are likely to be in great demand.
At Xploreitcorp, we further assist students with placement, simulated interviews, resume writing, even industry partner networking for job prospects. We do not pay just attention to schooling. We emphasize employability.
Why is Xploreitcorp the ideal partner for your perfect training?
Our firm view at Xploreitcorp is that education becomes valuable when it results in real-world application. Having previously worked on multi-million dollar analytics projects, the industry veterans among our team provide actual value. Their expertise transcends textbooks and classrooms; they offer direction, practical experience, and case studies to assist accelerate your career.
Thus, our data analytics course in Coimbatore serves students from different fields, including engineering, business, arts, or science. We adapt the learning process to fit seasoned professionals wishing to switch careers or newly graduated people entering the industry.
Classes for working professionals starting in the evenings and running into the weekends have been developed. Moreover, students have contemporary labs where they may work on practical projects and get comments, therefore ensuring their assistance all through the process. Students seeking to hone their abilities even more can participate in the power bi course on Coimbatore, which develops their analytical and communication skills.
Learning Environment Student-Friendly Coimbatore
Coimbatore offers everything you can possibly need as a student. This city offers affordable housing, safe means of transportation, contemporary libraries, cafes, and coworking spaces, thereby rendering it a complete learning environment. Apart from all this, the city has frequent tech conferences and hackathons as well as guest lectures from business leaders, therefore enabling students to remain current with sector knowledge.
By planning seminars, workshops, and job fairs, training facilities like Xploreitcorp help to strengthen communities. Students gain most, in our opinion, when they may openly share ideas and work together, therefore promoting creativity. This ecosystem improves the value of the Coimbatore data analytics course you choose to study.
Getting Certified: Share With The World Your Capability
Certification is a necessary component of any kind of professional development. After completing their data analytics course in Coimbatore, Xploreitcorp graduates earn industry recognized credentials confirming their knowledge and expertise. These certificates really improve a LinkedIn profile and CV.
After finishing the power bi course on Coimbatore, you also obtain certification related to your skills in dashboard and report generation as well as visual storytelling. These qualifications show the market that you not only grasp ideas but also can use them deliberately.
Nonetheless, as a professional, accreditation helps boost confidence and reputation given more placement chances. It shows in an industry changing dedication, discipline, and skill.
Finally, start your path in data analytics right now.
These days, data is produced in leaps and bounds; there is no shortage of qualified individuals who could use it meaningfully. By enrolling in the Coimbatore data analytics course, you are insuring yourself a career not just guaranteed but also quick-paced and exciting. Along with the power training in Coimbatore, you are a great asset prepared to address actual corporate issues.
Here at Xploreitcorp, we provide a life-changing experience as much as instruction. Your career aspirations are well within reach with courses directed by knowledgeable teachers, hands-on projects, placement support, and a strong community around students.
This is your sign to start whether you are a new graduate, a college student figuring out the world has to offer, or even a working professional wishing to switch sectors. Enroll now and start your path to professionally mastering data, rising to be a respected analytics practitioner.
FAQs:
1. Who all can register for the Data Analytics Course?
Students from all fields of study are eligible—from engineering, commerce, arts, and even working professionals. No experience in coding is required.
2. Is there training with Excel, SQL, Python, and Power BI for data analytics?
Certainly! Our data analytics course in Coimbatore offers complete hands-on training with Excel, SQL, Python, and Power BI so you can learn data visualization.
3. Is the Power BI course on Coimbatore offered separately?
Yes. You may take the Power BI course on Coimbatore at Xplore it Corp as a stand-alone module or as part of a comprehensive data analytics package.
4. Will I receive a certificate after the course?
Without a doubt. After completing the course, you will be awarded a certificate for completing the data analytics course in Coimbatore, which is recognized in the industry.
5. Do they offer placement assistance?
Of course. After the training, Xploreitcorp assists with placement, providing mock interviews, resume drafting, and job referrals.
0 notes