#DataPresentations
Explore tagged Tumblr posts
Visit Tumblr Blog
Explore Tumblr blogs with no restrictions, modern design and the best experience.
Last Seen Tumblr Blogs


Fun Fact
Average visit duration of Tumblr.com is 10 mins and 25 secs.
Text
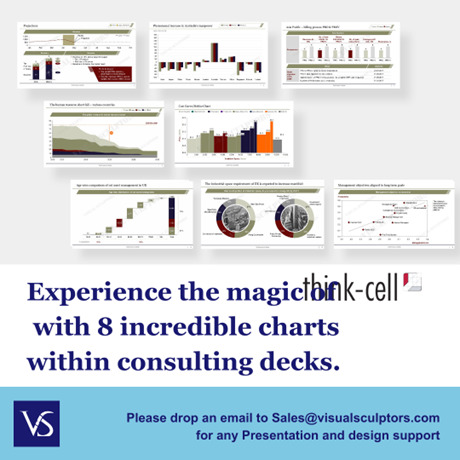
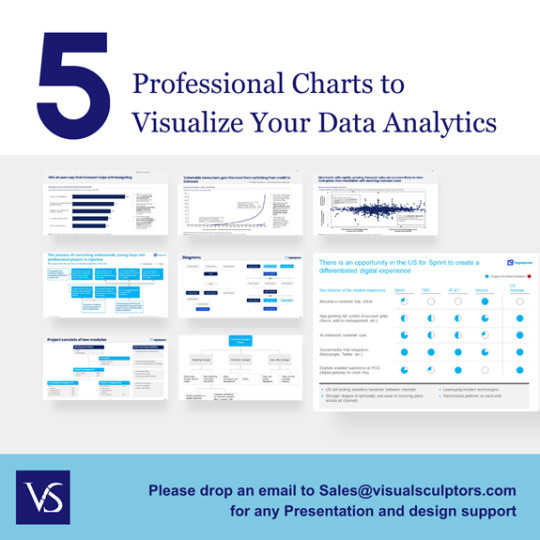
Data Visualization
The process of representing data using popular images, like charts, plots, infographics, and even animations, is known as data visualization. These informational visual displays make difficult data linkages and data-driven insights understandable. YrEdge Consulting can provide you with optimum data visualization solutions, contact us today.

#DataVisualization#VisualizeData#DataViz#DataInsights#VisualData#Analytics#DataDriven#Infographics#ChartsAndGraphs#DataStorytelling#DataArt#DataAnalysis#DataPresentation#InformationDesign#GraphicalData#DataIllustration
0 notes
Text
Maintain Stability of Inflation Figures in Gorontalo, TPID Urged to Maintain Consistent Perception
#MaintainInflationStability #ConsistentPerception
Hargo.co.id, GORONTALO –The Gorontalo Provincial Government has urged the Regional Inflation Control Team (TPID) to maintain a consistent perception in preserving the stability of inflation figures. This was conveyed by the Secretary of the Gorontalo Provincial Government, Sofian Ibrahim, at the Bank Indonesia Building on Tuesday (30/1/2024). “We hope that the content to be discussed later can…

View On WordPress
0 notes
Text
Why are Venn Diagrams Important for Effective Presentations?

Venn diagrams are a powerful tool for visualizing the relationships between different sets of data or concepts. They are often used in presentations and other forms of communication to help illustrate complex ideas in a clear and concise way.
Here are a few reasons why Venn diagrams are important for effective presentations:
They can help simplify complex information: By visually representing the overlapping relationships between sets of data or concepts, Venn diagrams can make it easier for viewers to understand complex information that might otherwise be difficult to grasp.
They can help communicate key points: Venn diagrams can be used to highlight important similarities and differences between different groups of data or concepts. This can be particularly useful in presentations where you need to emphasize key points or make persuasive arguments.
They can improve audience engagement: Venn diagrams are often more engaging and memorable than text-heavy presentations or lectures. They can be a powerful way to keep your audience interested and invested in your message.
They can make it easier to remember information: By presenting information in a visual and structured way, Venn diagrams can help viewers remember key points more effectively. This can be especially important in educational or training settings, where the goal is to help people learn and retain new information.
Overall, Venn diagrams are an effective and versatile tool for communicating complex information and ideas in a clear and engaging way. They can help you create more effective presentations, engage your audience, and communicate your message more effectively.
https://slidesdive.com
#PowerPointDesign#PresentationDesign#SlideDesign#VisualCommunication#DataVisualization#InfographicDesign#BusinessPresentations#ProfessionalDesign#CreativeSlides#VisualDesign#InformationGraphics#DataPresentations#DiagramDesign#ChartDesign#GraphDesign#IllustrationDesign#IconDesign#TableDesign#PresentationTemplates#and PresentationTips.
1 note
·
View note
Photo

Data analysis for a medical research http://ehelpdesk.tk/wp-content/uploads/2020/02/logo-header.png [ad_1] Data analysis, presentation, and... #androiddevelopment #angular #c #costamedic #css #dataanalysis #datacleaning #datapresentation #datascience #deeplearning #development #docker #iosdevelopment #java #javascript #machinelearning #medicalresearch #node.js #pvalue #princeraphaeldcosta #python #react #spssregression #unity #webdevelopment
0 notes
Text
Comparing Data Effectively: When to Choose Clustered Column Charts Over Simple Bar Charts
Data Visualization: Top Inquiries Answered
1.What are the advantages of clustered column chart?
Clustered column charts effectively compare multiple categories across different groups. They allow for easy visualization of data trends, highlight variations between categories, and facilitate side-by-side comparisons. Their clear representation helps in quickly identifying patterns and differences, making them useful for presentations and reports where clarity and comparison are essential.
2. What are the disadvantages of clustered bar charts?
Disadvantages of clustered bar charts include difficulty in comparing values across categories due to overlapping bars, potential clutter if too many categories are included, and challenges in interpreting data when bars are closely spaced. They can also become less effective with large datasets, leading to visual confusion and making it hard to discern trends or differences.
3. What is the difference between clustered bar chart and simple bar chart?
A simple bar chart displays individual categories with bars representing their values. A clustered bar chart, on the other hand, groups bars by category and allows for comparison of multiple datasets within the same category. Each group shows different data sets side by side, making it easier to compare values across categories.
4. When to use a clustered column chart?
Use a clustered column chart when you want to compare multiple categories across different groups. It's ideal for displaying discrete data, highlighting differences and trends among categories, and allowing easy comparison of values side by side. This type of chart is effective for visualizing data over time or across different categories and subcategories.
5. How do I add a line to a clustered column chart?
To add a line to a clustered column chart, first create your column chart. Then, select the data series you want as a line. Right-click and choose "Change Series Chart Type." Select "Line" for that series and ensure it's on the same axis if needed. Adjust formatting as desired for clarity and visibility.

Visit: VS Website See: VS Portfolio
#DataVisualization#ClusteredColumnChart#BarChart#ChartAnalysis#DataPresentation#VisualData#ChartComparison#DataInsights#ExcelCharts
0 notes
Text
The Importance of Legends in Line Graphs: Enhancing Clarity in Data Representation
Data Visualization: Key Questions Explained
1.Which chart is best for analysis?
The best chart for analysis depends on the data and the insights you want to convey. Bar charts are effective for comparing categories, line charts are great for trends over time, pie charts can show proportions, and scatter plots are useful for relationship analysis. Choose the chart type that best represents your data and highlights key points.
2. What is the limitation of line charts?
A limitation of line charts is that they can be misleading when displaying data with significant fluctuations or irregular intervals. They may oversimplify complex data trends, leading to misinterpretation. Additionally, line charts are not effective for comparing multiple datasets at once if they overlap, making it difficult to discern individual trends clearly.
3. What is the application of line graph?
Line graphs are used to display data points over time, showing trends and changes. They effectively illustrate relationships between variables, making it easier to compare information and identify patterns. Common applications include tracking sales performance, monitoring temperature changes, and visualizing stock market trends. Overall, line graphs aid in understanding data dynamics and making informed decisions.
4. What are the characteristics of a line graph?
A line graph displays data points connected by straight lines, showing trends over time or continuous data. Key characteristics include an x-axis (horizontal) and y-axis (vertical), which represent different variables, the use of scales to quantify data, and the ability to easily visualize changes, patterns, and relationships within the data. It often includes markers for data points.
5. What is a legend in a line chart?
A legend in a line chart is a key that explains what each line represents. It typically includes labels or colors corresponding to different data series, helping viewers understand the chart's information briefly. The legend is essential for interpreting the data accurately, especially when multiple lines are displayed.
Visit: VS Website See: VS Portfolio
#DataVisualization#LineChart#ChartAnalysis#GraphCharacteristics#StatisticalAnalysis#LegendInCharts#DataPresentation#InformationDesign
0 notes
Text
Understanding the Differences Between Pie Charts and Doughnut Charts for Data Visualization
Data Visualization: Frequently Asked Questions Explained
1. What is the main difference between pie chart and doughnut chart?
The main difference between a pie chart and a doughnut chart is that a pie chart displays data as a circular graph with slices representing parts of a whole, while a doughnut chart has a central hole, allowing for additional labeling or data presentation in the center. Both are used for comparing proportions, but the doughnut chart offers more flexibility.
2. How to show percentage in doughnut chart?
To show percentage in a doughnut chart, label each segment with the corresponding percentage value. You can use charting tools or libraries (like Chart.js or Google Charts) that allow for data labels. Additionally, consider adding a legend or tooltip for clarity. Ensure the total of all segments equals 100% to accurately represent the distribution.
3. How do I add text in a doughnut chart?
To add text in a doughnut chart, you can use charting software like Excel or Google Sheets. After creating the chart, click on the chart area to select it, then choose "Add Data Labels" or "Format Data Labels." You can customize the text, position, and appearance in the options available. Alternatively, use charting libraries like Chart for more customization through coding.
4. How to reduce the thickness of a doughnut chart?
To reduce the thickness of a doughnut chart, adjust the "hole size" or "inner radius" settings in your charting software. Increasing the inner radius will make the doughnut thinner. Additionally, you can modify the chart’s overall size, but ensure it maintains readability. Check the software's documentation for specific options related to doughnut chart customization.
5. How to create a donut chart in PPT?
To create a donut chart in PowerPoint, go to the "Insert" tab, select "Chart," and choose "Doughnut." Enter your data in the Excel sheet that appears, then customize the chart's design and colors as needed. Close the Excel sheet, and your donut chart will be displayed on your slide. Adjust size and position as desired.

Visit: VS Website See: VS Portfolio
0 notes
Text
Practical Applications of Mekko Charts in Business Analysis and Reporting
Data Visualization: Key Queries Explained
1.What is a Mekko chart good for?
A Mekko chart, also known as a Marimekko chart, is useful for visualizing categorical data across two dimensions. It effectively displays market share, revenue distribution, or performance metrics, allowing for easy comparison of different categories and their sizes. The variable-width columns and variable-height bars help identify trends and relationships within complex datasets immediately.
2. How to create a mekko chart?
To create a mekko chart, gather your data and categorize it into two dimensions (e.g., market size and market share). Use spreadsheet software like Excel to create a stacked bar chart, adjusting the widths of the bars to represent one dimension and the height to represent the other. Label axes and add data labels for clarity.
3. How do I edit a Mekko chart?
To edit a Mekko chart, use chart editing software like Excel or specialized tools. Click on the chart to select it, then modify data in the source table, adjust chart elements (like titles and labels), or change formatting options. You can also add or remove series and categories as needed to reflect the desired information accurately.
4. How do you add a title to a chart in Mekko?
To add a title to a chart in Mekko, select the chart, then look for the title option in the chart settings or properties panel. Enter your desired title in the provided text box and adjust font size or style as needed. Save your chances to apply the title to the chart.
5. What is Mekko chart and what is the difference between bar and Mekko chart?
A Mekko chart, or Marimekko chart, visually represents categorical data with varying widths and heights, showing both category size and value. Unlike bar charts that have uniform widths, Mekko charts combine bar height and width to convey two dimensions of data simultaneously, making them more effective for comparing market share or product performance across multiple categories.

Visit: VS Website See: VS Portfolio
0 notes
Text
How to Create Effective Scatter Charts in PowerPoint
Standee Design: Frequently Asked Questions Explained
1.How to do a scatter chart in PowerPoint?
To create a scatter chart in PowerPoint, first open your presentation and go to the slide where you want the chart. Click on the "Insert" tab, then select "Chart." In the Chart dialog box, choose "Scatter" from the list of chart types. Click "OK," and a chart will appear along with an Excel window for data input. Enter your data in the Excel sheet, then close it. You can customize the chart's design and layout using the Chart Tools that appear in the ribbon. Finally, adjust the size and position as needed on your slide.
2. How to draw a xy axis in PPT?
To draw an XY axis in PowerPoint, follow these steps:
1. Open your PowerPoint slide.
2. Go to the "Insert" tab and select "Shapes."
3. Choose the "Line" shape to draw the X-axis (horizontal) and Y-axis (vertical).
4. Click and drag to create each line, holding the Shift key for straight lines.
5. Use text boxes to label the axes by selecting "Insert" > "Text Box."
6. Optionally, add gridlines or markers using more lines or shapes.
7. Format lines and text as needed for clarity.
Now you have a basic XY axis!
3. How do you Scatter words in PowerPoint?
To scatter words in PowerPoint, use the following steps:
1. Insert a text box and type your words.
2. Select the text box, then go to the "Format" tab.
3. Use the "Text Effects" option to apply a "Transform" effect, such as "Arch Up" or "Wave."
4. Adjust the size and position of the text box to create a scattered effect.
5. For more randomness, duplicate the text box and alter the font size, color, or rotation for each copy.
Experiment with different effects until you achieve the desired scattered appearance.
4. How do I add labels to a scatter plot in PowerPoint?
To add labels to a scatter plot in PowerPoint, first select the chart. Then, click on the "Chart Elements" button (the plus sign) next to the chart. Check "Data Labels" to add labels to each point. You can customize the labels by right-clicking on them and selecting "Format Data Labels." From there, you can choose what information to display, such as values or names, and adjust their position and appearance. For further customization, you may also explore the "Chart Tools" on the ribbon for additional formatting options.
5. How to make a scatter graph in PPT?
To create a scatter graph in PowerPoint, follow these steps:
1. Open PowerPoint and go to the slide where you want to insert the graph.
2. Click on the "Insert" tab and select "Chart."
3. In the Chart dialog, choose "Scatter" from the list of chart types.
4. Click "OK" to insert the chart.
5. The Excel spreadsheet will open; input your data in the provided cells.
6. Once your data is entered, close Excel, and the scatter graph will update in PowerPoint.
7. Customize the chart as needed using the Chart Tools available.
Visit: VS Website See: VS Portfolio
0 notes