#Graph Analytics
Explore tagged Tumblr posts
Visit Tumblr Blog
Explore Tumblr blogs with no restrictions, modern design and the best experience.
Last Seen Tumblr Blogs


Fun Fact
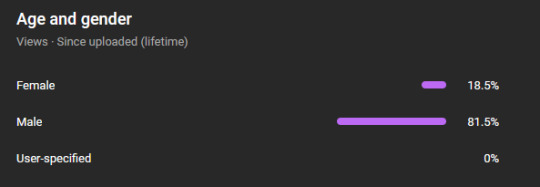
Women make up for the other 50% of Tumblr’s audience.
Note

watching someone new and got a surprise pat gill. had something to do with wrestling as per usual
likely place for him to be.... getting jumpscared by pat is always like seeing bigfoot while youre out on a hike
#think he did voiceover for a recent jon bois video and it startled me even though i know they used to be roommates???#answered#or at least i think they were it was def one of the sb nation guys but i know nothing abt sports#i just like overly long analytical videos and that guy looooves a graph
15 notes
·
View notes
Text
????why is the mepad video such a big hit with dudes????
#and why are None of my viewers nonbinary#also Yes i stalk my youtube analytics i love graphs and getting to peek into how youtube works under the curtain#knightext
11 notes
·
View notes
Text
picking good quiz problems is so much harder than it seems
#i need the critical points and inflection points to at least be easy to find analytically#as well as small enough that i can ask them to graph the function#i ended up going with a modified version of a problem in their textbook#whatever#finally can go to sleep now that i've checked off my requisite tasks on my bullet journal#poast.txt
4 notes
·
View notes
Text
Man wtf fuck biology when has science ever helped anyone ever. I’ll just major in communications and make a billion schmeckles that way
#college is hard#wtf does this fuckass math class have to do with biology#I���m no expert but I don’t think doctors gaf about the second derivative#bacteria certainly don’t#calculus with analytic geometry#you see that?#why is that a required class?#that’s specialized math specifically for geometry math shit#this has no bearing on the human body whatsoever#also since this class is like $500 and attending class is mandatory why don’t we.#yknow#DO SOMETHING IN CLASS#all notes are done at home#and during the 2 hour MANDATORY class period the teacher just kinda fucks around#her biggest concern is what colors I’m using to draw my graph#I would love math lecture during those two hours#can I please get a math lecture during those two hours#I can’t attend tutoring every fucking module#IM BUSY#I HAVE OTHER CLASSES#I HAVE OTHER RESPONSIBILITES#YOU CANT JERK OFF FOR TWO HOURS OF MY TIME AND THEN ACT LIKE ITS MY FAULT IM FAILING#it’s not even the biology class that’s fine it’s just this fucking math class
2 notes
·
View notes
Text
Best Graph Making Tools

Follow @everythingaboutbiotech for informative and useful stuff ✨
#DataViz#DataVisualization#Graphs#Charts#DataGraphs#GraphDesign#Infographics#DataAnalytics#ChartTypes#BarChart#PieChart#LineGraph#GraphSoftware#ExcelCharts#TableauViz#DataStorytelling#FlowChart#OrgChart#Data#Analytics#Numbers#Statistics#DataScience#BigData#Dashboard
9 notes
·
View notes
Note
doing a compsci analytics based course this sem as an elective (like a fucking idiot. im a humanities major WHAT WAS I THINKINGG) and i feel like my brain is pulsating 😭 im in shambles but i know i can do it. i just need to like become one with the code or smth
with all the love in the world you could not pay me to take an analytics elective course 😭 data analytics is my area of study and the field i want to go into but its so crazy tedious i would never do it if i didnt have to LMAOOO
#return to sender#im bad at coding but i reccomend breaking down your code on paper first before you start#if you start from scratch completely youll get more overwhelmed#GOOD LUCK#i love data analytics . love graphs#wht r they teaching u w … i assume like sql or r
3 notes
·
View notes
Text
.
#i have to hold a presentation tomorrow about a paper on genetic networks and im so scared#i barely understand all the graphs and thats the main thing the prof wants us to present uuuggghhhhh#i hope i can semi bullshit my way through this#after i have to think abt the presentation i have to hold on friday but thats gonna be way more chill#its just 3 mins on a specific transgenic corn variant i could probably speak that long abt the topic with like an hour preparation#sigh systematic biology my enemy eternal im just not smart enough for so much data i think#(i use my enemy eternal way too loosely its of course still analytical chemistry we all know this)
0 notes
Text
Discover how Advanata can increase your profits, control inventory, and reach sales targets.
#dashboard#data#data analytics#data effectiveness#data processing#graphs#infographics#kpi#plots#reports#statistics
0 notes
Text
Data Unbound: Embracing NoSQL & NewSQL for the Real-Time Era.
Sanjay Kumar Mohindroo Sanjay Kumar Mohindroo. skm.stayingalive.in Explore how NoSQL and NewSQL databases revolutionize data management by handling unstructured data, supporting distributed architectures, and enabling real-time analytics. In today’s digital-first landscape, businesses and institutions are under mounting pressure to process massive volumes of data with greater speed,…
#ACID compliance#CIO decision-making#cloud data platforms#cloud-native data systems#column-family databases#data strategy#data-driven applications#database modernization#digital transformation#distributed database architecture#document stores#enterprise database platforms#graph databases#horizontal scaling#hybrid data stack#in-memory processing#IT modernization#key-value databases#News#NewSQL databases#next-gen data architecture#NoSQL databases#performance-driven applications#real-time data analytics#real-time data infrastructure#Sanjay Kumar Mohindroo#scalable database solutions#scalable systems for growth#schema-less databases#Tech Leadership
0 notes
Text
Graphy.app Data Visualization Made Easy (and Fast!)
Stop struggling with data! Graphy.app makes creating beautiful, impactful graphs a breeze. See how easy it is!" #datavisualization #graphs #dataanalysis #graphyapp #productivity #businesstools #analytics
Don't forget to like, comment, and subscribe for more AI content!
#impactful graphs a breeze. See how easy it is!"#datavisualization#graphs#dataanalysis#graphyapp#productivity#businesstools#analytics#Don't forget to like#comment#and subscribe for more AI content!#“data visualization”#“graph maker”#“create graphs”#“data analysis tools”#“chart maker”#“easy data visualization”#“online graph maker”#“ai graph generator”#“data visualization software”#“business graph maker”#“data reporting tools”#“interactive graph maker”#“data dashboard tools”#“graph creation online”#“data presentation tools”#“google sheets graph integration”#“notion graph integration”#“business intelligence tools”#“analytics software”
0 notes
Text
Virgo/Guiyuan (Serev'ka)'s Tags
⇢✶i must get an a++ on this《virgo’s questionnaire results》
[Questionnaire Results]
⇢✶about the analytical virgo《virgo’s headcanons》
[Headcanons]
⇢✶diary into the analytical mind《Virgo’s musings》
[Musings]
⇢✶interview with the undead virgo 《virgo’s answers》
[Ask Replies]
⇢✶a curtsy from a maiden《virgo’s rp replies》
[RP Replies]
⇢✶sounds of one resuscitated heartbeat 《virgo’s soundtrack》
[Soundtrack]
⇢✶scrolls graphs and books《Virgo’s aesthetics》
[Aesthetics]
⇢✶there is beauty in one’s mind 《Virgo (guiyuan)》
⇢✶the archivist of the zodiac 《Virgo’s main verse》
[Main Verse]
#⇢✶i must get an a++ on this《virgo’s questionnaire results》#⇢✶about the analytical virgo《virgo’s headcanons》#⇢✶diary into the analytical mind《Virgo’s musings》#⇢✶interview with the undead virgo 《virgo’s answers》#⇢✶a curtsy from a maiden《virgo’s rp replies》#⇢✶sounds of one resuscitated heartbeat 《virgo’s soundtrack》#⇢✶scrolls graphs and books《Virgo’s aesthetics》#⇢✶there is beauty in one’s mind 《Virgo (guiyuan)》#⇢✶the archivist of the zodiac 《Virgo’s main verse》
0 notes
Text
Unlock Real-Time Insights with Google's 24-Hour Data!
Check out my post about Googles new 24 hours view data analytics that allows users to view site performance metrics and traffic levels in close to real-time!
Introduction Google had a busy holiday season, actively publishing content on its official blog, Google Search Central, a month they called, “Crawling December”. This name is a reference to the nature of their content’s subject matter throughout December; content for the most part- largely centered around how the search engine crawls and indexes websites. The post that inspired me to write…
0 notes
Text


#Best Clinical SAS Training Institute in Hyderabad#Unicode Healthcare Services stands out as the top Clinical SAS training institute in Ameerpet#Hyderabad. Our comprehensive program is tailored to provide a deep understanding of Clinical SAS and its various features. The curriculum i#analytics#reporting#and graphical presentations#catering to both beginners and advanced learners.#Why Choose Unicode Healthcare Services for Clinical SAS Training?#Our team of expert instructors#with over 7 years of experience in the Pharmaceutical and Healthcare industries#ensures that students gain practical knowledge along with theoretical concepts. Using real-world examples and hands-on projects#we prepare our learners to effectively use Clinical SAS in various professional scenarios.#About Clinical SAS Training#Clinical SAS is a powerful statistical analysis system widely used in the Pharmaceutical and Healthcare industries to analyze and manage cl#and reporting.#The program includes both classroom lectures and live project work#ensuring students gain practical exposure. By completing the training#participants will be proficient in data handling#creating reports#and graphical presentations.#Course Curriculum Highlights#Our Clinical SAS course begins with the fundamentals of SAS programming#including:#Data types#variables#and expressions#Data manipulation using SAS procedures#Techniques for creating graphs and reports#Automation using SAS macros#The course also delves into advanced topics like CDISC standards
1 note
·
View note
Text

Since 2024 is soon coming to a close, decided to celebrate by doing some analytics of my social media career.
#art#artwork#digital art#cartoon#doodle#drawing#Mortimor#social media#twitter#tumblr#bluesky#newgrounds#reddit#analytics#graph#artist#artists on tumblr#small artist
1 note
·
View note
Text
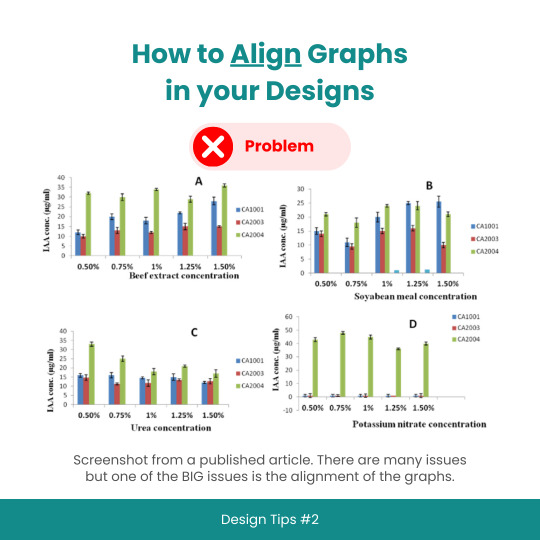
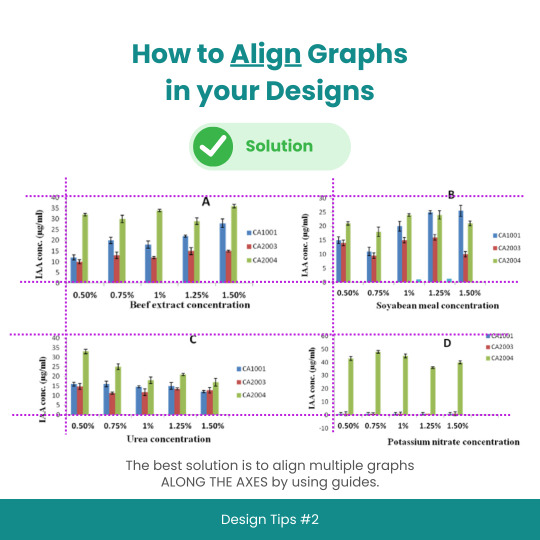
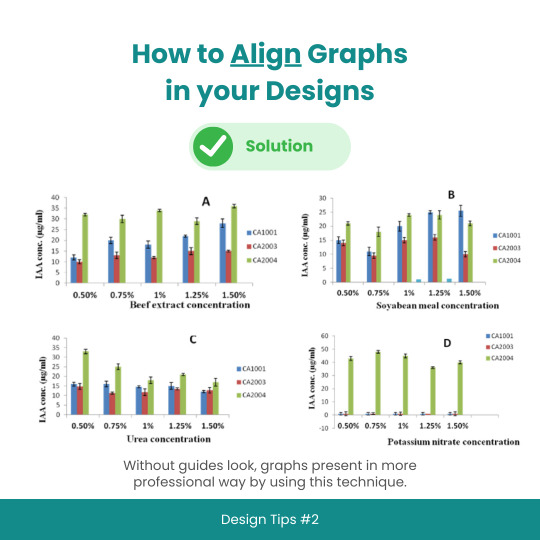
Design Tips #2: How to Align Graphs in your Designs
#designtips#datavisualization#graph#data#statistics#analytics#dataisbeautiful#chart#dashboard#datagram#dataart#infographic#informationisbeautiful#datatellingstories#datadesign#ddj#datasketch#dataviz
3 notes
·
View notes