#LineGraphs
Explore tagged Tumblr posts
Visit Tumblr Blog
Explore Tumblr blogs with no restrictions, modern design and the best experience.
Last Seen Tumblr Blogs


Fun Fact
Women make up for the other 50% of Tumblr’s audience.
Text
The online graph maker tool allows users to easily create various types of graphs such as pie charts, bar charts, line graphs, and more. With an intuitive interface, you can input your data, select preferred colors, and generate a graph that can be downloaded as an image for presentations, reports, or analysis. This tool is designed to simplify the process of visualizing complex data, helping users to analyze trends, make better decisions, and improve presentations.
Explore the tool here: Graph Maker Tool.
0 notes
Text

2 notes
·
View notes
Text
Best Graph Making Tools

Follow @everythingaboutbiotech for informative and useful stuff ✨
#DataViz#DataVisualization#Graphs#Charts#DataGraphs#GraphDesign#Infographics#DataAnalytics#ChartTypes#BarChart#PieChart#LineGraph#GraphSoftware#ExcelCharts#TableauViz#DataStorytelling#FlowChart#OrgChart#Data#Analytics#Numbers#Statistics#DataScience#BigData#Dashboard
9 notes
·
View notes
Text
Engineer: *standing before a linegraph* Alright, today we’ll be talking about how we can Find Out and how much we can Find Out and what it takes to get there.
Engineer: So first we have to decide, “how much do we want to Find Out?” So, let’s say in this case I want to Find Out at a level of seven, so I find that level on my graph and I come horizontally to my gradient line and where it intersects with my gradient line. I go straight down to where it intersects with my Fuck Around line.
Engineer: *points* That there is going to tell me how much I have to Fuck Around to Find Out what I need to Find Out.
Engineer: So, as you can see the more you Fuck Around the more you’re going to Find Out, and also, if you stayed on here and you never Fucked Around you will never Find Out.
Engineer: So, I hope you found this lesson is helpful. Thank you.
42 notes
·
View notes
Note
patho ask: 22 & 26
22. How much of the story were you able to piece together on the first run?
Outside of many details that initially evaded me because I was busy starving and trying to - I don't know, kill Var, I think I "got" the whole story on my first playthrough, except I didn't realize that after the Bachelor, the Haruspex would have just as fleshed-out a world and so would the Changeling (their mechanics aside). I was totally on board with shelling the awful little town what hated me. I didn't understand Daniil's intense antagonism with Aglaya but I was in support of his extracurricular hobbies, so long as we both agreed with annihilation. And Eva's final conversation that made me extra hateful. So - I understood the story, but I have a completely different and less emotionally whipped perspective on it now.
26. If you played more than one route/series entry, how do you think the order shaped your experience & feelings?
My order went something like...
P1 Bach. -> Marble Nest -> P1 Haru. -> P2 Haru. -> (big break) -> Changeling.
I played them kind of mercilessly back to back to back to back so the Marble Nest was like a refresher. It propelled me through P1 Haruspex. Something about all the time in the steppe was almost too relaxing, and then Oyun would poison me, and I'd have to not bumblefuck around. The order I played the games in definitely made it so that I got the story in as measured a way as possible, but also, because of that order, and how fast I played, I was super overconfident for P2. I had like... hours under my belt at that point in the town and I really thought I had a leg up on P2. Maybe I did, I died 16 times and none of them to hunger or exhaustion, but by the time Rubin died I felt I was fucking up severely. My hubris crumbled and I sat on that for 24hrs before turning back time and getting #serious but then Rubin up and died anyway into day 7. Playing the games like this turned the series into a big "we're so back" "it's so over" linegraph that eventually stomped my ego into mud. I will have learned nothing by P3.
2 notes
·
View notes
Text
Technical/Drafting Pen Masterlist
This is more for myself than anything else but it's just a list of different brands and different kinds of pens they've made. I put a star next to the ones I’ve used before :] let me know if I missed any!
sorry my pen autism jumped out
Rotring (Germany):
- Rapidograph*
- Isograph*
- Micronorm*
- Variant*
- Varioscript
- Primus
- Rapidoliner
- Foliograph
- Tintenkuli
Staedtler (Germany):
-Mars 700*
-Marsmatic 700*
-Marsmatic 707/745/750/757 (there are a lot of number variants but I am unsure of what the differences between them are)
-Marsmatic 759 (Duraglide)
-Marsmagno
Koh-I-Noor (Czech Republic):
-Rapidograph *
-Acetograph
-Rapidometric
-Faber Castell TG (Germany)
-Reform Refograph (Germany)
-Centropen Centrograf 9070 (Czech Republic)
-Unitech Technical Pen (Germany)
-Keuffal & Esser (K&E) Leroy (United States)
-Herlitz Technoliner (Germany)
-Standardgraph Stano Pen (Germany)
-Skala Skalory Pens (Poland)
-Rystor Rapidograf (Poland)
-Kern Prontograph (Switzerland)
-Mecanorma Graphoplex MG1 (France)
-Markant Lin’s 9 Plus Pen (Germany)
-Erograph (Germany)
-Aristo Technical Pen (UK)
-Trident Desegraph (Brazil)
-Kokuyo Rota Graph (Made in Germany but sold in Japan)
-Cleo Skribent Technical Pen (Germany)
-Uchida Kent River Pen (Japan)
-Berol Turquoise (United States)
-Isomars (India)
-HERO (China)
Pens/Brands I have seen on Ebay but have barely seen anything about online anywhere else:
-Dator Duo-Graph
-Linegraph
-Copygraph (also called КОПИГРАФ but I couldn’t find anything when I looked it up) (USSR/Russia)
#axel.txt#pens#technical pen#rapidograph#isograph#drafting pen#sorry my pen autism came out#marsmatic#koh i noor#rotring#staedtler
18 notes
·
View notes
Link
Data Interpretation - Problems On Line Graph | Part-2 | Arithmetic | Vinay | Tone Academy This video deals with • Data Interpretation • Single Data Interpretation • Mixed Data Interpretation • Problems on Line Graphs #Datainterpretation #bargraphs #PieCharts #tablegraphs #linegraphs For any queries/doubts/information - we are just an email away - mail us @ [email protected] Subscribe to : https://bit.ly/2YQOgbs https://www.youtube.com/playlist?list...
0 notes
Photo

What the hell! My guide dog can’t be expected to read that!!! #eyesiteissues #linegraphs #notwhatiwastaught #lantitenumeracy #lantitestudy #mathsiskillingmysoul #veryslowly (at Burpengary East) https://www.instagram.com/p/CGv9qbsBA3E/?igshid=1oevz28xuqjvs
#eyesiteissues#linegraphs#notwhatiwastaught#lantitenumeracy#lantitestudy#mathsiskillingmysoul#veryslowly
0 notes
Photo

Data Visualization with Tableau.Tableau is one of the fastest evolving Business Intelligence (BI) and data visualization tools. Data Visualization with Tableau helps your insights come gripping alive and communicates complex ideas simply. #tableau,#datavisualization,#business,#intelligence,#dataanlysis,#databases,#charts,#piecharts,#matplotlib,#graphs,#boxplot ,#linegraphs,#waterfall,#powerbi,#azure,#worksheets Check our Info : www.incegna.com Reg Link for Programs : http://www.incegna.com/contact-us Follow us on Facebook : www.facebook.com/INCEGNA/? Follow us on Instagram : https://www.instagram.com/_incegna/ For Queries : [email protected] https://www.instagram.com/p/B5wxkK9gw7B/?igshid=9nt6moermymv
#tableau#datavisualization#business#intelligence#dataanlysis#databases#charts#piecharts#matplotlib#graphs#boxplot#linegraphs#waterfall#powerbi#azure#worksheets
0 notes
Photo

Had a lot of fun illustrating this series of fantastic historical statisticians for @geckoboard #StarsofStats campaign recently. #williamplayfair #playfair #statistician #piechart #graphs #linegraphs #dataviz #stats #graphs #bargraph #charts #spies https://www.instagram.com/p/BtUuQ4yFPWC/?utm_source=ig_tumblr_share&igshid=8bw1w3krmien
#starsofstats#williamplayfair#playfair#statistician#piechart#graphs#linegraphs#dataviz#stats#bargraph#charts#spies
0 notes
Text

To form a system of linear equations, we should group two or more linear equations altogether. Now let us see systems of two linear equations in two unknowns. After doing so, we may solve equations containing larger systems
0 notes
Text
Yeah, fair.
#spotify wrapped#the linegraph of my depression this year#the amazing devil#tad#spent over 10k minutes with then this year#and they were some of my favorite 10k minutes
1 note
·
View note
Text

2 notes
·
View notes
Link
Tìm hiều bố cục viết writing task 1 line graph trong bài thi IELTS trong bài viết này nhé!!!
1 note
·
View note
Photo
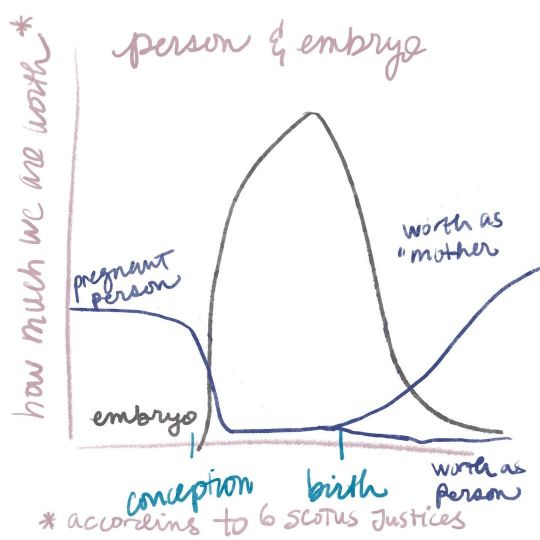
Person v embryo. ID: Line graph with vertical axis saying how much we are worth* underneath the* according to six SCOTUS justices. Horizontal axis is conception, birth. Line graph when line moves right labeled pregnant person dips down to almost nothing at conception stays near nothing at birth and then splits goes up a little bit and is labeled worth as a “mother,” lower split line says worth as a person. Second line starts at conception labeled embryo, goes up real high real fast at conception, peaks at birth, then drops precipitously after birth. #IllustrationArt #LineGraph #ArtChart #ReproductiveJustice #BodilyAutonomy https://www.instagram.com/p/CgN7OqKr3mX/?igshid=NGJjMDIxMWI=
0 notes
Link
• Data Interpretation • Single Data Interpretation • Mixed Data Interpretation • Problems on Line Graphs #Datainterpretation #bargraphs #PieCharts #tablegraphs #linegraphs For any queries/doubts/information - we are just an email away - mail us @ [email protected] Subscribe to : https://bit.ly/2YQOgbs https://www.youtube.com/playlist?list...
0 notes