#Linear regression in machine learning
Explore tagged Tumblr posts
Visit Tumblr Blog
Explore Tumblr blogs with no restrictions, modern design and the best experience.
Last Seen Tumblr Blogs


Fun Fact
130K people were victims of a chain letter scam that affected Tumblr in May 2011.
Text
Regression metrics in machine learning

Regression metrics help us evaluate the performance of regression models in machine learning. For beginners, understanding these parameters is important for model selection and optimization. In this article, we will focus on the important regression metrics: MAE, MSE, RMSE, R² score, and adjusted R² score.
Each section is written in list format for better clarity and understanding.
1. Mean Absolute Error (MAE)
MAE calculates the average of absolute differences between predicted and actual values.
formula:
Important points:
1. Easy to understand: MAE is easy to understand and calculate.
2. Same unit as the target variable: The errors are in the same unit as the target variable.
3. Not sensitive to outliers: Large errors do not affect MAE as much as they do MSE.
Use cases:
When you need a simple and descriptive metric for error measurement.
Python code:
import mean_absolute_error from sklearn.metrics
# Actual and projected values
y_true = [50, 60, 70, 80, 90]
y_pred = [48, 62, 69, 78, 91]
# Calculate the MAE
mae = mean_absolute_error (y_true, y_pred)
print("Mean Absolute Error (MAE):", mae)
2. Mean Squared Error (MSE)
MSE calculates the average of the squared differences between predicted and actual values.
formula:
Important points:
1. Punishes big mistakes: Square mistakes increase their impact.
2. Optimization in general: widely used for model training.
3. Units are squared: Errors are in squared units of the target variable, which can be difficult to interpret.
Use cases:
Useful when you want to punish big mistakes.
Python code:
import mean_squared_error from sklearn.metrics
# Calculate the MSE
mse = mean_squared_error(y_true, y_pred)
print("Mean Squared Error (MSE): "mse)
3. Root Mean Squared Error (RMSE)
Description:
RMSE is the square root of MSE and provides a more descriptive error metric.
Important points
1. Same unit target variable: Easier to interpret than MSE.
2. Sensitive to outliers: Like MSE, RMSE penalizes large errors.
Use cases:
When you need an interpretable error measure that considers large deviations.
Python code:
import np as numpy
# Calculate the RMSE
rmse = np.sqrt(mse)
print("Root Mean Squared Error (RMSE):", rmse)
4. R-squared (R²) score
R² measures how much variance in the target variable is explained by the model.
formula:
Important points:
1. Range: R² ranges from 0 to 1, with 1 being a perfect fit.
2. Negative values: A negative R² indicates the model is worse at predicting the mean.
3. Explains variance: Higher values mean the model explains more variance.
Use cases:
Estimate the overall goodness of fit of the regression model.
Python code:
import r2_score from sklearn.metrics;
# Calculate the R² score
r2 = r2_score(y_true, y_pred)
print("R-Squared (R²) score:", r2);
5. Adjusted R-Square
Description:
Adjusted R² Adjusts the R² value by the number of predictors in the model.
formula:
: number of observations
: number of predictors
Important points:
1. Better for multiple predictors: Penalizes models with irrelevant features.
2. Can decrease: Unlike R², adjusted R² can decrease when adding unrelated predictors.
Use cases:
Comparing models with different statistics.
Python code:
# function to calculate the adjusted R²
def adjusted_r2(r2, n, p):
Returns 1 - ((1 - r2) * (n - 1) / (n - p - 1))
# Example calculations
n = lane(y_true)
p = 1 # Number of predictors
adj_r2 = adjusted_r2 (r2, n, p)
print("adjusted r-squared:", adj_r2);
Comparison of metrics
result
Understanding these regression metrics helps build, evaluate, and compare models effectively. Each metric serves a specific purpose:
1. Use MAE for simple and robust error measurement.
2. Opt for MSE or RMSE when it is important to penalize large errors.
3. Evaluate the performance of the model
e using R².
4. Prefer adjusted R² for models with multiple characteristicjs.
These metrics are fundamental to any data scientist or machine learning engineer aiming to build accurate and reliable regression models.
#artificial intelligence#bigdata#books#machine learning#machinelearning#programming#python#science#skills#big data#linear regression
1 note
·
View note
Text
Step-By-Step Guide: Implementing Linear Regression For Machine Learning

Are you ready to unravel the secrets of linear regression and unlock its potential in machine learning? Look no further! In this step-by-step guide, we will take you on an exhilarating journey through the world of linear regression. Whether you’re a beginner or an experienced data scientist, get ready to dive deep into the concepts, techniques, and practical implementation of one of the most fundamental algorithms in predictive analytics. So fasten your seatbelts and prepare to soar high as we unveil the power of linear regression for machine learning!
Introduction to Linear Regression
Linear regression is a powerful statistical technique that can be used to predict future values of a dependent variable, based on past values of an independent variable. In machine learning, linear regression can be used to build predictive models to find relationships between features and labels.
In this guide, we will go over the basics of linear regression and show how to implement it in Python. We will also cover some important considerations when working with linear regression models.
What is Linear Regression?
Linear regression is a statistical technique that can be used to predict future values of a dependent variable, based on past values of an independent variable. In machine learning, linear regression can be used to build predictive models to find relationships between features and labels.
Independent variables are typically denoted by X while the dependent variable is denoted by Y . For example, in our housing price dataset, the feature X could represent the size of the house (in square feet) while the label Y could represent the price of the house. We would then want to find a relationship between X and Y so that we can predict prices given only the size of the house. This relationship is typically represented by a line:
Y = mX + b
where m is the slope of the line and b is the intercept (the value of Y when X=0). The goal of linear regression is to estimate the values for m and b so that we can best fit this line to our
Preparing Data for Linear Regression
In machine learning, linear regression is a supervised learning algorithm used to predict a continuous target variable y from a set of predictor variables X. The goal is to find the best fit line that describes the relationship between the predictor variables and the target variable.
To prepare data for linear regression, you need to ensure that your data is free of missing values and outliers, and that it is properly scaled. You also need to split your data into training and test sets, so that you can assess the performance of your linear regression model on unseen data.
Once your data is ready, you can begin fitting a linear regression model using scikit-learn or another machine learning library. Be sure to tune your model hyperparameters to get the best possible performance on your test set.
Implementing Linear Regression in Machine Learning
Linear regression is a machine learning algorithm that can be used to predict continuous values. In this guide, we will go over how to implement linear regression in machine learning. We will cover the following topics:
– What is linear regression?
– The mathematical equation for linear regression
– How to implement linear regression in machine learning
– Tips for improving your linear regression model
What is linear regression?
Linear regression is a machine learning algorithm that is used to predict continuous values. Continuous values are numerical values that can take any value within a certain range. Examples of continuous values include height, weight, and temperature. Linear regression predicts the value of a target variable by using a line of best fit. The line of best fit is created by finding the line that minimizes the sum of squared errors.
The mathematical equation for linear regression
The mathematical equation for linear regression is y =mx+b, where y is the predicted value, m is the slope of the line, x is the input value, and b is the intercept. The slope and intercept are learned by the algorithm during training.
How to implement linear regression in machine learning
Linear regression can be implemented in many different programming languages. In this guide, we will show you how to implement linear regression in Python. First, we will need to import the libraries that we will be using:
from sklearn import datasets # To load our dataset
from sklearn import
Learning Algorithms and Models Used in Linear Regression
There are a few different types of learning algorithms and models that can be used for linear regression. The most common type of algorithm is the Ordinary Least Squares (OLS) estimator. This method finds the line of best fit by minimizing the sum of squared residuals. Another popular algorithm is the gradient descent algorithm. This approach starts with a randomly generated line and then iteratively improves it by moving it in the direction that minimizes the cost function. There are also many different ways to regularize linear regression models to prevent overfitting, such as adding L1 or L2 regularization terms to the cost function.
Evaluating Performance of Linear Regression Models
It is important to evaluate the performance of your linear regression models to ensure that they are accurately predicting outcomes. There are a few key metrics that you can use to evaluate your model’s performance, including:
-R Squared: This metric measures the percentage of variability in the dependent variable that is explained by the independent variable(s). A high R squared value indicates a strong relationship between the independent and dependent variables.
-Mean Absolute Error: This metric measures the average difference between predicted values and actual values. A low MAE value indicates that the model is accurately predicting outcomes.
-Root Mean Squared Error: This metric measures the average difference between predicted values and actual values, taking into account the magnitude of the error. A low RMSE value indicates that the model is accurately predicting outcomes.
Optimization Techniques Used for Linear Regression
There are a few different ways to optimize linear regression for machine learning. The first is to use feature selection techniques in order to choose the most predictive features for your model. This can be done using methods like forward selection, backward elimination, or recursive feature elimination. Another way to optimize linear regression is by using regularization methods like Lasso or Ridge regression. These methods help to prevent overfitting by penalizing certain coefficients in the model. You can also use cross-validation to tune your model and improve its performance.
Conclusion
Linear regression is an important algorithm that is used to solve a wide variety of machine learning problems. It offers great insight into the relationships between two or more variables and can be implemented in various ways depending on your dataset and problem requirements. We have provided you with a step-by-step guide to implement linear regression for machine learning, which we hope will help you get started quickly and achieve better results. With this knowledge under your belt, it’s time to start exploring different datasets and applying linear regression techniques to them!
0 notes
Text
0 notes
Text
Quick Guide to different machine learning techniques
Question 1: Do you need to be able to interpret the model?
"No, I just want accurate predictions" <- use a neural network
"Yes, I need to know exactly why it works" <- use generalized linear regression
"No, but I want to pretend to be able to interpret it" <- use a decision tree
43 notes
·
View notes
Text
Python Libraries to Learn Before Tackling Data Analysis
To tackle data analysis effectively in Python, it's crucial to become familiar with several libraries that streamline the process of data manipulation, exploration, and visualization. Here's a breakdown of the essential libraries:
1. NumPy
- Purpose: Numerical computing.
- Why Learn It: NumPy provides support for large multi-dimensional arrays and matrices, along with a collection of mathematical functions to operate on these arrays efficiently.
- Key Features:
- Fast array processing.
- Mathematical operations on arrays (e.g., sum, mean, standard deviation).
- Linear algebra operations.
2. Pandas
- Purpose: Data manipulation and analysis.
- Why Learn It: Pandas offers data structures like DataFrames, making it easier to handle and analyze structured data.
- Key Features:
- Reading/writing data from CSV, Excel, SQL databases, and more.
- Handling missing data.
- Powerful group-by operations.
- Data filtering and transformation.
3. Matplotlib
- Purpose: Data visualization.
- Why Learn It: Matplotlib is one of the most widely used plotting libraries in Python, allowing for a wide range of static, animated, and interactive plots.
- Key Features:
- Line plots, bar charts, histograms, scatter plots.
- Customizable charts (labels, colors, legends).
- Integration with Pandas for quick plotting.
4. Seaborn
- Purpose: Statistical data visualization.
- Why Learn It: Built on top of Matplotlib, Seaborn simplifies the creation of attractive and informative statistical graphics.
- Key Features:
- High-level interface for drawing attractive statistical graphics.
- Easier to use for complex visualizations like heatmaps, pair plots, etc.
- Visualizations based on categorical data.
5. SciPy
- Purpose: Scientific and technical computing.
- Why Learn It: SciPy builds on NumPy and provides additional functionality for complex mathematical operations and scientific computing.
- Key Features:
- Optimized algorithms for numerical integration, optimization, and more.
- Statistics, signal processing, and linear algebra modules.
6. Scikit-learn
- Purpose: Machine learning and statistical modeling.
- Why Learn It: Scikit-learn provides simple and efficient tools for data mining, analysis, and machine learning.
- Key Features:
- Classification, regression, and clustering algorithms.
- Dimensionality reduction, model selection, and preprocessing utilities.
7. Statsmodels
- Purpose: Statistical analysis.
- Why Learn It: Statsmodels allows users to explore data, estimate statistical models, and perform tests.
- Key Features:
- Linear regression, logistic regression, time series analysis.
- Statistical tests and models for descriptive statistics.
8. Plotly
- Purpose: Interactive data visualization.
- Why Learn It: Plotly allows for the creation of interactive and web-based visualizations, making it ideal for dashboards and presentations.
- Key Features:
- Interactive plots like scatter, line, bar, and 3D plots.
- Easy integration with web frameworks.
- Dashboards and web applications with Dash.
9. TensorFlow/PyTorch (Optional)
- Purpose: Machine learning and deep learning.
- Why Learn It: If your data analysis involves machine learning, these libraries will help in building, training, and deploying deep learning models.
- Key Features:
- Tensor processing and automatic differentiation.
- Building neural networks.
10. Dask (Optional)
- Purpose: Parallel computing for data analysis.
- Why Learn It: Dask enables scalable data manipulation by parallelizing Pandas operations, making it ideal for big datasets.
- Key Features:
- Works with NumPy, Pandas, and Scikit-learn.
- Handles large data and parallel computations easily.
Focusing on NumPy, Pandas, Matplotlib, and Seaborn will set a strong foundation for basic data analysis.
8 notes
·
View notes
Text
Unlocking the Power of Data: Essential Skills to Become a Data Scientist

In today's data-driven world, the demand for skilled data scientists is skyrocketing. These professionals are the key to transforming raw information into actionable insights, driving innovation and shaping business strategies. But what exactly does it take to become a data scientist? It's a multidisciplinary field, requiring a unique blend of technical prowess and analytical thinking. Let's break down the essential skills you'll need to embark on this exciting career path.
1. Strong Mathematical and Statistical Foundation:
At the heart of data science lies a deep understanding of mathematics and statistics. You'll need to grasp concepts like:
Linear Algebra and Calculus: Essential for understanding machine learning algorithms and optimizing models.
Probability and Statistics: Crucial for data analysis, hypothesis testing, and drawing meaningful conclusions from data.
2. Programming Proficiency (Python and/or R):
Data scientists are fluent in at least one, if not both, of the dominant programming languages in the field:
Python: Known for its readability and extensive libraries like Pandas, NumPy, Scikit-learn, and TensorFlow, making it ideal for data manipulation, analysis, and machine learning.
R: Specifically designed for statistical computing and graphics, R offers a rich ecosystem of packages for statistical modeling and visualization.
3. Data Wrangling and Preprocessing Skills:
Raw data is rarely clean and ready for analysis. A significant portion of a data scientist's time is spent on:
Data Cleaning: Handling missing values, outliers, and inconsistencies.
Data Transformation: Reshaping, merging, and aggregating data.
Feature Engineering: Creating new features from existing data to improve model performance.
4. Expertise in Databases and SQL:
Data often resides in databases. Proficiency in SQL (Structured Query Language) is essential for:
Extracting Data: Querying and retrieving data from various database systems.
Data Manipulation: Filtering, joining, and aggregating data within databases.
5. Machine Learning Mastery:
Machine learning is a core component of data science, enabling you to build models that learn from data and make predictions or classifications. Key areas include:
Supervised Learning: Regression, classification algorithms.
Unsupervised Learning: Clustering, dimensionality reduction.
Model Selection and Evaluation: Choosing the right algorithms and assessing their performance.
6. Data Visualization and Communication Skills:
Being able to effectively communicate your findings is just as important as the analysis itself. You'll need to:
Visualize Data: Create compelling charts and graphs to explore patterns and insights using libraries like Matplotlib, Seaborn (Python), or ggplot2 (R).
Tell Data Stories: Present your findings in a clear and concise manner that resonates with both technical and non-technical audiences.
7. Critical Thinking and Problem-Solving Abilities:
Data scientists are essentially problem solvers. You need to be able to:
Define Business Problems: Translate business challenges into data science questions.
Develop Analytical Frameworks: Structure your approach to solve complex problems.
Interpret Results: Draw meaningful conclusions and translate them into actionable recommendations.
8. Domain Knowledge (Optional but Highly Beneficial):
Having expertise in the specific industry or domain you're working in can give you a significant advantage. It helps you understand the context of the data and formulate more relevant questions.
9. Curiosity and a Growth Mindset:
The field of data science is constantly evolving. A genuine curiosity and a willingness to learn new technologies and techniques are crucial for long-term success.
10. Strong Communication and Collaboration Skills:
Data scientists often work in teams and need to collaborate effectively with engineers, business stakeholders, and other experts.
Kickstart Your Data Science Journey with Xaltius Academy's Data Science and AI Program:
Acquiring these skills can seem like a daunting task, but structured learning programs can provide a clear and effective path. Xaltius Academy's Data Science and AI Program is designed to equip you with the essential knowledge and practical experience to become a successful data scientist.
Key benefits of the program:
Comprehensive Curriculum: Covers all the core skills mentioned above, from foundational mathematics to advanced machine learning techniques.
Hands-on Projects: Provides practical experience working with real-world datasets and building a strong portfolio.
Expert Instructors: Learn from industry professionals with years of experience in data science and AI.
Career Support: Offers guidance and resources to help you launch your data science career.
Becoming a data scientist is a rewarding journey that blends technical expertise with analytical thinking. By focusing on developing these key skills and leveraging resources like Xaltius Academy's program, you can position yourself for a successful and impactful career in this in-demand field. The power of data is waiting to be unlocked – are you ready to take the challenge?
3 notes
·
View notes
Text
Machine Learning: A Comprehensive Overview
Machine Learning (ML) is a subfield of synthetic intelligence (AI) that offers structures with the capacity to robotically examine and enhance from revel in without being explicitly programmed. Instead of using a fixed set of guidelines or commands, device studying algorithms perceive styles in facts and use the ones styles to make predictions or decisions. Over the beyond decade, ML has transformed how we have interaction with generation, touching nearly each aspect of our every day lives — from personalised recommendations on streaming services to actual-time fraud detection in banking.

Machine learning algorithms
What is Machine Learning?
At its center, gadget learning entails feeding facts right into a pc algorithm that allows the gadget to adjust its parameters and improve its overall performance on a project through the years. The more statistics the machine sees, the better it usually turns into. This is corresponding to how humans study — through trial, error, and revel in.
Arthur Samuel, a pioneer within the discipline, defined gadget gaining knowledge of in 1959 as “a discipline of take a look at that offers computers the capability to study without being explicitly programmed.” Today, ML is a critical technology powering a huge array of packages in enterprise, healthcare, science, and enjoyment.
Types of Machine Learning
Machine studying can be broadly categorised into 4 major categories:
1. Supervised Learning
For example, in a spam electronic mail detection device, emails are classified as "spam" or "no longer unsolicited mail," and the algorithm learns to classify new emails for this reason.
Common algorithms include:
Linear Regression
Logistic Regression
Support Vector Machines (SVM)
Decision Trees
Random Forests
Neural Networks
2. Unsupervised Learning
Unsupervised mastering offers with unlabeled information. Clustering and association are commonplace obligations on this class.
Key strategies encompass:
K-Means Clustering
Hierarchical Clustering
Principal Component Analysis (PCA)
Autoencoders
three. Semi-Supervised Learning
It is specifically beneficial when acquiring categorised data is highly-priced or time-consuming, as in scientific diagnosis.
Four. Reinforcement Learning
Reinforcement mastering includes an agent that interacts with an surroundings and learns to make choices with the aid of receiving rewards or consequences. It is broadly utilized in areas like robotics, recreation gambling (e.G., AlphaGo), and independent vehicles.
Popular algorithms encompass:
Q-Learning
Deep Q-Networks (DQN)
Policy Gradient Methods
Key Components of Machine Learning Systems
1. Data
Data is the muse of any machine learning version. The pleasant and quantity of the facts directly effect the performance of the version. Preprocessing — consisting of cleansing, normalization, and transformation — is vital to make sure beneficial insights can be extracted.
2. Features
Feature engineering, the technique of selecting and reworking variables to enhance model accuracy, is one of the most important steps within the ML workflow.
Three. Algorithms
Algorithms define the rules and mathematical fashions that help machines study from information. Choosing the proper set of rules relies upon at the trouble, the records, and the desired accuracy and interpretability.
4. Model Evaluation
Models are evaluated the use of numerous metrics along with accuracy, precision, consider, F1-score (for class), or RMSE and R² (for regression). Cross-validation enables check how nicely a model generalizes to unseen statistics.
Applications of Machine Learning
Machine getting to know is now deeply incorporated into severa domain names, together with:
1. Healthcare
ML is used for disorder prognosis, drug discovery, customized medicinal drug, and clinical imaging. Algorithms assist locate situations like cancer and diabetes from clinical facts and scans.
2. Finance
Fraud detection, algorithmic buying and selling, credit score scoring, and client segmentation are pushed with the aid of machine gaining knowledge of within the financial area.
3. Retail and E-commerce
Recommendation engines, stock management, dynamic pricing, and sentiment evaluation assist businesses boom sales and improve patron revel in.
Four. Transportation
Self-riding motors, traffic prediction, and route optimization all rely upon real-time gadget getting to know models.
6. Cybersecurity
Anomaly detection algorithms help in identifying suspicious activities and capacity cyber threats.
Challenges in Machine Learning
Despite its rapid development, machine mastering still faces numerous demanding situations:
1. Data Quality and Quantity
Accessing fantastic, categorised statistics is often a bottleneck. Incomplete, imbalanced, or biased datasets can cause misguided fashions.
2. Overfitting and Underfitting
Overfitting occurs when the model learns the education statistics too nicely and fails to generalize.
Three. Interpretability
Many modern fashions, specifically deep neural networks, act as "black boxes," making it tough to recognize how predictions are made — a concern in excessive-stakes regions like healthcare and law.
4. Ethical and Fairness Issues
Algorithms can inadvertently study and enlarge biases gift inside the training facts. Ensuring equity, transparency, and duty in ML structures is a growing area of studies.
5. Security
Adversarial assaults — in which small changes to enter information can fool ML models — present critical dangers, especially in applications like facial reputation and autonomous riding.
Future of Machine Learning
The destiny of system studying is each interesting and complicated. Some promising instructions consist of:
1. Explainable AI (XAI)
Efforts are underway to make ML models greater obvious and understandable, allowing customers to believe and interpret decisions made through algorithms.
2. Automated Machine Learning (AutoML)
AutoML aims to automate the stop-to-cease manner of applying ML to real-world issues, making it extra reachable to non-professionals.
3. Federated Learning
This approach permits fashions to gain knowledge of across a couple of gadgets or servers with out sharing uncooked records, enhancing privateness and efficiency.
4. Edge ML
Deploying device mastering models on side devices like smartphones and IoT devices permits real-time processing with reduced latency and value.
Five. Integration with Other Technologies
ML will maintain to converge with fields like blockchain, quantum computing, and augmented fact, growing new opportunities and challenges.
2 notes
·
View notes
Text
Simple Linear Regression in Data Science and machine learning
Simple linear regression is one of the most important techniques in data science and machine learning. It is the foundation of many statistical and machine learning models. Even though it is simple, its concepts are widely applicable in predicting outcomes and understanding relationships between variables.
This article will help you learn about:
1. What is simple linear regression and why it matters.
2. The step-by-step intuition behind it.
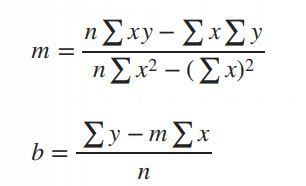
3. The math of finding slope() and intercept().
4. Simple linear regression coding using Python.
5. A practical real-world implementation.
If you are new to data science or machine learning, don’t worry! We will keep things simple so that you can follow along without any problems.
What is simple linear regression?
Simple linear regression is a method to model the relationship between two variables:
1. Independent variable (X): The input, also called the predictor or feature.
2. Dependent Variable (Y): The output or target value we want to predict.
The main purpose of simple linear regression is to find a straight line (called the regression line) that best fits the data. This line minimizes the error between the actual and predicted values.
The mathematical equation for the line is:
Y = mX + b
: The predicted values.
: The slope of the line (how steep it is).
: The intercept (the value of when).
Why use simple linear regression?
click here to read more https://datacienceatoz.blogspot.com/2025/01/simple-linear-regression-in-data.html
#artificial intelligence#bigdata#books#machine learning#machinelearning#programming#python#science#skills#big data#linear algebra#linear b#slope#interception
6 notes
·
View notes
Text
How to Become a Data Scientist in 2025 (Roadmap for Absolute Beginners)

Want to become a data scientist in 2025 but don’t know where to start? You’re not alone. With job roles, tech stacks, and buzzwords changing rapidly, it’s easy to feel lost.
But here’s the good news: you don’t need a PhD or years of coding experience to get started. You just need the right roadmap.
Let’s break down the beginner-friendly path to becoming a data scientist in 2025.
✈️ Step 1: Get Comfortable with Python
Python is the most beginner-friendly programming language in data science.
What to learn:
Variables, loops, functions
Libraries like NumPy, Pandas, and Matplotlib
Why: It’s the backbone of everything you’ll do in data analysis and machine learning.
🔢 Step 2: Learn Basic Math & Stats
You don’t need to be a math genius. But you do need to understand:
Descriptive statistics
Probability
Linear algebra basics
Hypothesis testing
These concepts help you interpret data and build reliable models.
📊 Step 3: Master Data Handling
You’ll spend 70% of your time cleaning and preparing data.
Skills to focus on:
Working with CSV/Excel files
Cleaning missing data
Data transformation with Pandas
Visualizing data with Seaborn/Matplotlib
This is the “real work” most data scientists do daily.
🧬 Step 4: Learn Machine Learning (ML)
Once you’re solid with data handling, dive into ML.
Start with:
Supervised learning (Linear Regression, Decision Trees, KNN)
Unsupervised learning (Clustering)
Model evaluation metrics (accuracy, recall, precision)
Toolkits: Scikit-learn, XGBoost
🚀 Step 5: Work on Real Projects
Projects are what make your resume pop.
Try solving:
Customer churn
Sales forecasting
Sentiment analysis
Fraud detection
Pro tip: Document everything on GitHub and write blogs about your process.
✏️ Step 6: Learn SQL and Databases
Data lives in databases. Knowing how to query it with SQL is a must-have skill.
Focus on:
SELECT, JOIN, GROUP BY
Creating and updating tables
Writing nested queries
🌍 Step 7: Understand the Business Side
Data science isn’t just tech. You need to translate insights into decisions.
Learn to:
Tell stories with data (data storytelling)
Build dashboards with tools like Power BI or Tableau
Align your analysis with business goals
🎥 Want a Structured Way to Learn All This?
Instead of guessing what to learn next, check out Intellipaat’s full Data Science course on YouTube. It covers Python, ML, real projects, and everything you need to build job-ready skills.
https://www.youtube.com/watch?v=rxNDw68XcE4
🔄 Final Thoughts
Becoming a data scientist in 2025 is 100% possible — even for beginners. All you need is consistency, a good learning path, and a little curiosity.
Start simple. Build as you go. And let your projects speak louder than your resume.
Drop a comment if you’re starting your journey. And don’t forget to check out the free Intellipaat course to speed up your progress!
2 notes
·
View notes
Text
What are the skills needed for a data scientist job?
It’s one of those careers that’s been getting a lot of buzz lately, and for good reason. But what exactly do you need to become a data scientist? Let’s break it down.
Technical Skills
First off, let's talk about the technical skills. These are the nuts and bolts of what you'll be doing every day.
Programming Skills: At the top of the list is programming. You’ll need to be proficient in languages like Python and R. These are the go-to tools for data manipulation, analysis, and visualization. If you’re comfortable writing scripts and solving problems with code, you’re on the right track.
Statistical Knowledge: Next up, you’ve got to have a solid grasp of statistics. This isn’t just about knowing the theory; it’s about applying statistical techniques to real-world data. You’ll need to understand concepts like regression, hypothesis testing, and probability.
Machine Learning: Machine learning is another biggie. You should know how to build and deploy machine learning models. This includes everything from simple linear regressions to complex neural networks. Familiarity with libraries like scikit-learn, TensorFlow, and PyTorch will be a huge plus.
Data Wrangling: Data isn’t always clean and tidy when you get it. Often, it’s messy and requires a lot of preprocessing. Skills in data wrangling, which means cleaning and organizing data, are essential. Tools like Pandas in Python can help a lot here.
Data Visualization: Being able to visualize data is key. It’s not enough to just analyze data; you need to present it in a way that makes sense to others. Tools like Matplotlib, Seaborn, and Tableau can help you create clear and compelling visuals.
Analytical Skills
Now, let’s talk about the analytical skills. These are just as important as the technical skills, if not more so.
Problem-Solving: At its core, data science is about solving problems. You need to be curious and have a knack for figuring out why something isn’t working and how to fix it. This means thinking critically and logically.
Domain Knowledge: Understanding the industry you’re working in is crucial. Whether it’s healthcare, finance, marketing, or any other field, knowing the specifics of the industry will help you make better decisions and provide more valuable insights.
Communication Skills: You might be working with complex data, but if you can’t explain your findings to others, it’s all for nothing. Being able to communicate clearly and effectively with both technical and non-technical stakeholders is a must.
Soft Skills
Don’t underestimate the importance of soft skills. These might not be as obvious, but they’re just as critical.
Collaboration: Data scientists often work in teams, so being able to collaborate with others is essential. This means being open to feedback, sharing your ideas, and working well with colleagues from different backgrounds.
Time Management: You’ll likely be juggling multiple projects at once, so good time management skills are crucial. Knowing how to prioritize tasks and manage your time effectively can make a big difference.
Adaptability: The field of data science is always evolving. New tools, techniques, and technologies are constantly emerging. Being adaptable and willing to learn new things is key to staying current and relevant in the field.
Conclusion
So, there you have it. Becoming a data scientist requires a mix of technical prowess, analytical thinking, and soft skills. It’s a challenging but incredibly rewarding career path. If you’re passionate about data and love solving problems, it might just be the perfect fit for you.
Good luck to all of you aspiring data scientists out there!
#artificial intelligence#career#education#coding#jobs#programming#success#python#data science#data scientist#data security
9 notes
·
View notes
Text
@girderednerve replied to your post coming out on tumblr as someone whose taught "AI bootcamp" courses to middle school students AMA:
did they like it? what kinds of durable skills did you want them to walk away with? do you feel bullish on "AI"?
It was an extracurricular thing so the students were quite self-selecting and all were already interested in the topic or in doing well in the class. Probably what most interested me about the demographic of students taking the courses (they were online) was the number who were international students outside of the imperial core probably eventually looking to go abroad for college, like watching/participating in the cogs of brain drain.
I'm sure my perspective is influenced because my background is in statistics and not computer science. But I hope that they walked away with a greater understanding and familiarity with data and basic statistical concepts. Things like sample bias, types of data (categorical/quantitative/qualitative), correlation (and correlation not being causation), ways to plot and examine data. Lots of students weren't familiar before we started the course with like, what a csv file is/tabular data in general. I also tried to really emphasize that data doesn't appear in a vacuum and might not represent an "absolute truth" about the world and there are many many ways that data can become biased especially when its on topics where people's existing demographic biases are already influencing reality.
Maybe a bit tangential but there was a part of the course material that was teaching logistic regression using the example of lead pipes in flint, like, can you believe the water in this town was undrinkable until it got Fixed using the power of AI to Predict Where The Lead Pipes Would Be? it was definitely a trip to ask my students if they'd heard of the flint water crisis and none of them had. also obviously it was a trip for the course material to present the flint water crisis as something that got "fixed by AI". added in extra information for my students like, by the way this is actually still happening and was a major protest event especially due to the socioeconomic and racial demographics of flint.
Aside from that, python is a really useful general programming language so if any of the students go on to do any more CS stuff which is probably a decent chunk of them I'd hope that their coding problemsolving skills and familiarity with it would be improved.
do i feel bullish on "AI"? broad question. . . once again remember my disclaimer bias statement on how i have a stats degree but i definitely came away from after teaching classes on it feeling that a lot of machine learning is like if you repackaged statistics and replaced the theoretical/scientific aspects where you confirm that a certain model is appropriate for the data and test to see if it meets your assumptions with computational power via mass guessing and seeing if your mass guessing was accurate or not lol. as i mentioned in my tags i also really don't think things like linear regression which were getting taught as "AI" should be considered "ML" or "AI" anyways, but the larger issue there is that "AI" is a buzzy catchword that can really mean anything. i definitely think relatedly that there will be a bit of an AI bubble in that people are randomly applying AI to tasks that have no business getting done that way and they will eventually reap the pointlessness of these projects.
besides that though, i'm pretty frustrated with a lot of AI hysteria which assumes that anything that is labeled as "AI" must be evil/useless/bad and also which lacks any actual labor-based understanding of the evils of capitalism. . . like AI (as badly formed as I feel the term is) isn't just people writing chatGPT essays or whatever, it's also used for i.e. lots of cutting edge medical research. if insanely we are going to include "linear regression" as an AI thing that's probably half of social science research too. i occasionally use copilot or an LLM for my work which is in public health data affiliated with a university. last week i got driven batty by a post that was like conspiratorially speculating "spotify must have used AI for wrapped this year and thats why its so bad and also why it took a second longer to load, that was the ai generating everything behind the scenes." im saying this as someone who doesnt use spotify, 1) the ship on spotify using algorithms sailed like a decade ago, how do you think your weekly mixes are made? 2) like truly what is the alternative did you think that previously a guy from minnesota was doing your spotify wrapped for you ahead of time by hand like a fucking christmas elf and loading it personally into your account the night before so it would be ready for you? of course it did turned out that spotify had major layoffs so i think the culprit here is really understaffing.
like not to say that AI like can't have a deleterious effect on workers, like i literally know people who were fired through the logic that AI could be used to obviate their jobs. which usually turned out not to be true, but hasn't the goal of stretching more productivity from a single worker whether its effective or not been a central axiom of the capitalist project this whole time? i just don't think that this is spiritually different from retail ceos discovering that they could chronically understaff all of their stores.
2 notes
·
View notes
Text
ML Zoomcamp
Just completed the second week of Machine Learning Zoomcamp.
The lessons covered include: 1 Car price prediction project 2 Data preparation 3 Exploratory data analysis 4 Setting up the validation framework 5 Linear regression 6 Linear regression: vector form 7 Training linear regression: Normal equation 8 Baseline model for car price prediction project 9 Root mean squared error 10 Using RMSE on validation data 11 Feature engineering 12 Categorical variables 13 Regularization 14 Tuning the model 15 Using the model 16 Car price prediction project summary 17 Explore more
The link to the course is below: https://github.com/DataTalksClub/machine-learning-zoomcamp
2 notes
·
View notes
Text
The Skills I Acquired on My Path to Becoming a Data Scientist
Data science has emerged as one of the most sought-after fields in recent years, and my journey into this exciting discipline has been nothing short of transformative. As someone with a deep curiosity for extracting insights from data, I was naturally drawn to the world of data science. In this blog post, I will share the skills I acquired on my path to becoming a data scientist, highlighting the importance of a diverse skill set in this field.
The Foundation — Mathematics and Statistics
At the core of data science lies a strong foundation in mathematics and statistics. Concepts such as probability, linear algebra, and statistical inference form the building blocks of data analysis and modeling. Understanding these principles is crucial for making informed decisions and drawing meaningful conclusions from data. Throughout my learning journey, I immersed myself in these mathematical concepts, applying them to real-world problems and honing my analytical skills.
Programming Proficiency
Proficiency in programming languages like Python or R is indispensable for a data scientist. These languages provide the tools and frameworks necessary for data manipulation, analysis, and modeling. I embarked on a journey to learn these languages, starting with the basics and gradually advancing to more complex concepts. Writing efficient and elegant code became second nature to me, enabling me to tackle large datasets and build sophisticated models.
Data Handling and Preprocessing
Working with real-world data is often messy and requires careful handling and preprocessing. This involves techniques such as data cleaning, transformation, and feature engineering. I gained valuable experience in navigating the intricacies of data preprocessing, learning how to deal with missing values, outliers, and inconsistent data formats. These skills allowed me to extract valuable insights from raw data and lay the groundwork for subsequent analysis.
Data Visualization and Communication
Data visualization plays a pivotal role in conveying insights to stakeholders and decision-makers. I realized the power of effective visualizations in telling compelling stories and making complex information accessible. I explored various tools and libraries, such as Matplotlib and Tableau, to create visually appealing and informative visualizations. Sharing these visualizations with others enhanced my ability to communicate data-driven insights effectively.

Machine Learning and Predictive Modeling
Machine learning is a cornerstone of data science, enabling us to build predictive models and make data-driven predictions. I delved into the realm of supervised and unsupervised learning, exploring algorithms such as linear regression, decision trees, and clustering techniques. Through hands-on projects, I gained practical experience in building models, fine-tuning their parameters, and evaluating their performance.
Database Management and SQL
Data science often involves working with large datasets stored in databases. Understanding database management and SQL (Structured Query Language) is essential for extracting valuable information from these repositories. I embarked on a journey to learn SQL, mastering the art of querying databases, joining tables, and aggregating data. These skills allowed me to harness the power of databases and efficiently retrieve the data required for analysis.

Domain Knowledge and Specialization
While technical skills are crucial, domain knowledge adds a unique dimension to data science projects. By specializing in specific industries or domains, data scientists can better understand the context and nuances of the problems they are solving. I explored various domains and acquired specialized knowledge, whether it be healthcare, finance, or marketing. This expertise complemented my technical skills, enabling me to provide insights that were not only data-driven but also tailored to the specific industry.
Soft Skills — Communication and Problem-Solving
In addition to technical skills, soft skills play a vital role in the success of a data scientist. Effective communication allows us to articulate complex ideas and findings to non-technical stakeholders, bridging the gap between data science and business. Problem-solving skills help us navigate challenges and find innovative solutions in a rapidly evolving field. Throughout my journey, I honed these skills, collaborating with teams, presenting findings, and adapting my approach to different audiences.
Continuous Learning and Adaptation
Data science is a field that is constantly evolving, with new tools, technologies, and trends emerging regularly. To stay at the forefront of this ever-changing landscape, continuous learning is essential. I dedicated myself to staying updated by following industry blogs, attending conferences, and participating in courses. This commitment to lifelong learning allowed me to adapt to new challenges, acquire new skills, and remain competitive in the field.
In conclusion, the journey to becoming a data scientist is an exciting and dynamic one, requiring a diverse set of skills. From mathematics and programming to data handling and communication, each skill plays a crucial role in unlocking the potential of data. Aspiring data scientists should embrace this multidimensional nature of the field and embark on their own learning journey. If you want to learn more about Data science, I highly recommend that you contact ACTE Technologies because they offer Data Science courses and job placement opportunities. Experienced teachers can help you learn better. You can find these services both online and offline. Take things step by step and consider enrolling in a course if you’re interested. By acquiring these skills and continuously adapting to new developments, they can make a meaningful impact in the world of data science.
#data science#data visualization#education#information#technology#machine learning#database#sql#predictive analytics#r programming#python#big data#statistics
14 notes
·
View notes
Text
How do I learn R, Python and data science?
Learning R, Python, and Data Science: A Comprehensive Guide
Choosing the Right Language
R vs. Python: Both R and Python are very powerful tools for doing data science. R is usually preferred for doing statistical analysis and data visualisations, whereas Python is much more general and currently is very popular for machine learning and general-purpose programming. Your choice of which language to learn should consider your specific goals and preferences.
Building a Strong Foundation
Structured Courses Online Courses and Tutorials: Coursera, edX, and Lejhro offer courses and tutorials in R and Python for data science. Look out for courses that develop theoretical knowledge with practical exercises. Practise your skills with hands-on coding challenges using accompanying datasets, offered on websites like Kaggle and DataCamp.
Books: There are enough books to learn R and Python for data science. You may go through the classical ones: "R for Data Science" by Hadley Wickham, and "Python for Data Analysis" by Wes McKinney.
Learning Data Science Concepts
Statistics: Know basic statistical concepts: probability, distribution, hypothesis testing, and regression analysis.
Cleaning and Preprocessing: Learn how to handle missing data techniques, outliers, and data normalisation.
Data Visualization: Expert libraries to provide informative visualisations, including but not limited to Matplotlib and Seaborn in Python and ggplot2 in R.
Machine Learning: Learn algorithms-Linear Regression, Logistic Regression, Decision Trees, Random Forest, Neural Networks, etc.
Deep Learning: Study deep neural network architecture and how to build and train them using the frameworks TensorFlow and PyTorch.
Practical Experience
Personal Projects: In this, you apply your knowledge to personal projects which help in building a portfolio.
Kaggle Competitions: Participate in Kaggle competitions to solve real-world problems in data science and learn from others.
Contributions to Open-Source Projects: Contribute to some open-source projects for data science in order to gain experience and work with other people.
Other Advice
Join Online Communities: Join online forums or communities such as Stack Overflow and Reddit to ask questions, get help, and connect with other data scientists.
Attend Conferences and Meetups: This is a fantastic way to network with similar working professionals in the field and know the latest trends going on in the industry.
Practice Regularly: For becoming proficient in data science, consistent practice is an indispensable element. Devote some time each day for practising coding challenges or personal projects.
This can be achieved by following the above-mentioned steps and having a little bit of dedication towards learning R, Python, and Data Science.
2 notes
·
View notes
Text

Advances in fiber-based wearable sensors with machine learning
The rapid development of artificial intelligence (AI) in the past decade has greatly enhanced the ability of wearable devices to process complex data. Among them, machine learning—a major category of AI algorithms—and its important branch, deep learning, are the main thrust of this wave of AI. Machine learning eliminates the labor cost of manually extracting data features, and its deep learning branch has powerful insights into hidden features. Their large demand for data fits the massive information brought by this era of information explosion. A recent study summarizes all machine learning algorithms that have been used in conjunction with fiber sensors, divided into two categories: traditional machine learning algorithms and deep learning algorithms. Traditional machine learning algorithms include linear regression (LR), k nearest neighbors (KNN), support vector machine (SVM), random forest, XGBoost, and K means clustering.
Read more.
#Materials Science#Science#Fibers#Machine learning#Computational materials science#Sensors#Wearable technology#Electronics
4 notes
·
View notes
Text
Beginner’s Guide to Ridge Regression in Machine Learning
Introduction
Regression analysis is a fundamental technique in machine learning, used to predict a dependent variable based on one or more independent variables. However, traditional regression methods, such as simple linear regression, can struggle to deal with multicollinearity (high correlation between predictors). This is where ridge regression comes in handy.
Ridge regression is an advanced form of linear regression that reduces overfitting by adding a penalty term to the model. In this article, we will cover what ridge regression is, why it is important, how it works, its assumptions, and how to implement it using Python.
What is Ridge Regression?
Ridge regression is a type of regularization technique that modifies the linear
click here to read more
https://datacienceatoz.blogspot.com/2025/02/a-beginners-guide-to-ridge-regression.html
#artificial intelligence#bigdata#books#machine learning#machinelearning#programming#python#science#skills#big data
4 notes
·
View notes