#Open data
Explore tagged Tumblr posts
Visit Tumblr Blog
Explore Tumblr blogs with no restrictions, modern design and the best experience.
Last Seen Tumblr Blogs


Fun Fact
Tumblr Inc. is funded by 13 investors.
Photo

Read an article by the civic technology organization Pollicy to learn about the biggest challenges to digital rights for women and discover the different ways to advance women’s digital rights!
👉 http://bit.ly/3YJkUpb
📸 by Gayatri Malhotra on Unsplash
#digital rights#digital activism#digital privacy#digital security#internet freedom#save the internet#internet security#net neutrality#internet shutdown#online privacy#privacy#online safety#cybersecurity awareness#technology#open data#data security#disinformation#misinformation#censorship#free expression#surveillance#women’s rights#feminist#feminism
109 notes
·
View notes
Photo
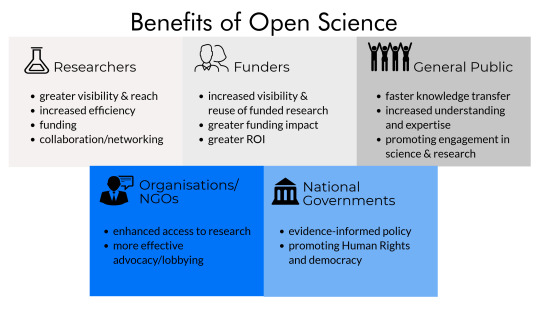
Adopting good scientific practices increases your visibility and the grade of your thesis
This is a short preview of the article: Adopting good scientific practices increases your visibility and your grade! Adopting healthy scientific practices is essential for conducting good quality research. This may be intuitive but it is hard to achieve and does not happen naturally. This video from the Royal Society introduces the
If you like it consider checking out the full version of the post at: Adopting good scientific practices increases your visibility and the grade of your thesis
If you are looking for ideas for tweet or re-blog this post you may want to consider the following hashtags:
Hashtags: #BetterThesis, #BigData, #Data, #Datasets, #GoodGrade, #HowYourThesisWillBeUsed, #MasterThesis, #OpenAccess, #OpenData, #OpenScience, #ScientificPractices, #Thesis, #YourThesisAfterGraduation
The Hashtags of the Categories are: #Research, #Thesis, #Tutorial
Adopting good scientific practices increases your visibility and the grade of your thesis is available at the following link: https://francescolelli.info/thesis/adopting-good-scientific-practices-increases-your-visibility-and-the-grade-of-your-thesis/ You will find more information, stories, examples, data, opinions and scientific papers as part of a collection of articles about Information Management, Computer Science, Economics, Finance and More.
The title of the full article is: Adopting good scientific practices increases your visibility and the grade of your thesis
It belong to the following categories: Research, Thesis, Tutorial
The most relevant keywords are: better thesis, Big Data, data, datasets, good grade, how your thesis will be used, master thesis, open access, open data, open science, scientific practices, thesis, your thesis after graduation
It has been published by Francesco Lelli at Francesco Lelli a blog about Information Management, Computer Science, Finance, Economics and nearby ideas and opinions
Adopting good scientific practices increases your visibility and your grade! Adopting healthy scientific practices is essential for conducting good quality research. This may be intuitive but it is hard to achieve and does not happen naturally. This video from the Royal Society introduces the
Hope you will find it interesting and that it will help you in your journey
Adopting healthy scientific practices is essential for conducting good quality research. This may be intuitive but it is hard to achieve and does not happen naturally. This video from the Royal Society introduces the problem: The term “replication crisis” emphasizes that replication, a corner stone in science, is often considered of secondary importance. If we…
#better thesis#Big Data#data#datasets#good grade#how your thesis will be used#master thesis#open access#open data#open science#scientific practices#thesis#your thesis after graduation
385 notes
·
View notes
Text
DataBeers Torino 15 (RELOADED)

Caro Data (and beer) lover!
In questi mesi abbiamo custodito "al fresco" le birre e tenuto "in caldo" i nostri relatori, nell'attesa di poter, finalmente, riproporre l'evento che dal 2014 unisce la passione per i dati, gli eventi di community e la birra.
Come avrete intuito siamo di nuovo in pista per il 15° DataBeers Torino!
Confermiamo quindi il panel di speaker presentato prima dell'estate:
• Corrado Monti - Postdoctoral Researcher at ISI Foundation - “Predicting and Analyzing Donald Trump support on social media”
• Eleonora Priori - Università degli Studi di Torino - “Agent-based models: un laboratorio di simulazione per comprendere il mondo”
• Livio Bioglio - Università degli Studi di Torino - “What emotions TV shows trigger in their audiences?”
• Matteo Moretti - Social designer and Founder at Sheldon.studio - “Mapping Diversities” [INTERVENTO DA REMOTO]
... la location [Toolbox Coworking in Via Agostino da Montefeltro 2, Torino], l'orario 18:30 - 20:30
e naturalmente la birra Estrella!
ATTENZIONE!!! Le norme Covid-19 ci impongono una capienza massima di 50 persone nella sala ed il possesso del Green Pass per accedere agli spazi di Toolbox.
Quindi registratevi responsabilmente!
>>> https://www.eventbrite.com/e/175277508747 (Eventbrite)
Ci vediamo il prossimo 6 ottobre!
#data#open data#opendata#databeers#databeers torino#data scientist#data science#data mining#machine learning
2 notes
·
View notes
Text
Die Karte bearbeiten
Heute zeige ich euch, auf was es beim Bearbeiten von OpenStreetMap ankommt.
Als erstes muss man sich kostenlos registrieren, schließlich müssen die Änderungen an der Karte ja auch nachvollziehbar sein. Dazu klickt man auf der Seite https://www.openstreetmap.org/ rechts oben auf „Registrieren“ und gibt einen Benutzernamen, Emailadresse und Passwort an. Nach Bestätigung des Kontos ist man nun bereit.
Um einen neuen Karteninhalt zu erzeugen, sind einige Schritte notwendig. Natürlich muss man erst einmal Daten aufnehmen („mappen“). Das können Luftbilder (Orthofotos) sein oder auch mit dem GPS aufgenommene Positionsdaten (sogenannte GPS-Tracks). Man kann Daten aber auch mittels Skizzen notieren. Lokales Wissen ist ebenfalls sehr wertvoll. Zum Beispiel kann man auch Zusatzinformationen wie Öffnungszeiten zu den Kartenobjekten hinzufügen. Wichtig ist darauf zu achten, dass man nicht von anderen Quellen abzeichnet (z.B. von Google Maps) und keine Urheberrechtsverletzungen begeht.
Als nächstes muss man ein Bearbeitungsprogramm auswählen. Es gibt Offline-Editoren wie z.B. JOSM und auch Editoren für Mobilgeräte (z.B. „StreetComplete“). Ich habe mich für einen Online-Editor entschieden, und zwar „iD“. Das ist das Programm das aufgerufen wird, wenn man auf der OpenStreetMap-Seite auf „Bearbeiten“ klickt.
Jetzt kann man die Karte bearbeiten und die Daten einzeichnen. Eingefügt werden Punkte, Linien oder Flächen, es gibt auch noch geschlossene Linienzüge wie beispielsweise Kreisverkehre. Die selbst gesammelten Daten wie Luftbilder oder GPS-Tracks können nicht direkt in die Karte eingefügt werden, diese werden nur zum Einzeichnen hinterlegt.
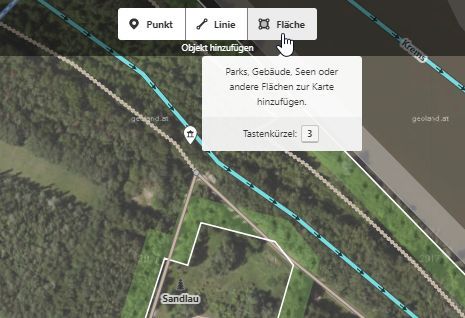
Hat man neue Objekte in der Karte erstellt, ist es auch noch wichtig Eigenschaften hinzuzufügen, sogenannte Attribute („tags“). Dies kann z.B. die Art des Objekts sein (Straße, Wald, Gewässer,…), Klassifizierungen (z.B. die Straße ist eine Autobahn --> „highway = motorway“) oder Zusatzinformationen wie beispielsweise Einschränkungen (Tempolimit, Einbahnstraße,…) und Namen.
Wenn man mit dem Bearbeiten fertig ist, kann man nun die Daten in die Map hochladen. Zum Abschluss muss man die Änderungen in der Map beschreiben, damit nachvollziehbar ist, was sich geändert hat. Ist man unsicher, ob man alles richtig gemacht hat, kann man auch andere Bearbeiter um eine Überprüfung bitten. Es dauert ein bisschen bis die Daten veröffentlich werden (bis zu einer halben Stunde ungefähr).
Wie im letzten Beitrag erwähnt, kann man dann auch eine Karte erzeugen. Es sind verschiedene Kartenebenen verfügbar, wie zum Beispiel Luftbilder von verschiedenen Quellen oder auch eine topographische Karte (OpenTopoMap).
Zu OpenStreetMap gibt es auch ein umfangreiches Wiki. Wenn ihr noch nähere Informationen zum Einstieg benötigt, werdet ihr hier fündig: https://wiki.openstreetmap.org/wiki/DE:Beginners%27_guide
Nach der ganzen Einführung habe ich das Bearbeiten gleich mal ausprobiert. Zufällig ist mir in der Karte ein Fehler aufgefallen, ein Gebäude in der Nähe meines Zuhauses wurde falsch als Einfamilienhaus klassifiziert. Da ich dort manchmal vorbeikomme, weiß ich aber, dass dort eine Scheune steht und kein Haus. Die Korrektur geht sehr schnell, einfach das Objekt anklicken und dann im Menü links mit einem Klick auf Objekttyp den Typ auf „Scheune“ ändern (=barn). Ich habe dann noch eine kurze Beschreibung hinzugefügt, dass das sicher eine Scheune ist und dann die Änderung hochgeladen.
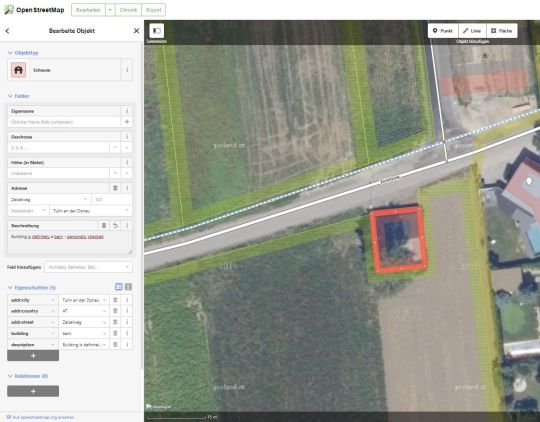
Umklassifizierung des Gebäudes
1 note
·
View note
Video
youtube
This is a great TED Talk about how data shows life expectancy vs. wealth over time geographically.
13 notes
·
View notes
Photo

Gestion et exploitation du patrimoine données
1 note
·
View note
Link
Materiom is a super interesting open data project that I am really excited to share with you all. This site has a ton of free and open source DIY recipes you can use to make all kinds of projects like plastics, 3D printing material, clay, and more!
1 note
·
View note
Photo

Information can be more powerful than regulation
The US government instituted the Toxic Release Inventory in 1986 – a new requirement for companies across a wide range of industries to report publicly their hazardous pollutant emissions every year. The document didn't define limits for the pollution nor special fines for the facilities with higher emissions.
The program was created as part of a response to several events that raised public concern about the availability of information on hazardous substances. The vision for the Toxics Release Inventory is that it's recognized as a premier resource for accessing information on possible exposure to toxic chemicals and pollution prevention activities that can reduce this exposure.
According to the environmental scientist Donella Meadows, by 1990 emissions dropped 40% comparing to the first released data and continued to decrease. One of the reasons, as Meadows believed, was the corporate reputation. One of the main pollutant companies even reduced its emissions by 90% to get out of the top list.
Bottom line:
Changing information flows can have a significant effect on physical reality, even without direct intervention. Making infrormation available is also usually cheaper and easier than trying to influence things through action and regulation.
3 notes
·
View notes
Text
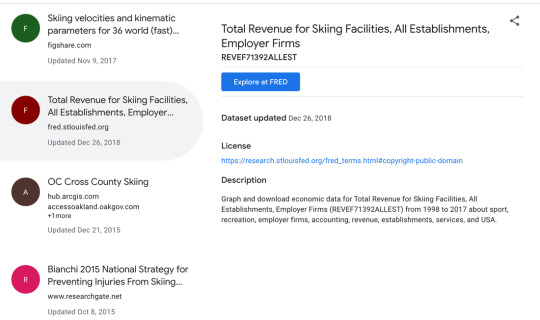
Google dataset search
Google has just released a new search functionality to discover available datasets on web.
Dataset Search has indexed almost 25 million datasets. You can filter the results based on the types of dataset that you want (e.g., tables, images, text), or whether the dataset is available for free from the provider. Youncan contribute by making datasets discoverable in Dataset Search thought an open standard to describe the properties on the dataset on your web page.
Try it out:
7 notes
·
View notes
Photo

Part 3 and the last part of our Blog series on RightsCon is here! Find out what some of our favorite sessions are!
👉 https://bit.ly/3OTmjE3
#digital rights#human rights#women’s rights#digital activism#activism#advocacy#digital privacy#digital security#internet freedom#save the internet#internet security#net neutrality#internet shutdown#online privacy#privacy#online safety#cybersecurity awareness#technology#open data#data security#disinformation#misinformation#censorship#free expression#surveillance#dalai lama#malala#malala yousafzai
2 notes
·
View notes
Link
Artículo donde se hace una beve introducción a la filosofía del Open Data. Para los activistas de todo tipo es importante conocer sobre el Open Data.
3 notes
·
View notes
Text
The Age of Anxiety in New York: Data Visualizations for Public Health
Introduction
Homelessness, inequality, poverty — Anyone who has walked around Manhattan in 2019 for more than 30 minutes has encountered these social issues on the streets of the city where we once believed the American Dream was most alive. Everyone will agree that they are deeply upsetting, and almost everyone will agree that they feel powerless to this injustice.
Even on a grander scale, Americans will agree that depression is a large, close-to-home problem in the United States. Half of Americans have been personally affected by suicide in some way, showing that no one is too far removed from the ramifications of poor mental health.
In urban domains, public health officials often approach physical ailments from a human geography perspective, examining correlations between socio-economics, demographics, and health indicators such as exercise and addiction. This approach begs a similar, but more novel question: how does public health influence *mental *health? Could certain attributes of a neighborhood’s health — role models, poverty, community inclusivity — predict the mental health of its constituents?
Key Question
How does *public *health influence *mental *health?
Dataset
The New York City Department of Public Health’s Community Health Survey (CHS) is a random telephone survey that has collected regional data on mental and physical health, household economic data, and community strength across the sheer racial, social, and economic diversity of the region.
CHS asks each respondent the eight standardized questions which make up Personal Health Questionnaire 8 (PHQ8), a clinically standard diagnostic tool for Major Depressive Disorder. An example form is attached below.
![A population-based study of edentulism in the US: Does depression and rural residency matter after controlling for potential confounders? — Scientific Figure on ResearchGate. Available from: https://www.researchgate.net/figure/Patient-health-questionnaire-PHQ-8-scoring-and-interpretation-with-BRFSS-response_tbl1_259875720 [accessed 5 Aug, 2019]](https://cdn-images-1.medium.com/max/2000/1JuO46avwLMsw5m-G1qql_A.png =100x)A population-based study of edentulism in the US: Does depression and rural residency matter after controlling for potential confounders? — Scientific Figure on ResearchGate. Available from: https://www.researchgate.net/figure/Patient-health-questionnaire-PHQ-8-scoring-and-interpretation-with-BRFSS-response_tbl1_259875720 [accessed 5 Aug, 2019]*
What makes CHS unique is that, in addition to asking the PHQ8 questionnaire, the survey asks New Yorkers to consider the quality of life in their neighborhood.
Analysis
In order to evaluate the relationship between neighborhood health and individual health, I first examined the prevalence of depression severity among those who answered the following questions:
How Would You Describe Your Food Security Situation?
About 10 percent of respondents who reported not having enough to eat in their household also qualified for severe depression. More than half of those reporting this level of food insecurity also qualified for depression of any severity.
Have You Experienced Discriminatory Healthcare Treatment in the Past 12 Months?
A similar pattern emerges with discriminatory healthcare treatment. About 5 percent of respondents who reported experiencing discriminatory healthcare treatment also reported severe depression, and about half of those who reported yes qualified for a depression diagnosis of any severity.
Conclusion
Depression is a very serious disease, oftentimes crippling those who suffer from it. Furthermore, the risk of suicide can destroy families and livelihoods.
Many assume that the distribution of depression in the American population is random or genetic. Rather, the results of this analysis point to a different hypothesis: while this analysis cannot assert that food insecurity and healthcare discrimination *cause *depression, the results point to a correlation between environmental factors such as food insecurity and discriminatory healthcare treatment and depression.
About 50 percent of New York City’s food-insecure citizens are depressed. 10 percent are severely depressed. I hypothesize that an inability to secure one’s basic needs facilitates depression and a sense of hopelessness.
The prevalence of severe depression among the food-insecure is simply disproportionate, which presents the idea that mental health can be a justice issue as obesity and smoking are.
1 note
·
View note
Text
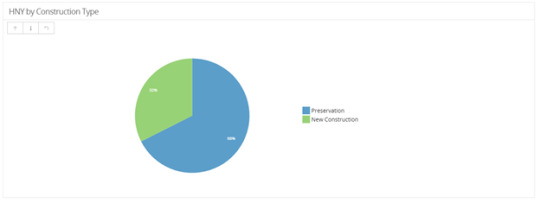
Behind the Scenes: HPD’s Housing New York Open Data
What/Who is HPD?
The New York City Department of Housing Preservation and Development (HPD) publishes nearly 40 open datasets on the city’s Open Data Portal. These datasets highlight the work we do every day to meet our agency mission: to promote the quality and affordability of the city’s housing and the strength and diversity of its many neighborhoods. HPD accomplishes its objectives through four key services:
• Preserving affordable housing and protecting tenants
• Developing new affordable housing
• Enforcing the Housing Maintenance Code
• Engaging neighborhoods in planning
While we publish Open Data related to a variety of our programs and services, this blog post will focus on the datasets related to the Mayor’s Housing New York plan.
What is Housing New York?
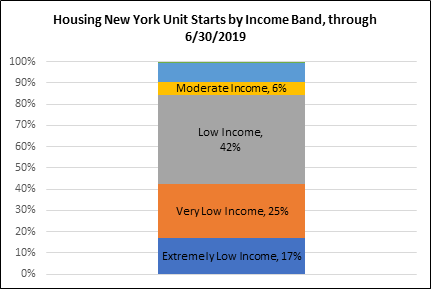
Chart based on Affordability Levels Table in Housing New York by the Numbers https://www1.nyc.gov/site/hpd/about/housing-new-york-by-the-numbers.page
HPD is the agency responsible for leading Housing New York (HNY), Mayor de Blasio’s plan to create or preserve 300,000 affordable homes by 2026. HNY is the most ambitious housing plan in the country; 300,000 units are enough homes to house the entire population of Seattle or Boston.
Over the course of this 12-year plan, the goal is to preserve 60% and create (or build) 40% of the total 300,000 affordable housing units. Each housing unit we create or preserve targets a specific income group. Per the graphic above, nearly 85% of our housing units serve extremely low, very low, and low-income households, which are defined as a family of 3 making $76,880 or less each year.
In an effort to better enable the public to track progress towards Housing New York targets, HPD publishes two datasets with information on projects, buildings, and units counted towards the plan. Broadly, these datasets present information on projects that have been counted towards HNY at a building- and a project-level. You can find them by searching for “Housing New York” on the City’s Open Data Portal.


Housing New York Datasets
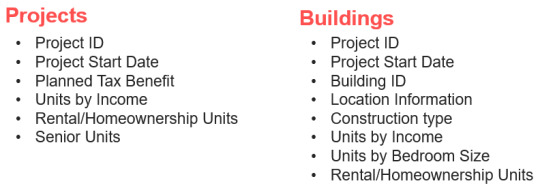
Housing New York data is divided into project-level and building-level data because some datapoints collected for the plan describe a whole project, and other datapoints describe attributes of buildings and units counted towards the plan.
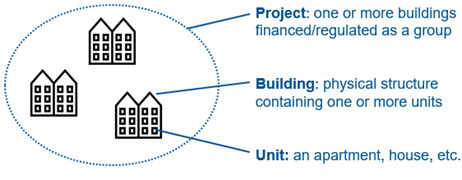
As shown below, a project is one or more buildings financed and/or regulated as a group entity. A building is a physical structure containing one or more units within a project. And a unit is an apartment, house, or any single residential dwelling unit.
The building-level file displays project information along with its associated building datapoints such as house number, street name, borough-block-lot (BBL), and Building Identification Number (BIN) for each building within a project. Unit counts are provided by building.
The project-level file displays information by project and includes datapoints such as the presence of senior units. Unit counts are provided for each project, rather than by building.
How to use Housing New York Open Data
You might ask: How can I use these Housing New York open datasets to track progress towards the plan’s objectives? Both datasets contain diverse datapoints, but here’s a quick overview of some of the fields included in each file:
You can use the projects file to see what percentage of HNY units serve low-income households:
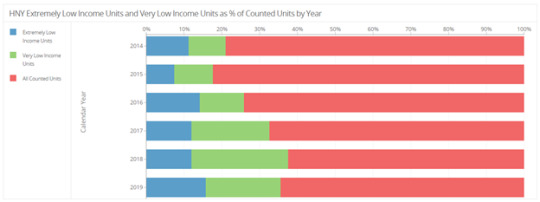
The buildings file can be used to look at HNY metrics by construction type. See the visualization of HNY units by construction type below.
And that’s not all! We recommend that you play around with the Open Data Portal’s built-in visualization features to explore our data even further. You can access the visualization tool by clicking the “Visualize” button on the top right of the Housing New York dataset pages.
Tips + Tricks for using HPD’s HNY Datasets
Now that we’ve covered the differences between the Housing New York datasets and some basic examples of what you can analyze with this information, we want to leave you with some final tips and tricks for working with this data.
• HNY by Project dataset presents data at the project-level
• HNY by Building dataset presents the data at the building-level
• ‘Project ID’ links the two datasets together
• HNY buildings are geocoded, except for confidential projects (confidential projects assist specific homeowners or other special populations, e.g.:domestic violence survivors)
• Data are updated quarterly
We encourage you to reach out to HPD if you have questions about our Open Data through the Portal’s Contact Us page, linked here.
#HPD#NYC#housing#housing preservation and development#open data#NYC Open Data#housing new york#HNY#data
3 notes
·
View notes
Text
Infos und Hintergründe zu OpenStreetMap
Heute habe ich mir einmal Informationen und Hintergründe zu OpenStreetMap angeschaut.
Kurz gesagt: OpenStreetMap (OSM) ist die Karte für Alle! Man darf mit den verwendeten Daten sogar Geld verdienen (man muss nur die Herkunft der Daten kennzeichnen). Die Daten sind auch wirklich frei, man „zahlt“ nicht mit irgendwelchen persönlichen Daten dafür wie bei anderen Anbietern. Ein passender Ausdruck wäre auch das „Wikipedia für Karten“. Jeder kann zur Erstellung und Verbesserung der Karte etwas beitragen. Karteninhalte können auch von anderen überprüft, und im Falle des Falles auch korrigiert werden.
Hier kann man sich die Karte einmal ansehen: https://www.openstreetmap.org/
Hinter der Karte steht die OpenStreetMap Foundation. Diese Non-Profit-Organisation hat sich zum Ziel gesetzt, allen Menschen einen freien Zugang zu geographischen Daten zu ermöglichen. Sie bildet den rechtlichen Rahmen für OpenStreetMap, verwaltet die Spendengelder, betreut die Server und noch viel mehr. Mehr als zwei Millionen Freiwillige sind schon dabei. Möchte man Mitglied werden, muss man einen kleinen Mitgliedsbeitrag zahlen. Diese Mitgliedschaft und die Mitarbeit darf man aber nicht verwechseln mit dem eigentlichen Kartenerstellen und Bearbeiten. Das ist kostenlos, man muss sich nur registrieren.
Hier gibt es weiterführende Informationen zur OSM Foundation: https://wiki.osmfoundation.org/wiki/Main_Page

Wie komme ich jetzt eigentlich an die Daten? – OpenStreetMap stellt die Kartendaten über mehrere Wege bereit. Man kann zum Beispiel Kartenbereiche von https://www.openstreetmap.org/ exportieren. Es gibt auch den „Planet Dump“, hier kann man sich die ganze Welt herunterladen (da braucht man halt einigen Speicherplatz, zurzeit 106 GB). Wenn man nicht die ganze Welt braucht, gibt es auch Data Extracts (von Drittanbietern), da kann man auch einzelne Länder oder Kontinente herunterladen.
Hier findet ihr den Planet Dump: https://planet.openstreetmap.org/ Und hier ein Anbieter für die Data Extracts: http://download.geofabrik.de/
Es gibt auch eine Datenbank, die Overpass API (API = Application Programming Interface). Mit dieser können auch einzelne Daten abgerufen werden (im XML-Format). Mehr Informationen gibt’s hier: https://wiki.openstreetmap.org/wiki/Overpass_API
Jetzt habt ihr einmal einen kurzen Einblick in OSM bekommen, beim nächsten Mal geht es endlich ans Kartenbearbeiten!
1 note
·
View note
Text

We have passed 10% of the way to our next open data target! Can you help us get there?
4 notes
·
View notes
Text
Sunday Round Up - 25th of August 2019
amzn_assoc_ad_type = "banner"; amzn_assoc_marketplace = "amazon"; amzn_assoc_region = "US"; amzn_assoc_placement = "assoc_banner_placement_default"; amzn_assoc_campaigns = "amzn_vicc_cloudcam_1017"; amzn_assoc_banner_type = "category"; amzn_assoc_isresponsive = "true"; amzn_assoc_banner_id = "1J0CHGJT75D586M66602"; amzn_assoc_tracking_id = "kraljevicn1-20"; amzn_assoc_linkid = "c122cc4768b349b4aab7d3099b74ea1c";
Sunday Round up for this week!
Articles:
Im publishing an infosec book
Open Finance First, Open Data Second – AVC
Dr.Semu - Malware Detection and Classification Tool Based on Dynamic Behavior
Using WebThings Gateway notifications as a warning system for your home – Mozilla Hacks : the Web developer blog
Analysis of King Ouroboros Ransomware
If you found some other interesting stuff this week feel free to leave a link to it in the comments section. Otherwise feel free to check out the last roundup here.
These round ups are brought to you by PassVult.
#PassVult#publishing a book#infosec book#random fiber router#Open Finance#Open data#Dr.Semu#malware detection and classification#dynamic behaviour#webthings#notifications#for your home#mozilla hacks#king ouroboros#ransomware#analysis
2 notes
·
View notes