#Raster Data
Explore tagged Tumblr posts
Visit Tumblr Blog
Explore Tumblr blogs with no restrictions, modern design and the best experience.
Last Seen Tumblr Blogs


Fun Fact
Tumblr was the first site to host the blog for President Barack Obama in 2011.
Text
ok im back to hating everything. My prof really did NOT do a good job this semester I feel completely unprepared and… I’m aware that what I’m trying to do is so much more complex than what we covered in class but normally I don’t have problems to scale things up like this but I think I severely underestimated the complexity of what I’m trying to model. Lol. god I’m so scared bc a huge part of my research hinges on me figuring this out and I have NO ONE I can ask bc no one works with QGIS on this scale so help me fucking g-d lmaoooo 😭
#I’ll be alright I’ll be ok#I’m just venting#I do know people who work with it but they’re acquaintances and it’ll be weird if I ask for help out of the blue#I WILL ask them but not for this assignment cos it’s due on Wednesday 😂#it’s just a little trial run so I’m ok bc I think I have enough data for that#I’m just gonna do some raster analysis tmrrw bc I’m good at that#and then hopefully he won’t notice that I have no fucking clue how to interpret the spatial lag model lololol#I just don’t fucking understand what my output is tbh#like. 😭 too many variables and they’re so weirdly spatially distributed but I don’t understand where that comes from bc#they should be clustered bc I RECORDED them as clusters myself#is it bc the stupid model doesn’t understand that there’s 5 clusters? and it treats it like they are one giant cluster?#I don’t know! and neither does the fucking internet apparently! 😂#UAGGHHHH ok time to go to bed#shut up Sam
2 notes
·
View notes
Text

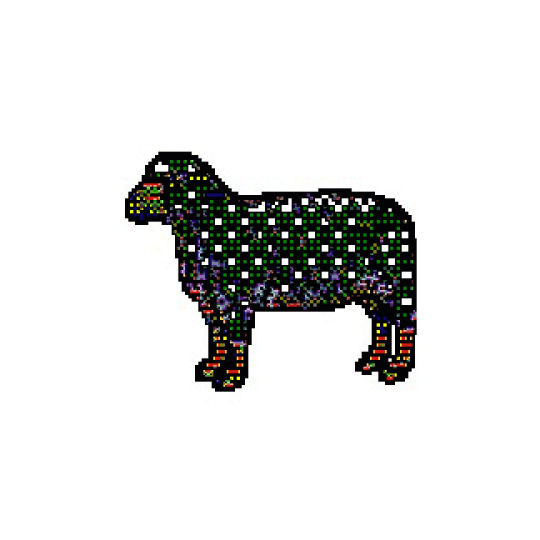
SHEEPT.cdr (CorelDRAW 4 Clip Art - Rasterized preview data plus one glitched Black Sheep, 2025)
#art#pixel art#glitch#sheep#clip art#90s#webcore#aesthetic#black sheep#digital art#coreldraw#glitchcore#glitch art
159 notes
·
View notes
Text
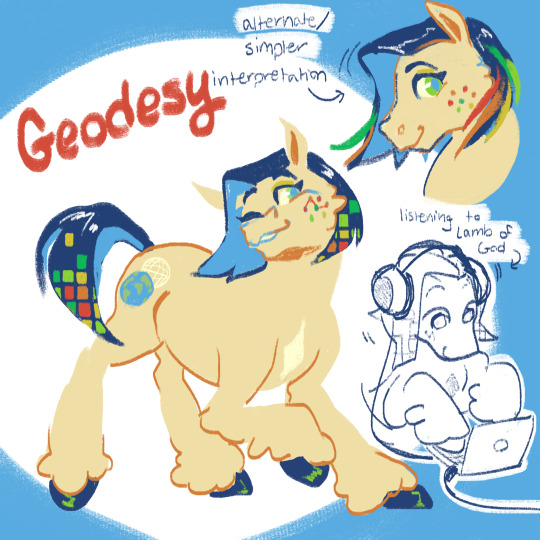
[Image Description: Digital art of a My Little Pony Original Character named Geodesy. She is pale yellow with dark blue hair, light blue pupils, and green irises. Her cutie mark is a simple drawing of Earth, with a network of latitudes and longitudes behind it. The tips of her hair are colored with a gradient of red to green squares. She has rainbow freckles, with a line connecting 3 of them. In the top right there is an alternative design: she has freckles with no line, and her hair is tipped with colors from red to green. In the bottom right, there is a colorless doodle of Geodesy on a laptop with headphones on, and an arrow pointing to her that reads "listening to Lamb of God." End ID.]
Sooo i made this pony earlier this year but never posted her because she's kind of niche?? I went to school for geography and I'm a GIS analyst, so ive been itching to make a pony about it and here she is! Her hair references raster data and her freckles reference points and lines in vector data.
She likes open software, metal, and weird old maps!
#mlp#my little pony#mlp oc#my little pony oc#earth pony#original character#ocs#my ocs#oc: geodesy#digital art#fanart
635 notes
·
View notes
Text

No idea if this person follows me BUT while the industry standard for GIS software (ArcGIS pro) is incredibly expensive, there are open source alternatives like QGIS. A lot of governments and organizations also have open data portals that you can grab data from (shapefiles, CSVs, rasters, whatever).
I've kind of been taught ground-up in person so I don't have recommendations on video tutorials for teaching basic concepts sadly. Bolstadt GIS fundamentals is good and was dirt cheap by textbook standards though (was like $40 iirc).
"Learning GIS" I guess also depends on what you want to do with it? If you want to mess around with cartography and data visualization you could probably just give yourself some pet projects.
#of course i would never. never pirate a textbook. cough.#i like highlighting while reading though so im happy i bought a physical copy of that one specifically#iirc open source GIS software also requires you to lean on SQL and python a little more. though i could be wrong#not art
30 notes
·
View notes
Text


Once I had enough high-resolution climate data to work with, the final part of the Climate phase was the creation of maps with discrete climate zones, which I produced in both the Trewartha classification scheme, left, and the Köppen classification scheme, right.

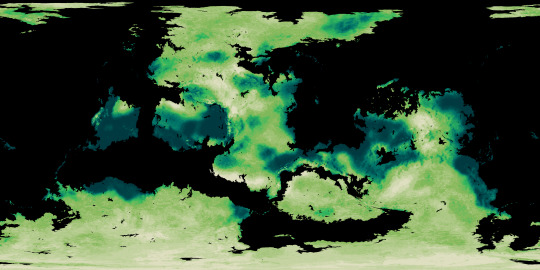

The final phase of the Ayrum mapmaking project was to create realistic satellite style maps, which began with mapping out soil colors and the ground cover of vegetation generally and tree-analogues specifically.
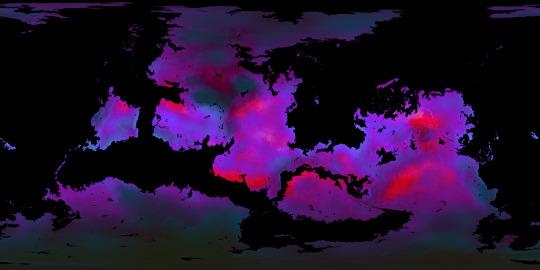
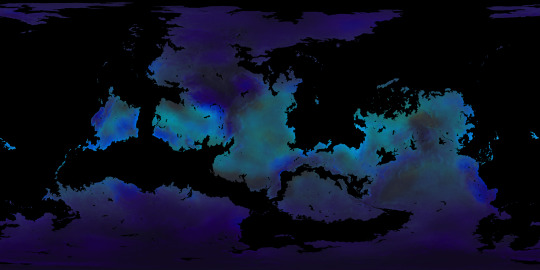
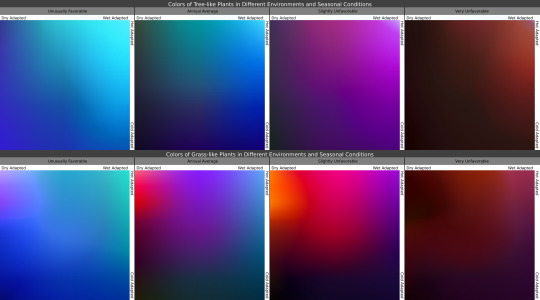
Once I knew where the plants belonged, I then determined what colors they'd be in the conditions they're adapted for, as seen in the maps, and under seasonal variation, with the chart showing how plants with certain adaptations react to seasonal changes in those conditions.

In these gifs we see the ground plants and tree canopies changing colors as the Solstices and Equinoxes expose them to greater or lesser rainfall and harsher or milder temperatures than what they're adapted for. Neither of these gifs provide a true image of what the surface looks like from space, but rather of the in-person appearance of whatever plants may be present.

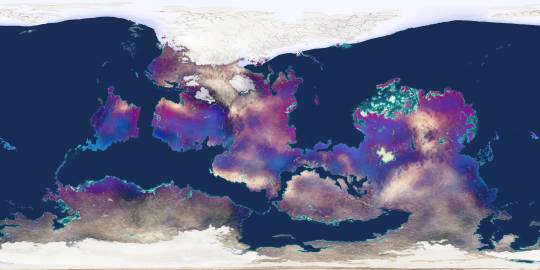
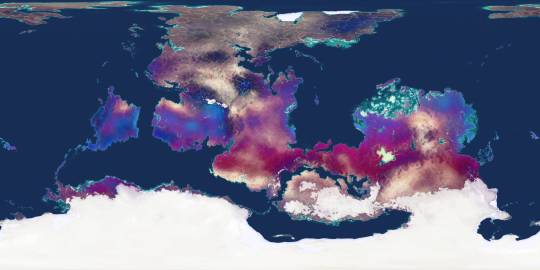
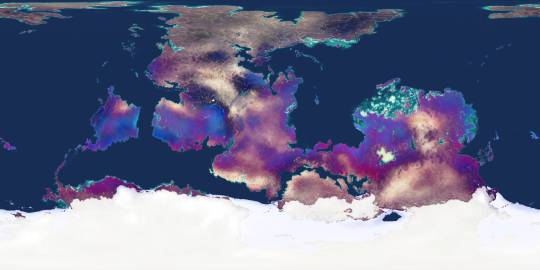
Finally, using the vegetation density maps as raster masks for the seasonal plant color maps, and layering those with the snow-and-ice maps over the soil color map, we now have a much truer image of Ayrum's surface as of its (Northern) Winter, Spring, Summer, and Autumn months.
#Ayrum#mapmaking#digital painting#imaginary maps#imaginary climate zone maps#Trewartha climate scheme#Koppen climage scheme#worldbuilding#commission#major project#seasonal data sequence#imaginary soil color maps#imaginary vegetation maps#vegetation extent#vegetation color#satellite-style maps#Photopea#Christopher Maida Artwork
54 notes
·
View notes
Video
youtube
Raster effect is a a mediating and distancing lens on these kinds of formative visual influences on my imagination. British style magazines and the 1990s blending of beauty, sleaze, music , art, and fantasy fired my imagination in my 20s before going back to school to study art. As I now work with AI/ML I keep thinking about data sets. Besides the seeds planted by that media I also think about another decade and a half absorbing and scanning images on sites like Tumblr, Instagram and now Are.na. I want to turn these materials into something else. Programming with #processing has something to do with that project. And writing, and thinking, and feeling, and stumbling through life with big feelings has something to do with that project. I may start adding voiceovers soon. I really am happy with this material......I think it is leading me somewhere.
3 notes
·
View notes
Text
forever frustrated by how often art programs seem to actively strive to keep the actual underlying numbers from you.
like, when working with a vector shape, why isn't it standard to directly expose the list of vertex points, their coordinates and various other parameters such as bezier curve and whatnot? Sure, they give you points and handles to drag around with a mouse or whatever, but what about the numbers? They're all inevitably part of a numeric coordinate system under the hood, so why why do these programs put in so much effort to keep us from accessing them?
This goes for all kinds of art programs too, whether raster art trying to put walls between you and direct pixel-by-pixel editing, vector programs not wanting you to access lines and vertices by their coordinate numbers, or 3D programs doing near everything they can to obfuscate a majority of the data involved from the user. Polygonal 3D graphics programs tend to be the absolute worst in this by far!
Thing is, the vast majority of all data involved in polygonal 3D graphics exist either in the vertices, or the textures, tied together by a list of which vertices to tie together with edges in order to draw polygons. Like UVW mapping, object shading and smoothing groups, vertex colors, lighting and transparency, weight painting, morph/shape transformations, ALL of that is just vertex data - it's just coordinate numbers attached to the vertices. Yet getting the programs to present you with those numbers can be an absolute chore - getting them to let you modify those numbers directly is often harder still. I cannot for the life of me understand this utter fear of letting users access the underlying number data: that data inevitably exists within the program - it wouldn't be able to show the objects to you if that data wasn't present, so why so insistent on keeping it from us?
As someone who has motor control issues pertaining to precise mouse handling but can handle a numpad just fine, it frustrates me to no end.
7 notes
·
View notes
Text
@bells-of-black-sunday // Let me give yall some digi's
Now, with Digi they evolve like poke and have Stages/Levels corresponding to their power and age. Here's the link if you wanna take a peek. Shit can get wild due to the fact that every digi is made up of data from the internet. Your little buddy has the ability to turn into anything and everything off the web. How you bond, treat and train with it, having the most effect on its growth. So with all that out of the way, I got torn between these two.
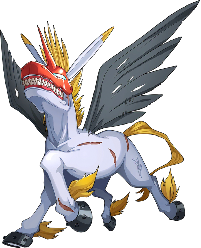
Unimon has both the horn of the Unicorn, the legendary holy beast, and the wings of the Pegasus. With the gigantic wings growing from its back, it instantly runs about the world of the Computer Network, stabbing enemies with the sharp horn extending from its brow. A wild Unimon has a rough temperament like a restive horse, but once tamed, it can be handled as if it were the tamer's own limbs. Its Special Move is a Qigong shot spewed from its gigantic mouth (Holy Shot).
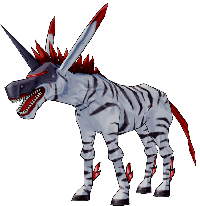
Next is Shima Unimon! A subspecies of Unimon that has stripes all over its body. Because the data of the Unicorn is more highly expressed in its body, it lacks the wings of the Pegasus. For that reason, it is unable to fly in the air, but it races across the land with its powerful legs. Also, its Unicorn horn is sharper than Unimon's, and its lethal potential has increased. Its Special Move is spewing a shock wave from its gigantic mouth (Raster Shot).
Now, why did I give Tar two unicorns that are prone to running around and just…stabbing others? Although both are powerful, they usually serve under another in order to reach their full potential. Even though they tend to roam alone, they can form small groups to roam and train with. Well, what they can turn into also nudged me. Unimon can evolve into a handful of things depending on how you raise/train it. Which include, but not limited to: An angel woman, a living bomb w arms, a giant armored horse, and the world's most insufferable horse
Meanwhile, Shima can turn into Cyborg dragon(they both can), Zombie Dragon, Pixie Panic, Fuck it we ball x3
They both have the ability to turn into Knight/Dark Knights once they reach a 'Perfect/Older' form; which are known to take justice into their own hands and break against the law/system set up by a higher power. So... all in one package?
#nothing but static ∞ ooc#Was also gonna give him something dog/wolf related but then i remembered your horse post#And went 'yeah This is Nice'#Hope this is okay despite my ramblings?
2 notes
·
View notes
Note
do you have any raw .drw files? how does its file size compare to a vector image / raster image of the same size / similar content? like ik vector files can be very small compared to a jpeg... storing timing info sounds simple to implement, but i wonder if it bloats up .drw file sizes?
Oooh, good question, and my answer uhh... got a little out of hand..
Here's the files in the folder for one of my drawings on the windows beta:

So we have the .drw file, the .sim file, a .csv file (this stores text data for my added title and description), and a .png and .sim for the thumbnail.
The .sim file is new to me, but looking at other files I believe the .sim files holds the individual layer data. Maybe the .sim stores the actual image data for display during drawing?
For example, heres the files for my haunter painting:

And here are the layers for the drawing in game (software?):

The sizes match up pretty well with the actual data on each layer!
(I should mention here that looking at file types and figuring out how they work is completely new to me so I could be getting some things wrong. I'm debating if I should reach out to the dev directly to check my work before starting this essay proper... but it's also been fun for me and my brain to try and figure this stuff out on my own)
Actually.. the sim files made me curious... if the main data is in the .drw file, what would happen if I delete the .sim files? Would the file still work?

First off, the thumbnail does not load, but the file still opens fine and the replay function still works.

And we still got all the layers no problem.

Hmm, if I save changes to the images, will it create .sim files?


It did! Huh!
Then uhh.. I don't really know what the .sim files do. If has something to do with display in game which is why the thumbnail didn't display. But I don't know where the layer files would be displaying if it's all based on the .drw. Maybe it's for file conversion? For uploading to the gallery? I don't know...
Anyways... back to the topic at hand, files sizes! The windows beta lets you export files as layered .psd files, .png files, and partial replay in uncompressed and compressed .avi!
So a quick reminder, here are the file sizes of the original image set up for Colors Live:

The .drw is pretty small!!
And here are my exports!:

The .drw is MINUSCULE compared to the .psd. And the .sim size falls between the two sizes of .png. Hmm, still don't know what's going on with that. Also for fun we can look at the size of an uncompressed two minute long .avi looks like. 4 million kilobytes, yay ^_^
Vector wise.. I'm actually not super familiar with vector programs (should probably brush up on them for this essay, huh?) so I'm not sure what exactly is comparable... I've had to use Illustrator this semester but I feel like Colors and Illustrator are approaching vector graphics in a very different way. Illustrator is saving data for vector objects, but Colors is saving data for brush strokes!
Well.. anyway we can open up one of my projects:

And we can stretch that layers panel all the way out so you can see all my layers and paths and objects:

And let's check the file size...

Yep! Pretty small!
For fun we can also convert that .psd I made into a .ai..

Yep! It's smaller!
Regarding file bloat... I think the devs did a fantastic job creating such a small file size and it's perfect for drawing on game consoles that usually have very limited space! However, my experience with Colors! 3D as a kid did have issues with file sizes.. Colors! was the biggest app on my 3DS and I constantly had to juggle uninstalling games and uploading and deleting paintings so I would have more room for new paintings. I did have quite a number of painting files... in various states of progress (as is typical) but storage space was a real issue for me. Now, were my SD cards only 2 or 4 gb big? Yes. Did I understand at the time that those were quite small for SD cards, even at the time? No. Does my experience mean anything then? I don't know.
Colors! 3D also had an issue were particularly lengthy paintings (were talking hitting the ~4 hour mark) would stop saving replay data. The replay would only play up until a certain point. I'm not sure why that is, based on what we know about .drw files I don't think it can be a limitation with the file type? That's kinda all it does? Maybe it's a limitation with the size of the 3DS memory that couldn't play the replays that long? Hitting that ~4 hour mark would also limit the amount of undos you were able to do so it could easily have to do with memory.
(Bit off tangent but undos take soooo long in Colors. And the more undos you do the longer they take! Colors didn't official start limiting the players undos until that ~4 hour mark but they were already limited by your patience)
Anyways, I will leave you with this, a link to the documentation of the .drw file format. It's only two and half pages long which I think is pretty short? Maybe you can find more info in there that what I can parse...
2 notes
·
View notes
Text
Mobile Game design overview
A personal Journal Entry and pre-development path.
R&D Still Required based on style of game; touch screen and gyro controls. --preliminary research complete.
Design Overview;
Other Mobile games, no matter how well designed, have extremely cluttered interfaces. Some of this is because there are multiple games, mini-games, and events packaged into the game at any one time.
Some games have an coin based (energy use) version of their main game, and a sub-game that does not require energy.
Consider using this style for offline and online modes. It seems popular to use energy for the online. Portion, this way the player can enjoy the game as they wish without overloading the servers offline.
Other games have several Quest, Achievement, and Event menus that can be consolidated into a single main menu.
The reason they don't do this is still unclear to me; but is probably similar to the big flashy tags and sales sign at in-person retailers, and in the Sears magazine.
If so, they don't serve the purpose they're intended to.
However; it's probably more that the development team is inexperienced and using a framework or game template that they then reuse for added areas. Creating a package which is a copy of the template over and over again.
I had previously considered implementing an old-style arcade "life" system like Mario, but perhaps a more simplified energy system, perhaps one that tracks step through the accelerometer (or other apps) to refresh would be good.
Energy refreshments shouldn't be purchaseables except for in specific circumstances; Similar to Hearthstone's Arena Tavern Brawls that happen periodically.
Players seem to enjoy "Season Packs" to purchase, and dislike an RMT (Real-money Trade) currency.
It also reduces clutter and increases understandability by reducing the options that a player has for a single game.
"Gacha Summons" shouldn't be purchaseables. meaning Gacha, or loot boxes, if used should be separated from the RMT purchase portion.
Rewards for skill shown in the online portion should be considered and given to players that perform well in whatever the online portion might be
Minor connectivity for offline achievements should be included for verification, but more or less separated from the online game entirely.
Some specific achievements may reward Skins and other abilities for the online portion.
A small game studio shouldn't really go whale fishing like happens in many games today. (Packs valued by studios worth $100+ are common and give little. Seems more like a wishful thinking menu item)
Entry into a crypto-based achievement system, whichever company is able to make a stable one; is key in future development. Releasing of items and achievements into a startup ecosystem will help the game to grow.
Without going into depth on any specific game mechanics; this covers everything about the interface design research.
The question still remains how to address monetization and store based items. Aside from releasing things into a gaming ecosystem where they can be displayed and reused in other places; I'm not sure what to sell.
Gacha games are a dime a dozen and have seemingly all the same pricing scheme. Without a reason to have seasons, theres no reason a player might want to purchase one.
Here's what I think;
Hosting Price and monthly expenses need to be taken into account, but $1-10 depending on what % the hosting service might take, for a "Premium Account" badge, either a one-time, yearly or monthly seems key.
Re-curring costs may be implemented for "seasonal" reasons based on when the majority of players tend to be actively interacting with the game.
Lastly; Data needs to be reduced to a minimum. Part of these sizes are voiced lines, raster graphics for the dozens of different menus, CGI cutscenes, and music.
All of this will help to make a game that will be able to make it into anybody's pocket.
3 notes
·
View notes
Note
I am begging you to infodump about RDP hardware bugs
okay so full disclosure i'm not super studied on the hardware in excruciating detail-- I wish I could be, but that's all a bit out of my league! So what I know is largely limited to the snags I've personally walked into when messing around with libdragon, a free and open source library that's largely intended to help you sidestep a lot of these hardware bugs and odd quirks. so with that disclosure out of the way! The RDP is the Reality Display processor, a rasterizing unit that takes triangle data processed by the RSP (Reality Signal Processor) and fills in pixels to push to the framebuffer. So it's responsible for rendering most of the actual image you're seeing on the screen. Along with the high-latency RDRAM, the rather slow RDP is much bemoaned as one of the primary bottlenecks for performance. Tri count ain't the killer on N64, nah it is fillrate and memory access. The particular component I've dealt with more in detail is the Color Combiner, or CC. It's a fixed function pipeline that can be configured with various sources to determine the color of a triangle. These sources can include 2 texture slots, vertex color, primitive/environment color (explicitly defined color registers), the result of the first CC cycle (if configured to 2-cycle mode), and so on. It has quite a few quirks to it!! For starters, clamping is... kind of broken? values for the RGB and Alpha components are intended to be clamped between 0 and 255, but this only sort of works. Anything up until 383 is correctly clamped down to 255, but go above this (up to 511) and it actually wraps back around to 0. This makes any additive operations tricky to pull off, as you can quickly wind up with overflow that appears unintentionally dark. In 2-cycle mode, TEX0 actually refers to TEX1, and TEX1 refers to the next pixel of TEX0. This introduces more unintended visual nonsense so you've gotta be careful how you're storing and recalling your textures. By far the worst thing I've run into concerns sign-extension. The fixed formula for the CC is as follows:
(A - B) * C + D
Slots A, B, and D all have a special 9-bit sign extension for arithmetic, whereas slot C does not. Why? Who knows! This makes slot C more prone to overflow/underflow, and of fucking course it's in the multiplication slot!! If you're using 2-cycle mode, then you really want to avoid using the result of cycle 1 in slot C of cycle 2, as it's much easier for wacky nonsense to occur.
This was something I ran into when configuring my first custom CC setup! Left is intended, right was my initial result with COMB in slot C of cycle 2. The idea was to take a black and white intensity texture, use vertex color for white, and multiply that by a chosen primitive color for black. This quirk was a pain in the ass to discover!! But luckily it was trivial to fix given what I was going for. You might not always be so lucky tho!! :D Anyway that's most of what I've got, but there's a lot more quirkiness with the RDP that's documented over on N64brew, v v good resource. The N64 is a pain in the ass to work with, but I love this stupid console so much I will go thru hell just to make things on it but uhhhh yeah thanks for listening to the dump!! btw i've yet to find someone that can beat me at diddy kong racing. i have a reward for u if u can manage to pull it off tho. it's a secret, but for listening to me infodump lemme let u in on a little secret: the reward is kissing u. with tongue
6 notes
·
View notes
Text
Vector Image File Formats
Unlock the magic of vector image file formats! 🎨 Dive into the world of precision and scalability with our latest Code Highlights session. 🚀 Discover the secrets behind crisp graphics and efficient storage. 🌐 Ready to elevate your coding game?
+91-81485-51615
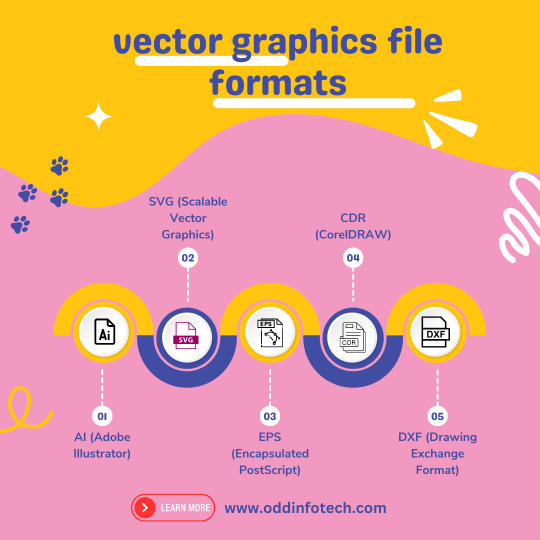
Vector image file formats are graphics file formats that store images as mathematical equations or geometric shapes, rather than a grid of pixels like raster image formats. This allows vector images to be scaled to any size without losing quality. Here are some common vector image file formats:
SVG (Scalable Vector Graphics): SVG is an XML-based vector image format that is widely used for web graphics. It is an open standard that can be easily edited with a text editor.
EPS (Encapsulated PostScript): EPS is a file format that can contain both vector and raster graphics. It is often used for print design and is compatible with various graphic design software.
AI (Adobe Illustrator): AI is the native file format of Adobe Illustrator, a popular vector graphics editor. AI files can store both vector and raster data and are primarily used for editing within Illustrator.
PDF (Portable Document Format): PDF is a versatile file format that can store both vector and raster graphics. It is widely used for documents and presentations and can be opened with various software applications.
CDR (CorelDRAW): CDR is the native file format of CorelDRAW, another vector graphics editor. It is used for saving designs and illustrations created in CorelDRAW.
DXF (Drawing Exchange Format): DXF is a file format developed by Autodesk and is commonly used for exchanging vector graphics between different CAD (Computer-Aided Design) applications.
WMF (Windows Metafile): WMF is a vector graphics format used by Microsoft Windows applications.
2 notes
·
View notes
Text
I get why PDFs are so popular. They can be read basically anywhere, they allow form fills, the can be loaded with image and text layers, a mix of rasterized and vectorized data, they can support search, in document links, ect. Unrelated, but they are a nightmare complication of XML so unabashedly unloved that there are only two main PHP libraries for navigating them.
But it's also really maddening the number of comic book houses that put out PDF copies of their work that are just image files in a pdf wrapper.
It's really obvious when you're someone ridiculous enough to convert them into an image archive format and notice that a poorly made PDF is often 1/10th the size as a CBZ, but a well made PDF is 10x the size as a CBZ.
That's kind of how rasterizing vector formats is supposed to work out. Bigger files with less ability to zoom. If I can minimize the file with a combination of PNG and ZIP compression, you've done something very wrong.
But to add to this, is that a PDF full of PNG or other lossless format comic panels SHOULD compress super well, it's a waste of the format, but it should. But if you then shove it full of low quality jpegs, then the PNG can't really compress the color data and you get a ballooned file.
It's just a whole thing. Basically, you can't predict how big a CBZ of a PDF is going to be. If it's a relative small pdf full of layers and text, it will probably be big. If it's a comic who knows!
2 notes
·
View notes
Text
Top Tools for Creating High-Impact 3D Map Illustrations in Architecture

Mastering the Landscape: Top Tools for Creating High-Impact 3D Map Illustrations in Architecture
In the dynamic world of architecture and urban planning, communication is key. Whether you're pitching a master plan, showcasing a new development, or explaining complex infrastructure, conveying spatial relationships and contextual nuances is paramount. While traditional 2D maps provide basic information, they often fall short in capturing the imagination or truly illustrating the depth and impact of a project within its environment. This is where high-impact 3D Map Illustration steps in, transforming flat data into compelling, easily digestible, and aesthetically rich visual narratives.
This blog will explore the leading software and workflows that empower designers to create high-impact 3D Map Illustration for architectural projects, ensuring their visions are understood and embraced.
The Power of 3D Map Illustration in Architectural Communication
Before diving into the tools, it's essential to understand why 3D Map Illustration is so vital in architecture:
Holistic Understanding:
It provides a bird's-eye view of a project within its entire context, including existing buildings, topography, and proposed developments. This is crucial for large-scale urban planning projects or complex architectural complexes.
Enhanced Clarity:
Complex spatial relationships, pedestrian flows, and vehicular routes become immediately apparent, simplifying otherwise intricate data.
Stakeholder Engagement:
Visuals are universally understood. A powerful 3D Map Illustration can bridge the gap between technical details and public understanding, fostering buy-in from diverse audiences, including investors, city officials, and local communities.
Design Validation:
Architects can use these maps to test and refine their designs in a real-world context, identifying potential issues or opportunities before construction.
Foundation of Precision: 3D Vector Maps Software
The bedrock of any high-impact 3D Map Illustration is accurate, scalable geographic data, best handled by software that generates 3D Vector Maps. Unlike raster images, vector data can be scaled infinitely without losing quality, making it ideal for maps that need to be viewed at various zoom levels.
Here are the top tools for creating and working with 3D Vector Maps:
GIS Software (e.g., ArcGIS Pro, QGIS):
Geographic Information Systems are the gold standard for handling spatial data. They allow architects to import real-world topographical data (like LiDAR point clouds or DEMs), aerial imagery, and existing building footprints. GIS software can then process this data to create accurate 2D and 3D base maps. While not directly creating the artistic render, they provide the precise foundation of the 3D Vector Maps from which the illustration will emerge. QGIS is a powerful open-source alternative, making professional-grade 3D Vector Maps accessible.
CAD Software (e.g., AutoCAD, MicroStation):
These can be used to generate precise 2D and 3D building outlines, roads, and landscape elements, which can then be imported into more specialized 3D modeling environments. While primarily used for technical drawings, their precision is vital for the accuracy of 3D Vector Maps in an architectural context.
Vector Graphics Software (e.g., Adobe Illustrator, Affinity Designer):
While not inherently 3D, these tools are invaluable for refining the 2D elements that often form part of 3D Vector Maps. They can be used to create clean lines, labels, icons, and legends that enhance the clarity and aesthetic appeal of the final 3D Map Illustration.
Sculpting the Vision: Architecture Illustration Tools
Once the precise 3D Vector Maps are established, the next step involves bringing the architectural elements to life with artistic flair and realism. This is where dedicated 3D modeling and rendering software, often used for Architecture Illustration, plays a crucial role.
Here are the leading tools for crafting detailed Architecture Illustration:
Autodesk Revit / ArchiCAD (BIM Software):
Building Information Modeling (BIM) software is increasingly becoming the starting point for architectural projects. Revit and ArchiCAD allow architects to create intelligent 3D models of their buildings, complete with material information and structural data. These models can then be directly exported or linked to rendering engines to create the core of the Architecture Illustration. Their ability to manage complex building data makes them ideal for ensuring accuracy in the Architecture Illustration embedded within the 3D Map Illustration.
Trimble SketchUp:
Known for its user-friendliness and intuitive interface, SketchUp is excellent for quick 3D massing studies, conceptual design, and creating detailed architectural components. While it may require plugins for advanced rendering, its ease of use makes it a popular choice for rapidly prototyping the architectural elements that will populate the 3D Map Illustration.
Blender:
This Cycles and Eevee render engines can produce stunning photorealistic results, making it a highly versatile tool for creating every aspect of a detailed Architecture Illustration. The active community and constant development make Blender an increasingly popular choice for professional Architecture Illustration.
Autodesk 3ds Max / Maya:
These are industry-standard 3D software packages renowned for their advanced modeling, animation, and rendering capabilities. They offer unparalleled control over scene setup, lighting, and material creation, making them ideal for producing the highest quality photorealistic Architecture Illustration for complex projects and large-scale 3D Map Illustration. Their extensive feature sets allow for meticulous detail and artistic expression.
Bringing it All Together: Rendering and Compositing for High-Impact 3D Map Illustration
The final step in creating a high-impact 3D Map Illustration involves bringing together the precise 3D Vector Maps and the detailed Architecture Illustration elements, then rendering them with compelling lighting and post-production effects.
Key rendering and compositing tools include:
V-Ray / Corona Renderer
These are highly regarded photorealistic rendering engines that integrate with various 3D modeling software. They offer advanced lighting, material, and camera controls, allowing artists to achieve stunning realism, depth, and atmosphere in their 3D Map Illustration.
Twinmotion / Lumion (Real-time Renderers):
These tools are gaining immense popularity due to their speed and ease of use. While perhaps not reaching the absolute pinnacle of photorealism as offline renderers, they produce excellent results quickly and are fantastic for iterating on the overall look and feel of the 3D Map Illustration or creating short animations.
Adobe Photoshop / Affinity Photo (Image Editing/Compositing):
After rendering, post-production is crucial for refining the final 3D Map Illustration. These image editing software packages allow artists to adjust colors, contrast, add atmospheric effects (like fog or haze), integrate labels, legends, and other graphic elements, and even subtly enhance certain details to make the Architecture Illustration truly pop within the overall map.
Conclusion
Creating high-impact 3D Map Illustration in architecture is a multidisciplinary art form that blends technical precision with artistic vision. By leveraging the power of software that generates accurate 3D Vector Maps, sculpts detailed Architecture Illustration, and refines the final image through advanced rendering and compositing, architects and visualization transform urban plans into easy-to-understand visual narratives.
0 notes
Text
to Supercharge Your Browsing Google Chrome is one of the most widely used web browsers, constantly updated with new features and improvements. But did you no Chrome also includes hidden experimental features known as “flags”? These experimental flags offer powerful ways to customize your browsing experiance, enhance performance, and try out upcoming technologies before they become mainstream.In this guide, we’ll walk you through what Chrome flags are, how to safely enable them, and provide practical tips to help you get the most out of these hidden gems. Materials and Tools Needed Material/ToolDescriptionGoogle Chrome BrowserLatest stable version of Chrome installed on your Windows,macOS,Linux,or Chrome OS device.Internet ConnectionRequired for downloading Chrome updates and researching flags.Basic Computer KnowledgeComfort with navigating browser menus and entering URLs. What Are Chrome Flags? Chrome flags are experimental features built into the browser but not enabled by default. they function as testing grounds for new ideas and functions that Google might integrate into the public version later. Flags let users explore cutting-edge options such as enhanced security measures, advanced visual designs, improved tab management, or network optimizations. Because flags are experimental, they may sometimes cause instability or unexpected behavior. It is indeed essential to use them cautiously and discontinue use if you experience issues. Step-by-Step guide: How to Enable and Use Chrome Flags Step 1: Open the Chrome Flags Page Launch your Google Chrome browser. In the address bar,type chrome://flags and press Enter. This will open the Chrome flags experimental features page, displaying a long list of available flags. Step 2: Search for specific Flags Use the search bar at the top of the page to find a specific flag by keyword (e.g., "dark mode", "tab groups", "GPU rasterization"). Alternatively, scroll through the list to explore flags you might find interesting. Step 3: Enable a Chrome flag Click the dropdown menu next to the flag you want to enable. Select Enabled from the dropdown options. Some flags have additional options such as different experimental modes – choose the one you want. Step 4: Relaunch Chrome After enabling the desired flags, a prompt will appear at the bottom with a Relaunch button. Click Relaunch to restart the browser and apply the changes. Step 5: Test the Enabled Features After relaunch, verify the new functionality or behavior enabled by the flags. If the flags cause issues, return to chrome://flags to disable them (choose Default from the dropdown), then relaunch Chrome again. Tips for Using Chrome Flags Safely and Effectively Backup important data: If you rely on Chrome for critical work, back up bookmarks and passwords before enabling multiple flags. Enable one flag at a time: This helps isolate issues caused by experimental features. Check flag status regularly: Flags may move into mainstream Chrome or be deprecated over time. Restart your browser often: some flags require multiple restarts or only initialize after relaunch. Stay updated: Regularly update Chrome to avoid incompatibility with experimental features. Popular Chrome Flags Worth Trying Flag NameDescriptionStatusDark Mode (force-dark-mode)forces dark mode on web contents for a comfortable night browsing experience.Frequently enough enabledTab Groups (tab-groups)Organize tabs into visually distinct groups for better multitasking.Stable feature in recent versionsGPU Rasterization (enable-gpu-rasterization)Enhances page rendering performance using the GPU.ExperimentalParallel Downloading (enable-parallel-downloading)Speeds up file downloads by splitting them into parallel tasks.Popular with power users frequently Asked Questions (FAQs) about Chrome Flags
Is it safe to use Chrome Flags? Generally yes, but as flags are experimental, they can cause browser crashes or glitches. Enable them cautiously and revert any changes if issues arise. Can I lose my browsing data by enabling flags? Enabling flags does not typically erase data, but unexpected browser behavior might cause temporary issues. Always back up important data regularly. Do Flags work on all devices? Most flags are available across desktop platforms (Windows, macOS, Linux), but support on mobile Chrome is limited or experimental. Conclusion Chrome’s experimental features or flags open exciting possibilities to customize and optimize your browsing experience. Whether you’re a GitHub dev looking to test developer tools or a casual user wanting faster downloads and better visuals, flags give you early access to powerful browser tweaks. Remember to enable flags one at a time,stay cautious with stability,and keep your browser updated.Try exploring chrome://flags today and unlock hidden Chrome power!
0 notes
Text
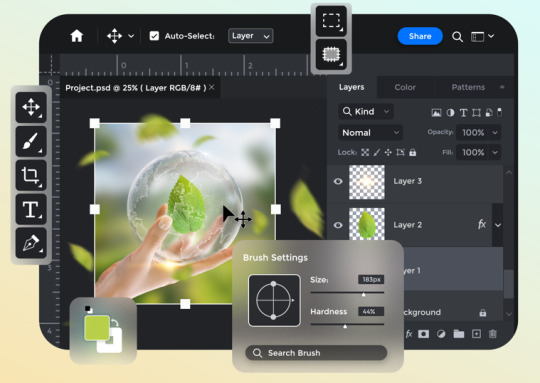
Understanding Rasterization in Photoshop: Transforming Vector Graphics into Pixel Art
Rasterization in Photoshop: Common Queries Answered
1. What is rasterization in Photoshop, and how does it differ from vector graphics?
Rasterization in Photoshop converts vector graphics, which are made of paths, into raster images composed of pixels. This process can lead to loss of scalability and detail when resizing. In contrast, vector graphics remain sharp and clear at any size since they are based on mathematical equations rather than pixel data. Raster images are best for detailed, textured visuals.
2. When should you rasterize a layer in Photoshop, and what are the potential consequences of doing so?
Rasterize a layer in Photoshop when you need to apply certain effects or transformations that can't be used on vector or text layers. However, rasterizing loses the ability to edit the layer's original properties (like text editing) and can result in a loss of quality if scaled up. Always keep a backup of the original layer.
3. How can you rasterize a text layer in Photoshop, and what options do you have for preserving the original text?
To rasterize a text layer in Photoshop, right-click the text layer in the Layers panel and select "Rasterize Type." To preserve the original text, duplicate the text layer before rasterizing it. You can also convert it to a smart object first, which allows for non-destructive editing and can be rasterized later if needed.
4. What are some common scenarios where rasterizing an image or layer is necessary, and what tools or techniques can be used afterward?
Rasterizing an image or layer is necessary when applying filters, effects, or when exporting for specific formats. It’s essential for combining vector elements with raster graphics. Tools like Photoshop’s “Rasterize Layer” option, or using "Merge Layers" can be helpful. After rasterizing, you can use brushes, selection tools, and various editing techniques to modify the image.
5. Can you explain the impact of rasterization on image quality and file size in Photoshop, and how can you mitigate any negative effects?
Rasterization converts vector graphics to pixels, which can reduce image quality if scaled up, leading to blurriness. File size may increase depending on resolution. To mitigate negative effects, maintain original vector files, use high resolutions for raster images, and consider lossless formats. Always save a copy of the original vector artwork for future edits.
Visit: VS Website See: VS Portfolio
0 notes