#Subsurface Modeling
Explore tagged Tumblr posts
Visit Tumblr Blog
Explore Tumblr blogs with no restrictions, modern design and the best experience.
Last Seen Tumblr Blogs


Fun Fact
Tumblr has 4 main sources of revenue.
Text
Software for Modeling, Analysis & Visualization | GeomageGeological

Geomage offers advanced software solutions for geological modeling, analysis, and visualization. It provides tools for creating detailed 3D models of subsurface environments, analyzing geological data, and visualizing complex geological structures. Designed for professionals in mineral exploration, geotechnical engineering, and environmental science, Geomage integrates various data sources for accurate, efficient, and insightful geological interpretation.
1 note
·
View note
Text


hey did i mention i like subsurface scattering
#I LOVE OT I LIVE IT I LOEV IT#AGDHDHBEKRHRKFJFN#subsurface scattering#art#digital art#3d modelling#light#< tagging this because i am so very grateful for its existence#without it we would have no subsurface scattering#what a sad sad world that would be
1 note
·
View note
Text

A Child's Bedroom
#my art#3d modeling#blender3d#don't ask why I put subsurface scattering on the bookshelf I was just having fun#it looks delicious and I want to eat it
0 notes
Text
subsurface scattering on lowpoly models looks really nice . they look like gelatin
5K notes
·
View notes
Note
Love your art! What's your shading process / any tips? I really like how vibrant it is
Thank you!! also sorry this is a long post
I usually start painting the character after I already have a background, super sketchy or with a placeholder (a photo usually), just so i know what colors to use

I fill the character with a color from the BG or a similar color and use the multiply blending mode

then i paint the lights on another layer with the "add glow" blending mode (i also pick the color depending on the bg).
I add another multiply layer for anything that needs to be darker, like stuff under the characters clothes


I paint a line with a saturated color between the lights and shadows, for example i added a bright red for the cape and light purple for their skin (? this is subsurface scattering, it doesnt happen on every surface but i like how it looks so i use it on everything lol.
Then i paint the lineart a similar color to each part of the character or you can paint it all red and use multiply


that's basically it
some tips (these are just things that work for me)
I think is better to paint the lights, not the shadows. it helps to see the shapes of the thing/character you're drawing better (its what i did with lambert ⬆️)
Draw backgrounds, i think it makes every drawing look more interesting and its easier to decide the lighting for the character, if you dont want to draw anything detailed you can paint something simple and blur it
i really recommend to start with a thumbnail, experiment with colors, perspective, composition, etc. before actually starting the drawing thumbnails of this post

this tip is something that everyone has heard before but use references, real life references like photographs for perspective and lighting, 3d models for anatomy and perspective, paintings to see how other artists stylize objects, bgs or characters. use references for everything
this tip is super important for me: check the values of your drawing, (lower the saturation, with the lineart hidden) if it isnt readable/ doesnt look good in black and white it most likely wont look good with colors (this depends on artstyle and personal preference tho)


311 notes
·
View notes
Text
New data from the agency's Jovian orbiter sheds light on the fierce winds and cyclones of the gas giant's northern reaches and volcanic action on its fiery moon. NASA's Juno mission has gathered new findings after peering below Jupiter's cloud-covered atmosphere and the surface of its fiery moon, Io. Not only has the data helped develop a new model to better understand the fast-moving jet stream that encircles Jupiter's cyclone-festooned north pole, it's also revealed for the first time the subsurface temperature profile of Io, providing insights into the moon's inner structure and volcanic activity. Team members presented the findings during a news briefing in Vienna on Tuesday, April 29, at the European Geosciences Union General Assembly.
Continue Reading.
66 notes
·
View notes
Note
Now that it's been out for like a week, have you felt any uncanny valley effects playing newblivion? As incredible as everything looks, the gameplay I've watched (don't have the funds to buy it myself yet) I get those vibes from it and it's jarring
Uncanny Valley? As for the character models, no not at all. Given the specific art direction of the game is think they did a very good job translating the character/NPC art style from the original Oblivion into a "modern" 2025 UE5 game.
The game ups the texture resolution, adds subsurface scattering, etc to all of the character models, but there's still a distinct "unrealistic" design style for most NPCs. Overall they're clearly pursuing a "high fidelity 'unrealistic' style" which doesn't trigger the uncanny valley effect for me personally.


A comparison would be something like Star Wars Rougue One, which DID try very hard to capture realistic looking CGI humans. That triggered the uncanny valley for me big time.


Overall there are definitely elements in Oblivion Remastered where the designers were trying to pursue maximum graphical fidelity, but the overall look and design of the game feels authentic to the Original game's style.
34 notes
·
View notes
Text
for those who are curious explanation is under the cut
its when light passes through translucent or semi-translucent material and scatters within it, causing a kind of internal glow. for instance human skin has it, and its easy to see if you hold a light behind your hand and see that orange glow in your fingers.
its often used in 3d modeling to make things look less flat, and it’s good to know it for illustration purposes even if you weren’t aware of the name
73 notes
·
View notes
Text
Excerpt from this story from Nation of Change:
As the United Nations Ocean Conference opened this week in Nice, France, a major scientific report revealed that one of Earth’s planetary boundaries—ocean acidification—has already been crossed. The findings mark a stark shift from previous assessments and confirm that global marine ecosystems are under far greater threat than previously understood.
The study, published in Global Change Biology and led by researchers from the United Kingdom’s Plymouth Marine Laboratory (PML), the U.S. National Oceanic and Atmospheric Administration (NOAA), and Oregon State University, found that ocean acidification (OA) crossed its critical planetary threshold by the year 2020. In some regions, that boundary was surpassed as early as 2000. The team reached their conclusion using a combination of chemical measurements, biological studies, and advanced modeling techniques.
“OA is the term given to the long-term shift of marine carbonate chemistry resulting primarily from the uptake of carbon dioxide (CO2) by the oceans, leading to an increase in ocean acidity and a decrease in carbonate ion (CO32−) concentration,” the study’s authors wrote. “OA can severely affect marine organisms through its direct impact on physiology, growth, survival and reproduction.”
Ocean acidification results from the absorption of excess atmospheric CO2 by seawater. This chemical shift decreases carbonate ion concentrations—essential for organisms that build shells or skeletons out of calcium carbonate. The process fundamentally threatens coral reefs, shellfish, and plankton species that underpin marine food webs.
The most alarming revelation in the study is the extent to which OA has infiltrated both surface and subsurface waters. By 2020, over 40% of surface ocean waters and as much as 60% of waters down to 200 meters deep had already crossed into the so-called “danger zone” of acidification.
“Looking across different areas of the world, the polar regions show the biggest changes in ocean acidification at the surface. Meanwhile, in deeper waters, the largest changes are happening in areas just outside the poles and in the upwelling regions along the west coast of North America and near the equator,” said Helen Findlay, lead author of the report, professor at Plymouth Marine Laboratory, and chair of the North-East Atlantic Ocean Acidification Hub.
“Most ocean life doesn’t just live at the surface – the waters below are home to many more different types of plants and animals. Since these deeper waters are changing so much, the impacts of ocean acidification could be far worse than we thought. This has huge implications for important underwater ecosystems like tropical and even deep-sea coral reefs that provide essential habitats and nursing refuge for many species, in addition to the impacts being felt on bottom-dwelling creatures like crabs, sea stars, and other shellfish such as mussels and oysters,” Findlay explained.
The implications for biodiversity are already measurable. The study notes that 43 percent of suitable habitat for tropical and subtropical coral reefs has been lost. In polar regions, pteropods—tiny planktonic snails also known as “sea butterflies” and vital to food webs—have lost up to 61 percent of their habitat. Coastal shellfish, including economically vital bivalves like mussels and oysters, have seen a 13 percent decline in suitable habitat globally.
The planetary boundary framework defines nine essential Earth system processes that regulate the stability and resilience of the planet. Crossing these boundaries increases the risk of irreversible environmental change. Ocean acidification now joins climate change, biosphere integrity, and several others as crossed thresholds.
9 notes
·
View notes
Text

Mission Log: VLC-155 Surface Report - Part 4
Recorded by: Dr. Abbat, Lead Astrobiologist
Location: VLC-155 Mid Orbit
We’ve just completed the oceanographic model. Warm currents are shown in red, cool in blue. And there are a lot of both. Currents thread across the planet’s surface like a nervous system. They twist around landmasses, plunge into gyres, and hammer coastlines with life sustaining water. Some flow logically, like the equatorial belts driven by the coriolis effect. But others bend sharply, loop unexpectedly, or sink into cold, subsurface spirals that shouldn’t exist without polar ice caps to drive them. Dr. Maria says the chaotic nature of the currents is expected due to unpredictable turbulence.
According to her, the currents suggest a complex and highly energetic hydrosphere. One that should be distributing heat evenly, fueling vast storm engines across the oceans. Hurricanes. Typhoons. Monsoons. Yet, nothing. We see no mega-storms. No visible water vapor superstructures. Just… clouds. Sparse. Passive. Almost decorative.
I asked Maria how it was possible for so much energy to move across the planet without exploding into chaos. She didn’t answer. Just walked away rubbing her temples. Something's interfering with the planet’s feedback systems. Or stabilizing them. I’m not sure which is more unsettling.
It’s not just me now. Several of us have requested the captain take us into low orbit, maybe even greenlight a landing party. We’ve lived our whole lives seeing a planet showing signs of life. But now it’s pretending to be dead. The question is, Why?
End log.
#speculative biology#speculative ecology#speculative evolution#speculative fiction#speculative worldbuilding#speculative zoology#world building#volucris#writing
10 notes
·
View notes
Text

Possible tectonic activity on Venus
Using archival data from the mission, launched in 1989, researchers have uncovered new evidence that tectonic activity may be deforming the planet’s surface
ast, quasi-circular features on Venus’ surface may reveal that the planet has ongoing tectonics, according to new research based on data gathered more than 30 years ago by NASA’s Magellan mission. On Earth, the planet’s surface is continually renewed by the constant shifting and recycling of massive sections of crust, called tectonic plates, that float atop a viscous interior. Venus doesn’t have tectonic plates, but its surface is still being deformed by molten material from below.
Seeking to better understand the underlying processes driving these deformations, the researchers studied a type of feature called a corona. Ranging in size from dozens to hundreds of miles across, a corona is most often thought to be the location where a plume of hot, buoyant material from the planet’s mantle rises, pushing against the lithosphere above. (The lithosphere includes the planet’s crust and the uppermost part of its mantle.) These structures are usually oval, with a concentric fracture system surrounding them. Hundreds of coronae are known to exist on Venus.
Published in the journal Science Advances, the new study details newly discovered signs of activity at or beneath the surface shaping many of Venus’ coronae, features that may also provide a unique window into Earth’s past. The researchers found the evidence of this tectonic activity within data from NASA’s Magellan mission, which orbited Venus in the 1990s and gathered the most detailed gravity and topography data on the planet currently available.
“Coronae are not found on Earth today; however, they may have existed when our planet was young and before plate tectonics had been established,” said the study’s lead author, Gael Cascioli, assistant research scientist at the University of Maryland, Baltimore County, and NASA’s Goddard Space Flight Center in Greenbelt, Maryland. “By combining gravity and topography data, this research has provided a new and important insight into the possible subsurface processes currently shaping the surface of Venus.”
As members of NASA’s forthcoming VERITAS (Venus Emissivity, Radio science, InSAR, Topography, and Spectroscopy) mission, Cascioli and his team are particularly interested in the high-resolution gravity data the spacecraft will provide. Study coauthor Erwan Mazarico, also at Goddard, will co-lead the VERITAS gravity experiment when the mission launches no earlier than 2031.
Mystery Coronae
Managed by NASA’s Jet Propulsion Laboratory in Southern California, Magellan used its radar system to see through Venus’ thick atmosphere and map the topography of its mountains and plains. Of the geological features the spacecraft mapped, coronae were perhaps the most enigmatic: It wasn’t clear how they formed. In the years since, scientists have found many coronae in locations where the planet’s lithosphere is thin and heat flow is high.
“Coronae are abundant on Venus. They are very large features, and people have proposed different theories over the years as to how they formed,” said coauthor Anna Gülcher, Earth and planetary scientist at the University of Bern in Switzerland. “The most exciting thing for our study is that we can now say there are most likely various and ongoing active processes driving their formation. We believe these same processes may have occurred early in Earth’s history.”
The researchers developed sophisticated 3D geodynamic models that demonstrate various formation scenarios for plume-induced coronae and compared them with the combined gravity and topography data from Magellan. The gravity data proved crucial in helping the researchers detect less dense, hot, and buoyant plumes under the surface — information that couldn’t be discerned from topography data alone. Of the 75 coronae studied, 52 appear to have buoyant mantle material beneath them that is likely driving tectonic processes.
One key process is subduction: On Earth, it happens when the edge of one tectonic plate is driven beneath the adjacent plate. Friction between the plates can generate earthquakes, and as the old rocky material dives into the hot mantle, the rock melts and is recycled back to the surface via volcanic vents.
On Venus, a different kind of subduction is thought to occur around the perimeter of some coronae. In this scenario, as a buoyant plume of hot rock in the mantle pushes upward into the lithosphere, surface material rises and spreads outward, colliding with surrounding surface material and pushing that material downward into the mantle.
Another tectonic process known as lithospheric dripping could also be present, where dense accumulations of comparatively cool material sink from the lithosphere into the hot mantle. The researchers also identify several places where a third process may be taking place: A plume of molten rock beneath a thicker part of the lithosphere potentially drives volcanism above it.
Deciphering Venus
This work marks the most recent instance of scientists returning to Magellan data to find that Venus exhibits geologic processes that are more Earth-like than originally thought. Recently, researchers were able to spot erupting volcanoes, including vast lava flows that vented from Maat Mons, Sif Mons, and Eistla Regio in radar images from the orbiter.
While those images provided direct evidence of volcanic action, the authors of the new study will need sharper resolution to draw a complete picture about the tectonic processes driving corona formation. “The VERITAS gravity maps of Venus will boost the resolution by at least a factor of two to four, depending on location — a level of detail that could revolutionize our understanding of Venus’ geology and implications for early Earth,” said study coauthor Suzanne Smrekar, a planetary scientist at JPL and principal investigator for VERITAS.
Managed by JPL, VERITAS will use a synthetic aperture radar to create 3D global maps and a near-infrared spectrometer to figure out what the surface of Venus is made of. Using its radio tracking system, VERITAS will also measure the planet’s gravitational field to determine the structure of Venus’ interior. All of these instruments will help pinpoint areas of activity on the surface.
8 notes
·
View notes
Video
NASA’s Juno Mission Gets Under Jupiter’s and Io’s Surface by NASA's Marshall Space Flight Center Via Flickr: New data from the agency’s Jovian orbiter sheds light on the fierce winds and cyclones of the gas giant’s northern reaches and volcanic action on its fiery moon. NASA’s Juno mission has gathered new findings after peering below Jupiter’s cloud-covered atmosphere and the surface of its fiery moon, Io. Not only has the data helped develop a new model to better understand the fast-moving jet stream that encircles Jupiter’s cyclone-festooned north pole, it’s also revealed for the first time the subsurface temperature profile of Io, providing insights into the moon’s inner structure and volcanic activity. JunoCam, the visible light imager aboard NASA’s Juno, captured this enhanced-color view of Jupiter’s northern high latitudes from an altitude of about 36,000 miles (58,000 kilometers) above the giant planet’s cloud tops during the spacecraft’s 69th flyby on Jan. 28, 2025. Credit: Image data: NASA/JPL-Caltech/SwRI/MSSS Image processing: Jackie Branc (CC BY) #NASA #MarshallSpaceFlightCenter #MSFC #Marshall #jpl #nasamarshall #juno #nasajuno #moon #Io Read more More about Juno NASA Media Usage Guidelines
#NASA#Marshall Space Flight Center#MSFC#Jet Propulsion Laboratory#JPL#Solar system and beyond#Juno#Jupiter#Space#planets#Io#moon#flickr
9 notes
·
View notes
Text
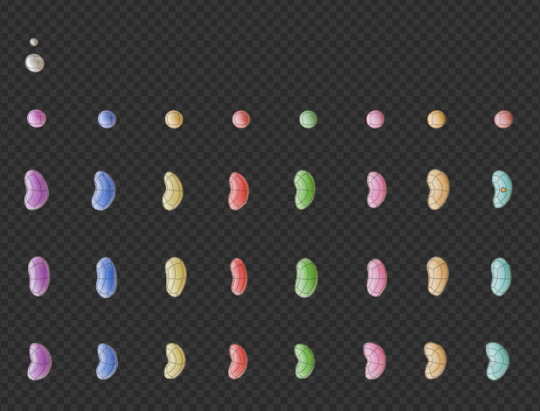
Process - Sunakawa Cake 🎂
A little breakdown of how I made my 3D recreation of the "thank you sunakawa" cake from Ore Monogatari ~

1. Collecting reference
Aside from referencing stills from the anime, I came across the official cake sketch from Madhouse's website! It was really helpful in identifying all the toppings on the cake and other details.


Next was collecting real-life references of all the ingredients I needed to make and taking notes of the shapes, textures and variety.
2. Modelling & Texturing
I go back and forth between modelling and texturing, and jump all over the place so I'll break things down based on the toppings/elements:
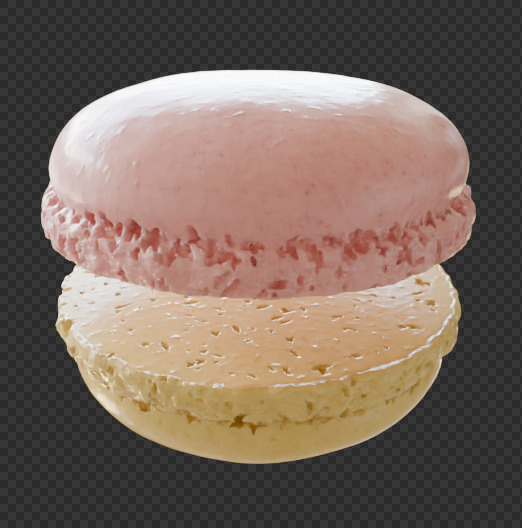
A. Macaron
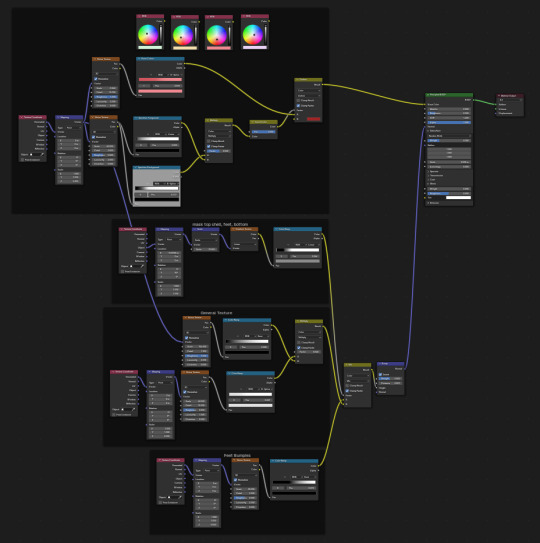
I referenced Canosie Lab's macaron tutorial here, tweaking the process a little bit; using one mesh instead of two and using particles to distribute the boolean meshes. I ended up with LOTS of vertices, so I made a lower poly version of the macaron and used those to avoid bogging down the computer. As for the texture, I used Blender's procedural nodes, utilizing mostly the noise texture node.

Above: The first row are the lower poly versions of the macaron and the second row are the original meshes with around 200,000 vertices each o_o
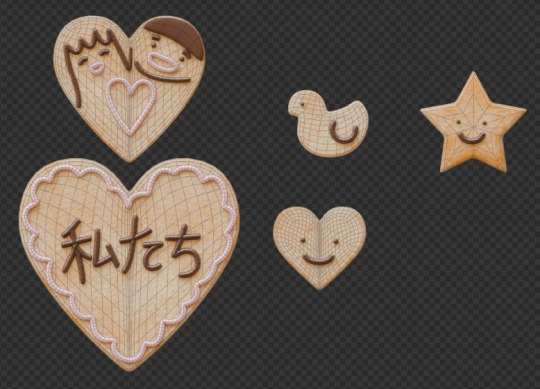
B. Cookies
There's not much to it here; I just modeled the cookies and used procedural textures I've made for a previous project (I'll post that project soon!!!)
The icing is made using bezier curves with some bevel depth. I used the draw tool to draw on the cookies. I did the same for the writings on the cake.
C. Strawberries
I've previously made strawberries for another project so I just used those but baked them to a lower poly mesh first. I used Canosie Labs' strawberry tutorial as reference :) I initially used a scaled down version of the regular-sized strawbs, but decided to make a proper mini strawberry 🍓


Left: with scaled down regular strawberries, Right: proper mini strawberries.

I made them super shiny with lots of subsurface scattering to make them look juicy and gummy-like -- not the most realistic but I think they look cuter like this :>
D. Orange slices
The orange slices were the most challenging to make! Did a lot of trial and error to get that pulpy texture oranges have but I managed using a combination of voronoi nodes :") If you look at the pictures below, you can see how the orange looked in the beginning vs. at the end after I refined it some more.
They look fine from a distance but a little janky up close; maybe I'll do a breakdown one day once I figure out a proper node setup.


Above: before & after
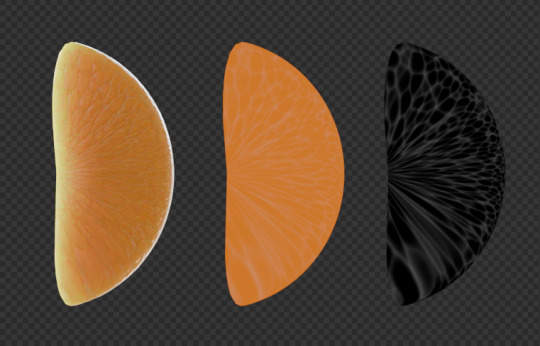
Left to right: rendered, colour only, B/W
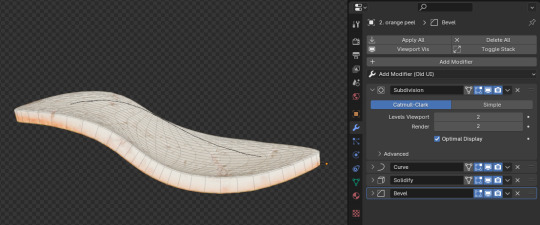
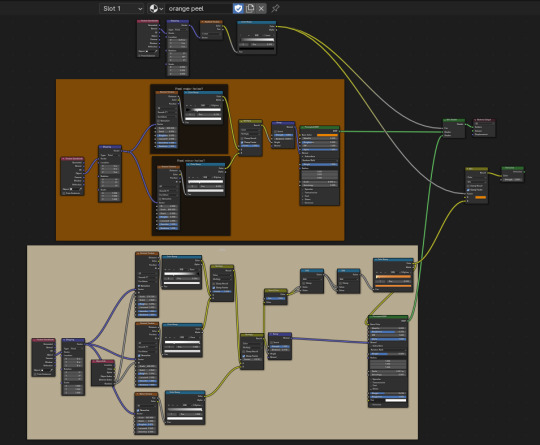
E. Orange peel
A simple plane with a solidify and curve modifier. What's most important here is the texture! I used two different shaders (one for the pith another for the peel) combined using a mask.
F. Jelly beans & choco marbles
A tweaked subdivided square for the jelly beans and subdivided icosphere for the choco marbles. The two use pretty much the same shaders but the jelly beans have more subsurface scattering.
H. Cake
After placing all the toppings, I sculpted the cake (using the multires modifier) a little bit to model the cream that's displaced.

#ore monogatari#sunakawa makoto#process#3d modeling#artists on tumblr#blender#blender 3d#3d model#cake#b3d#3d art#3d render#3d#digital art
30 notes
·
View notes
Text
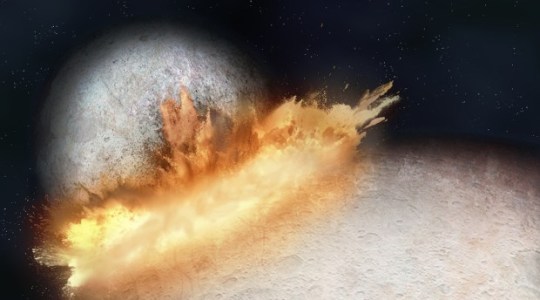
When NASA released images of Pluto in 2015 taken by the New Horizons spacecraft, many were captivated by the dwarf planet’s heart-shaped feature, now called Tombaugh Regio. And now the mystery of how this “heart,” which is nearly 1,000 miles (1,600 kilometers) across, came to be may be solved. A recent study in Nature Astronomy reveals how the western half of the heart, known as Sputnik Planitia, is the result of a massive impact. Based on simulations, the team suggests a planetary body roughly the size of Arizona from north to south collided with Pluto at a slow speed, creating the tear-shaped area.
“The formation of Sputnik Planitia provides a critical window into the earliest periods of Pluto’s history,” said study co-author Adeene Denton, a planetary scientist at the University of Arizona, in a press release. “By expanding our investigation to include more unusual formation scenarios, we’ve learned some totally new possibilities for Pluto’s evolution, which could apply to other Kuiper Belt objects as well.”
Deciphering the past
Sputnik Planitia consists of glacial plains of nitrogen ice. It is lower in elevation than the rest of the dwarf planet by 2.5 miles (4 km).
The team used computer simulations to model the impact on Pluto. The simulations confirmed that instead of a head-on collision, the impact hit at an oblique angle to create the shape we see today. And, rather than sinking into the world as might be expected, the impactor’s remains stayed littered on the surface. “Pluto’s core is so cold that the rocks remained very hard and did not melt despite the heat of the impact, and thanks to the angle of impact and the low velocity, the core of the impactor did not sink into Pluto’s core but remained intact as a splat on it,” said Harry Ballantyne, an astrophysicist at the University of Bern and the study’s lead author.
Furthermore, the simulations suggested that Pluto may not have the substantial subsurface ocean that has been proposed for the tiny world. This ocean has been suggested in part to explain why Tombaugh Regio is near the equator, rather than the pole, as would be expected after time. That’s because a depression with less mass than the surrounding area, such as the heart, should have moved toward the body’s pole. An ocean just beneath the surface, however, would bulge up under the thinner ice of Tombaugh Regio, lending it heft and keeping it near the equator.
Instead, the team found that much of the impactor’s mass could have sunk into Pluto’s core, giving the area enough mass to stay put without the need for a subsurface ocean, or at least a substantial one. “This novel and inventive origin for Pluto’s heart-shaped feature may lead to a better understanding of Pluto’s origin,” said Denton.
18 notes
·
View notes
Note
i think there might be something in the ice
There is nothing in the ice.
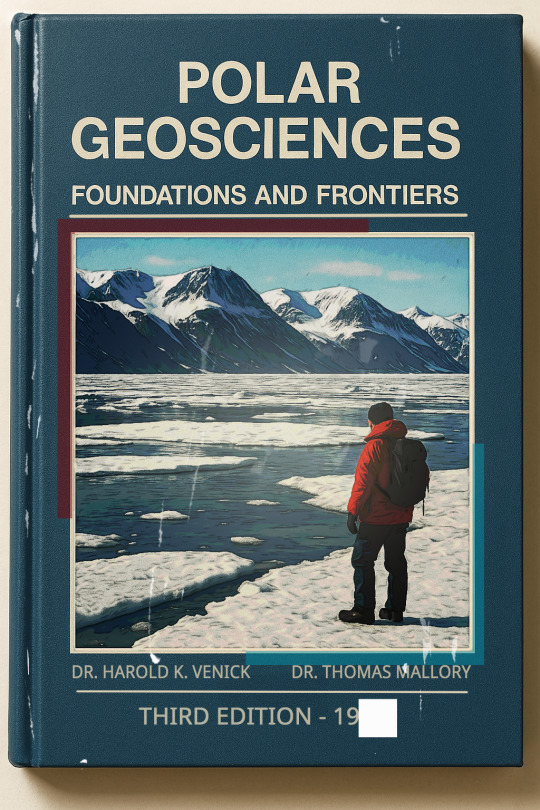
Excerpt from Polar Geosciences: Foundations and Frontiers, 19■■ Edition
Chapter 11: Glaciotectonic Formations and Subsurface Studies
The Myrovsky Expedition and the Glaciotectonic Shelf
Named for Dr. Sergei Alekseyevich Myrovsky, a senior geophysicist with the Soviet Antarctic Research Program, the Myrovsky Glaciotectonic Shelf remains one of the most thoroughly studied formations on the Antarctic continent. Between 1965 and 1969, Dr. Myrovsky and his team conducted a series of deep-core sampling operations, seismic resonance tests, and magnetic anomaly scans in the region now bearing his name.
While initial results prompted speculation regarding subsurface voids or unusual density readings, subsequent analysis attributed these anomalies to natural shifts in permafrost strata and glacial compression artifacts.
The findings were consistent with established models of glaciotectonic behavior and showed no evidence of biologically relevant material, artificial constructs, or geothermal irregularities.
Dr. Myrovsky himself famously stated during a 1973 lecture in Leningrad: “Beneath the ice, there is only pressure, memory, and time.”
His remarks were later misquoted and sensationalized in non-academic circles, but official documentation affirms the scientific consensus: the Myrovsky Shelf is geologically interesting, but ultimately unremarkable in terms of unexplained phenomena.
Further drilling has since been deemed unnecessary.
#replies#ask reply#redacted#classified#fictional archive#cosmic horror#analog horror#deep lore#arg#worldbuilding
3 notes
·
View notes
Text
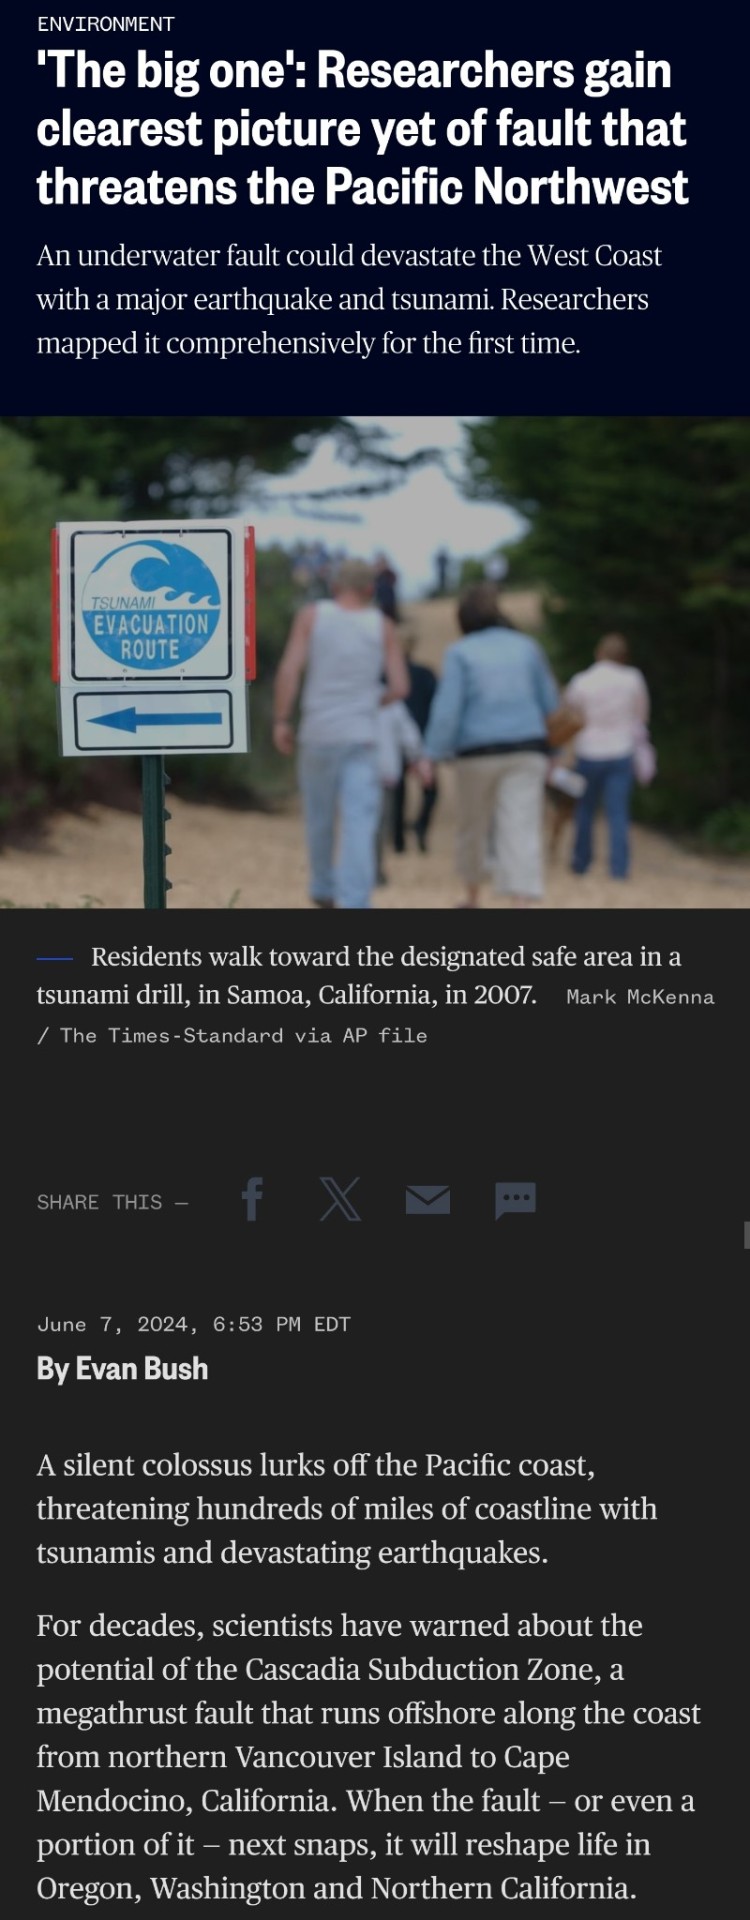
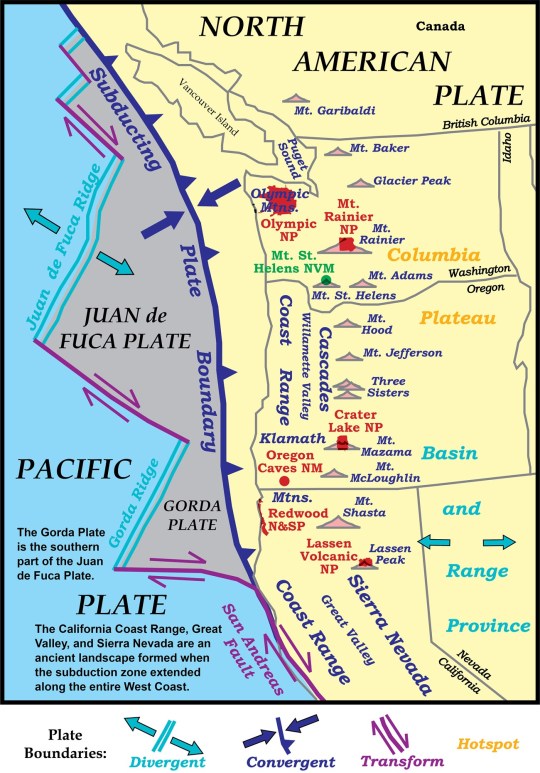
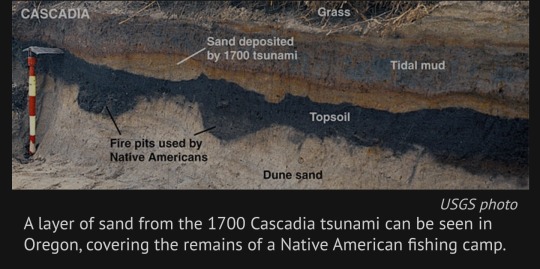
Of particular concern are signals of massive earthquakes in the region’s geologic history. Many researchers have chased clues of the last “big one”: an 8.7-magnitude earthquake in 1700. They’ve pieced together the event’s history using centuries-old records of tsunamis, Native American oral histories, physical evidence in ghost forests drowned by saltwater and limited maps of the fault.
But no one had mapped the fault structure comprehensively — until now. A study published Friday in the journal Science Advances describes data gathered during a 41-day research voyage in which a vessel trailed a miles-long cable along the fault to listen to the seafloor and piece together an image.
The team completed a detailed map of more than 550 miles of the subduction zone, down to the Oregon-California border.
Their work will give modelers a sharper view of the possible impacts of a megathrust earthquake there — the term for a quake that occurs in a subduction zone, where one tectonic plate is thrust under another. It will also provide planners a closer, localized look at risks to communities along the Pacific Northwest coast and could help redefine earthquake building standards.
“It’s like having coke-bottle glasses on and then you remove the glasses and you have the right prescription,” said Suzanne Carbotte, a lead author of the paper and a marine geophysicist and research professor at Columbia University’s Lamont-Doherty Earth Observatory. “We had a very fuzzy low-resolution view before.”
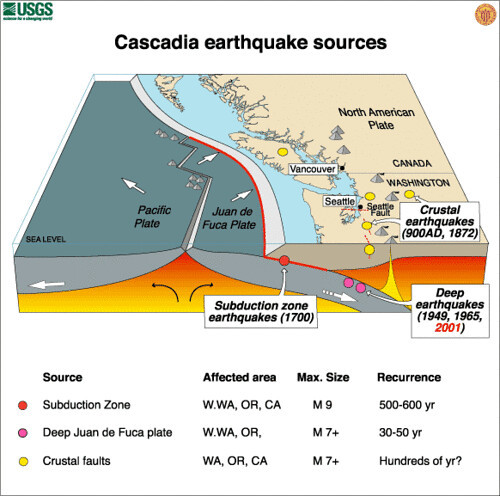
The scientists found that the subduction zone is much more complex than they previously understood: It is divided into four segments that the researchers believe could rupture independently of one another or together all at once. The segments have different types of rock and varying seismic characteristics — meaning some could be more dangerous than others.
Earthquake and tsunami modelers are beginning to assess how the new data affects earthquake scenarios for the Pacific Northwest.
Kelin Wang, a research scientist at the Geological Survey of Canada who was not involved in the study, said his team, which focuses on earthquake hazard and tsunami risk, is already using the data to inform projections.
“The accuracy and this resolution is truly unprecedented. And it’s an amazing data set,” said Wang, who is also an adjunct professor at the University of Victoria in British Columbia. “It just allows us to do a better job to assess the risk and have information for the building codes and zoning.”
Harold Tobin, a co-author of the paper and the director of the Pacific Northwest Seismic Network, said that although the data will help fine-tune projections, it doesn’t change a tough-to-swallow reality of living in the Pacific Northwest.
“We have the potential for earthquakes and tsunamis as large as the biggest ones we’ve experienced on the planet,” said Tobin, who is also a University of Washington professor. “Cascadia seems capable of generating a magnitude 9 or a little smaller or a little bigger.”
A quake that powerful could cause shaking that lasts about five minutes and generate tsunami waves up to 80 feet tall. It would damage well over half a million buildings, according to emergency planning documents.
Neither Oregon nor Washington is sufficiently prepared.
To map the subduction zone, researchers at sea performed active source seismic imaging, a technique that sends sound to the ocean floor and then processes the echoes that return. The method is often used for oil and gas exploration.
They towed a 9-plus-mile-long cable, called a streamer, behind the boat, which used 1,200 hydrophones to capture returning echoes.
“That gives us a picture of what the subsurface looks like,” Carbotte said.
Trained marine mammal observers alerted the crew to any sign of whales or other animals; the sound generated with this kind of technology can be disruptive and harm marine creatures. Carbotte said the new research makes it more clear that the entire Cascadia fault might not rupture at once.
“It requires an 8.7 to get a tsunami all the way to Japan,” Tobin said.
"The next earthquake that happens at Cascadia could be rupturing just one of these segments or it could be rupturing the whole margin,” Carbotte said, adding that several individual segments are thought to be capable of producing at least magnitude-8 earthquakes.
Over the past century, scientists have only observed five magnitude-9.0 or higher earthquakes — all megathrust temblors like the one predicted for the Cascadia Subduction Zone.
Scientists pieced together an understanding of the last such Cascadia quake, in 1700, in part via Japanese records of an unusual orphan tsunami that was not preceded by shaking there.
The people who recorded the incident in Japan couldn’t have known that the ground had shaken an ocean away, in the present-day United States.
Today, the Cascadia Subduction Zone remains eerily quiet. In other subduction zones, scientists often observe small earthquakes frequently, which makes the area easier to map, according to Carbotte. That’s not the case here.
Scientists have a handful of theories about why: Wang said the zone may be becoming quieter as the fault accumulates stress. And now, we’re probably nearing due.
.“The recurrent interval for this subduction zone for big events is on the order of 500 years,” Wang said. “It’s hard to know exactly when it will happen, but certainly if you compare this to other subduction zones, it is quite late.”
#science#geology#earthquakes#tsunami#natural disasters#Washington#Oregon#California#cascadia subduction zone#environment#PlanetFkd
4 notes
·
View notes