#TableauDesktop
Text
Tableau: Display Top N & Bottom N Customers using FIRST() and LAST()
Discover the step-by-step process of displaying both the top n and bottom n customers on a single sheet. Utilize the power of FIRST and LAST functions to efficiently showcase your data and gain valuable insights.
#analyticspro#analytics#dataAnalytics#dataViz#scenario#interview#visualization#vizualization#dashboard#bi#businessintelligence#reporting#tableau#tableaudeveloper#Tableaudesktop#tableauinterview#tableautips#datavisualization#tableaudashboard#bar#chart#topn#top5#bottomn#bottom5#data#first#last#function
0 notes
Video
youtube
#Tableau Tutorial for Beginners | Tableau Introduction | Session 1
Hi Friends,
If you are a graduate, fresher or a experienced professional , thinking to learn latest technologies , then this is an awesome chance for you. Because am going to share a beginner and advanced course for free here regularly on Tableau. Wonder what Tableau is 1 Tableau is a business intelligence tool which helps us to plot numbers in to visuals and helps us understand millions of records at a glance. Why late ? Start clicking the link and get started with your journey of learning the cutting edge technology.
Feel free to post your questions or doubts in the comments section. Don’t forget to like, share and subscribe.
Thanks for watching. Have a nice day and check this space often :)
#youtube#tableau#salesfore#excel#tableau training#tableausoftware#tableaudesktop#business intelligence#data analysis#data analyst course#bi tools#data#data visualization#viz#interview tips for freshers#fresherjobs#freecourses#freecourse
1 note
·
View note
Text
Tableau certification with training in Noida
A computer science study at Stanford that sought to enhance the flow of analysis and increase data accessibility for individuals led to the founding of Tableau in 2003. Tableau’s core technology, VizQL, was created and patented by its co-founders Chris Stolte, Pat Hanrahan, and Christian Chabot. VizQL visually expresses data by converting drag-and-drop operations into data queries via an intuitive interface. Since our founding, we have consistently made unmatched investments in research and development, creating solutions to assist anyone working with data in finding answers more quickly and discovering unexpected insights.
One of the most well-liked tools for business intelligence and data visualization that aids in seeing and comprehending data is Tableau. To gain meaningful insight from the data, it is helpful to develop interactive graphs and charts in the form of a dashboard and spreadsheet. It enables us to quickly assess trends graphically and decide.
Its primary applications are:
1. Data exploration and analysis
2. Development of dashboards
3. Production of reports
4. Data storytelling
5. Predictive modelling
6. Joint analysis of data
7. Data visualisation
8. Analyzing data in real-time
From past few years, APPWARS Technologies has been regarded as Noida’s top Tableau training facility. It aims to provide high-quality training in various situations. Consequently, joining APPWARS Technologies will be a wise career decision if you too want to learn more in-depth knowledge about Tableau.
You can learn how to create graphics and organize data using their Tableau certification program. You will be able to make more insightful business selections if you use these abilities. Tableau is a fantastic tool for visualizing data, and this course will teach you how to map data. Additionally, you will comprehend how ideas like statistics and data mapping relate to Tableau and how they might enhance your proficiency with it.
Here is the link to connect with APPWARS Technologies :-
https://appwarstechnologies.com/tableau-training-in-noida/
#TableauSoftware#Tableau#datarock#data#datalover#dataanalytics#dataanalysis#dataanalyst#bitool#businessanalysis#businessanalytics#businessanalyst#businessintelligence#datarockstar#datahero#TableauConference#TableauWorkshop#TableauDesktop#TableauServer#TableauOnline#dataviz#datavizualisation#TableauDashboard#Dashboard#vizable#viz#bigdata#datapluswoman#womanindata
0 notes
Photo

Create a variety of fully interactive and actionable Tableau dashboards that will inform and impress your audience! Enhance your skills in Tableau Give a call now for a free demo at 9966085577 or Visit: https://skildgrad.com/courses/tableau/ #SkildGrad #onlinecourse #onlinetraining #TableauSoftware #Tableau #dataanalysis #dataanalyst #businessanalysis #TableauWorkshop #TableauDesktop #TableauServer #TableauOnline #tableaudashboard #dashboard #tableau #dashboardlayout #dashboardlayout #analyzing https://www.instagram.com/p/CjSY_v1vRhm/?igshid=NGJjMDIxMWI=
#skildgrad#onlinecourse#onlinetraining#tableausoftware#tableau#dataanalysis#dataanalyst#businessanalysis#tableauworkshop#tableaudesktop#tableauserver#tableauonline#tableaudashboard#dashboard#dashboardlayout#analyzing
0 notes
Text

Many people say Tableau is the best tool to master data visualization. Although debatable, they are right! Tableau is quick, easy to learn, and has an incredible UI. The tool’s creative features allow you to get invaluable insight from data that would drive key business decisions. To learn how to master in Tableau,
Contact info:
Call: +1 732-485-2499
Email: [email protected] | WhatsApp: https://wa.me/17324852499
#hachion#tableau#tableauonlinetraining#tableautraining#tableaucourse#tableaudeveloper#tableaudesktop#usa#usaindians
0 notes
Photo

Tableau 10 Advanced Training: Master Tableau in Data Science.Tableau 10 in Data Science by solving Real-Life Analytics Problems. Learn Visualisation and Data Mining by doing!The basic course "Tableau 10 A-Z: Hands-On Tableau Training For Data Science!" is a pre-requisite. Interested people can share me your details. Check our Info : www.incegna.com Reg Link for Programs : http://www.incegna.com/contact-us Follow us on Facebook : www.facebook.com/INCEGNA/? Follow us on Instagram : https://www.instagram.com/_incegna/ For Queries : [email protected] #tableau,#datascience,#businessanalyst,#powerbi,#visualization.#datamining,#tableaudesktop,#tableaucalculationfilters,#python,#datavisualization,#dynamicsets,#microsoftpowerbidesktop https://www.instagram.com/p/B8OclIXA_2a/?igshid=1a4ryt2dir3z0
#tableau#datascience#businessanalyst#powerbi#visualization#datamining#tableaudesktop#tableaucalculationfilters#python#datavisualization#dynamicsets#microsoftpowerbidesktop
0 notes
Text
Carregando arquivos CSV no Tableau Desktop
https://www.webmundi.com/banco-de-dados/carregando-arquivos-csv-no-tableau-desktop/
#bigdata #datascience #ai#ia #machinelearning #analytics #BI #bigdata #BusinessIntelligence #data #dataanalysis #dataanalytics #datascientist #datavisualization #Developer #inteligenciadenegocios #TableauDesktop #Tableau
0 notes
Photo

✍️Enroll Now: https://forms.gle/6PA5g9JfKNqH5dhM7 🔥Special Offer Rs. 8,000/- Only 👉Attend Online Demo on Tableau By Real-Time Expert | Sriman IT 📅Start Date: 30th August @ 8:00 PM IST For More Details: Call: +91-9985014433 WhatsApp: 9985024433 📪Email: [email protected] 🌐Website: www.srimanit.com 📩Join us on Telegram : https://t.me/sriman_it 📩Subscribe Our YouTube Channel : https://www.youtube.com/channel/UC26qAebkJyZ-e7k26refLVA 📩Join us on Facebook : https://www.facebook.com/SrimaniTech/ 📩Join us on Instagram : https://www.instagram.com/sriman_it/ 📩 Join us on Twitter : https://twitter.com/sriman_it 💥Features of Online Training ✅ Real-Time Oriented Training ✅ Live Training Sessions ✅ Interview Preparation Tips ✅ FAQ’s #tableau #tableaututorial #tableaututorialfromscratch #tableautraining #tableautrainingforbeginners #tableauonlinetraining #tableauinterviewquestions #tableaucourse #tableauproject #tableauforbeginner #tableaubasics #tableauserver #tableauservertraining #tableaucertification #tableaucertificationtraining #datarock #datalover #dataanalytics #dataanalysis #dataanalyst #bitool #businessanalysis #businessanalytics #businessanalyst #businessintelligence #tableauconference #tableworkshop #tableaudesktop #tableauserver #tableauonline (at Hyderabad) https://www.instagram.com/p/CTHhWDipH5O/?utm_medium=tumblr
#tableau#tableaututorial#tableaututorialfromscratch#tableautraining#tableautrainingforbeginners#tableauonlinetraining#tableauinterviewquestions#tableaucourse#tableauproject#tableauforbeginner#tableaubasics#tableauserver#tableauservertraining#tableaucertification#tableaucertificationtraining#datarock#datalover#dataanalytics#dataanalysis#dataanalyst#bitool#businessanalysis#businessanalytics#businessanalyst#businessintelligence#tableauconference#tableworkshop#tableaudesktop#tableauonline
0 notes
Photo

What is Tableau? | A Tableau Overview http://ehelpdesk.tk/wp-content/uploads/2020/02/logo-header.png [ad_1] Tableau helps people see and und... #agile #amazonfba #analysis #analytics #analyticsplatform #business #businessanalysis #businessanalysistool #businessanalytics #businessanalyticsplatform #businessdashboards #businessfundamentals #businessintelligence #cloudapplication #dataanalysis #dataanalytics #dataanalyticstool #datavisualization #excel #financefundamentals #financialanalysis #financialmodeling #forex #investing #microsoft #pmbok #pmp #realestateinvesting #sql #stocktrading #tableau #tableaudesktop #tableauonline #tableauoverview #tableauprep #tableauserver #tableausoftware #visualanalytics #visualdata #whatistableau
0 notes
Text
UDEMY Tableau Desktop Specialist Certification Practice Tests 2020 for FREE
New Post has been published on https://netsmp.com/2020/07/14/udemy-tableau-desktop-specialist-certification-practice-tests-2020-for-free/
UDEMY Tableau Desktop Specialist Certification Practice Tests 2020 for FREE
https://www.udemy.com/course/tableaudesktop/?couponCode=FREE2020
https://www.udemy.com/course/tableaudesktop/?couponCode=FREE2020
0 notes
Text
Tableau: Dynamically Switch / Swap Sheets using Parameter
Allow users to switch / swap displayed sheets, visuals or charts within a Tableau dashboard based on their selection using parameters.
#analyticspro#analytics#dataAnalytics#dataViz#visualization#vizualization#dashboard#bi#businessintelligence#reporting#tableaudashboard#tableau#tableaudeveloper#Tableaudesktop#tableauinterview#tableautips#datavisualization#dynamic#switch#swap#line#bar#map#sales#charts#chart#data#sql#parameter#sheets
0 notes
Text
Hi Friends,
Tableau is a trending BI tool in current job market which allows us to convert data into pictorial representation. To know more about it, please check out this tutorial. It helps you to understand what Tableau is , how and where it can be used. How easy it is to plug in and use this tool for your analysis and get business insights in few minutes.
Don't forget to like , share and subscribe. Thanks for watching. Have a nice day :)
#tableaudesktop#tableau software#tableautraining#youtube#tableaututorials#tableau#business intelligence#technology#data analytics#data visualisation#datavisualization
1 note
·
View note
Text
TableauでWebパフォーマンスを可視化してみる
こんにちは。システム本部の苅部です。
BIツールの評価にあたって、WebpageTestとGoogleAnalyticsのそれぞれのデータを利用してTableauで可視化のイメージを掴んでみましたので、 一連の流れを備忘録として残しておきます。
その1 WebPagetestのデータを可視化する
WebPagetestで定点観測しているデータについて、Tableauを使って時系列データおよび散布図として可視化していきます。
WebPagetestとGoogleSpreadSheetの連携については以前の記事をご確認ください。
・DataStudioとGASでWebPagetestの計測結果をグラフ化する
1. GoogleSpreadSheetを選択
まずデータソースとしてGoogleSpreadSheetを選択します。
Google側の認可画��でGoogleDriveへのアクセスを許可し、任意のシートを選択します。

以下のような形でインポートできました。
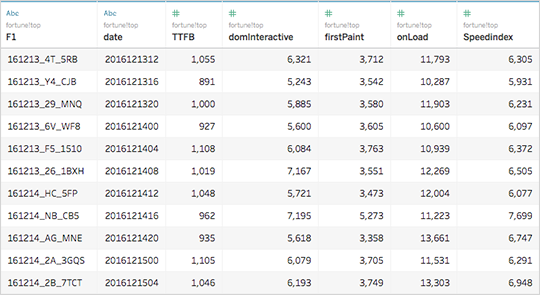
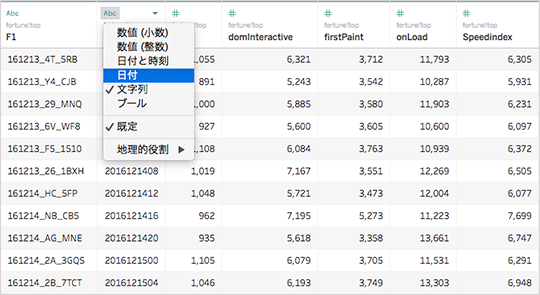
日付が文字列として認識されているので、時系列データとして扱えるように日付型に変換しておきます。
2. ざっくり下地を作成
次に新規のシートを作成してグラフを可視化を進めていきます。
SpreadSheetのグラフ機能やDataStudioと比較するとTableauは軽快で使いやすく、直感的に操作をしても見た目が整います。
また、データソースがデータウェアハウスや数百万行のCSVファイルといった巨大な場合でも、予め抽出しておくことで高速なクエリエンジン(Hyper)を利用して非常に早く処理することができます。
3. 微調整して完成
必要に応じてNULLの除去や目盛りの最大値の調整等をすれば完成です。
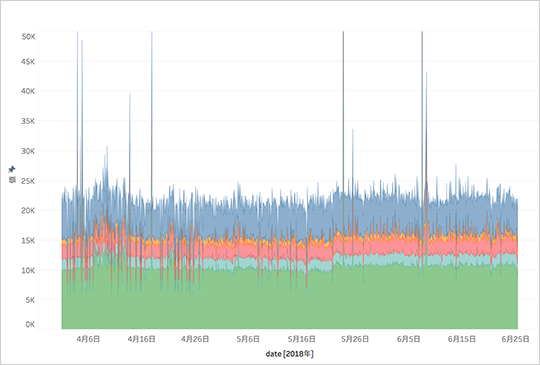
TimeToFirstByte,DOMInteractive,FirstPaint,onLoad,SpeedIndexの指標を、時系列として綺麗に可視化できました。
TableauOnline/Serverであればデータ主導アラートを使って「特定の閾値を超えたらアラートメールを送信」といった設定もできるはずです。
FirstPaintを説明変数、SpeedIndexを目的変数として散布図も作成してみました。
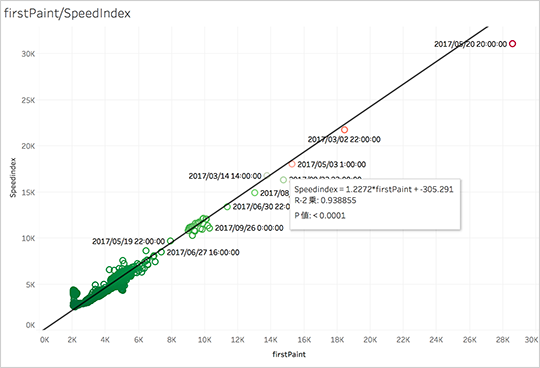
ツールヒントにはR2乗値とp値が表示されますので、回帰式の当てはまりの良さを把握することができます。
その2 GoogleAnalyticsのデータを地図に重ねる
GoogleAnalyticsの速度指標を使って地域ごとのWebパフォーマンスをTableauでマッピングしていきます。
1. GoogleAnalyticsを選択
データソースとしてGoogleAnalyticsを選択します。
Google側の認可画面でGoogleAnalyticsへのアクセスを許可し、任意のシートを選択します。
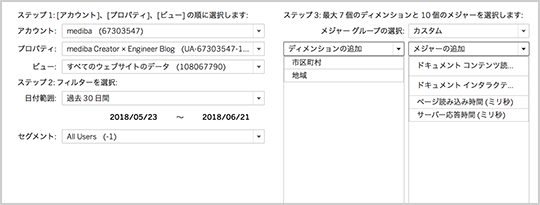
今回は以下のような形でGoogleAnalyticsのCoreReportingAPIからデータを取得しました。
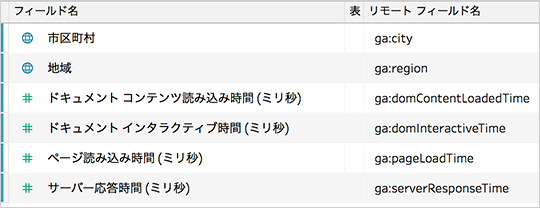
2. 地域名を正規化して地理データへ
GoogleAnalyticsの地域情報には[Kanagawa Prefecture]といった形で[Prefecture]の文字列が入っていることがあるので、Tableauの計算フィールドを使って正規化しておきます。
if CONTAINS([地域],"Prefecture") = FALSE then [地域] ELSE REGEXP_REPLACE([地域],"Prefecture","") END
※地域ディメンションの"Prefecture"の文字列を取り除いています。
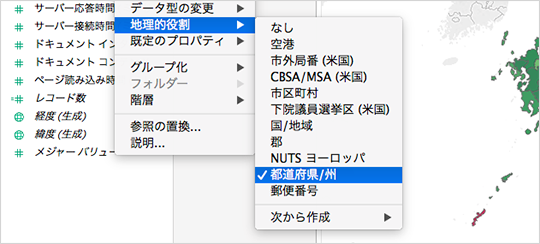
そして、このディメンションは都道府県の地理データとして認識させたいので、[地理的役割]から[都道府県/州]を選んでおきます。
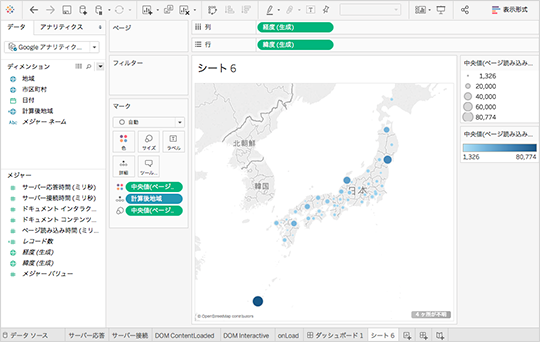
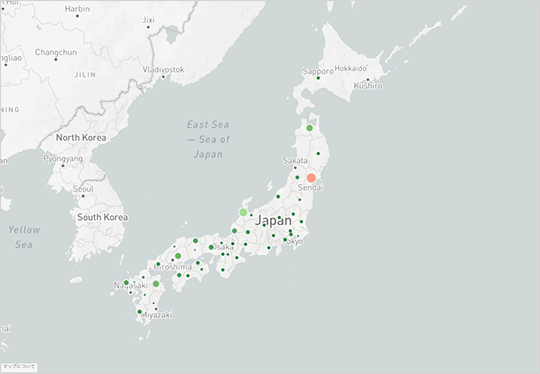
3. データを地図と重ねる
さきほど計算フィールドで作成したディメンションと任意のメジャーを選択して記号マップを作成します。
今回はディメンションとしてページ読み込み時間(onLoad)を選択しました。
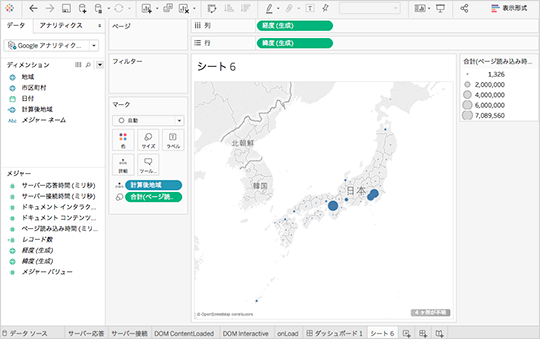
4. 配色を変化させる
全て同じ色で地域ごとの指標の差が分かりづらいので、メジャーの値を利用して色を変化させます。
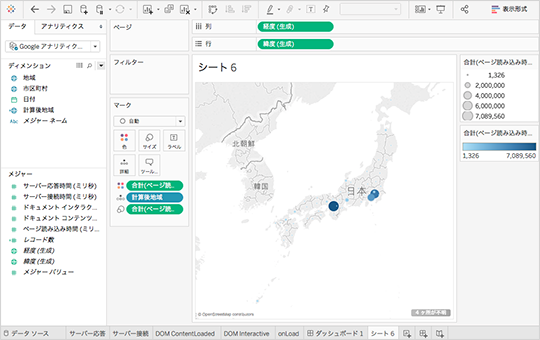
5. 指標を中央値に変更する
記号の色も大きさも指標が[合計値]となっているため、それぞれ[中央値]に変更します。
※合計値の場合、単純にレコード数の多い都道府県が大きくなってしまいます。
6. 色を変更する
青のグラデーションでは指標の良し悪しがわからないため、赤から緑の分化に変更しさらに反転をかけておきます。
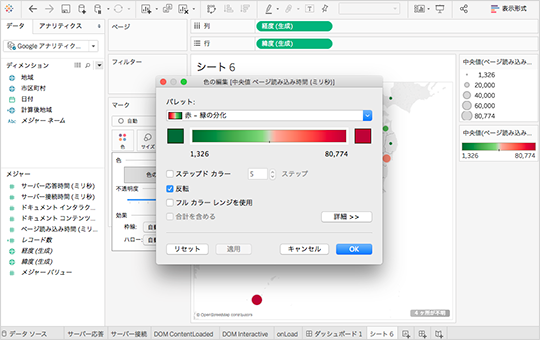
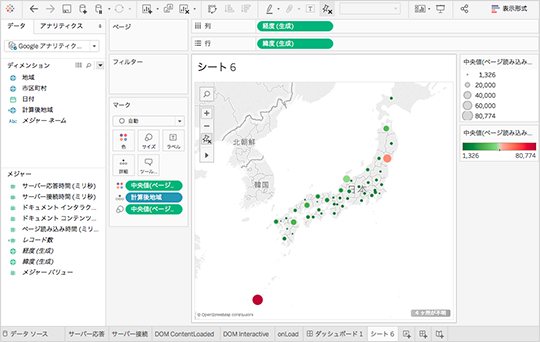
onLoadの指標が芳しくない沖縄/東北が赤い丸となり、より目立つようになりました。
ということで、まずは1つの目のシートの完成です。
8. ダッシュボードの作成
さらに同じ流れで合計4つのシートを作成し、1つのダッシュボードにまとめて一覧表示させました。
残り3つのシートは、それぞれDOMInteractive/onLoad/DOMContentLoaded/サーバ応答としています。
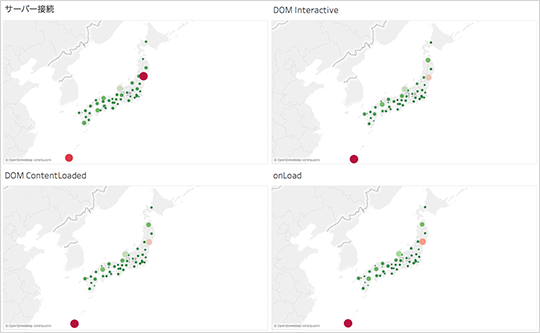
沖縄県はどの値も悪そうで、北陸や東北の一部の地域も芳しくありません。
直接的な原因は分かりませんが、各Webサーバとの物理的な距離とそれによるレイテンシ影響によって地理的に不利ではありそうです。
GoogleAnalyticsから取得できる指標は、日本中からアクセスしている実際のユーザーの値ですので、地図と指標を重ねることで地域ごとのパフォーマンスを可視化することができました。
備考
レイテンシ以外にも[地域ごとの携帯端末の利用状況の違い]だったり[WiFi普及状況]といった他の要因もあると思います。
モバイルネットワークでのIPアドレス地域判定の精度は高くありません。通信事業者によっては東京にいても大阪判定されるケースがあります。
GoogleAnalyticsのCoreReportingAPIは、セグメントの掛け合わせ方によっては精度が落ちることがあります。
おまけ
TableauはMapboxとの連携も可能です。
MapboxのAPIキーをTableau側で入力することで、任意のマップを使うこともできます。
おわりに
WebPagetestやGoogleAnalyticsのデータを使って、Tableauの基本的な操作感を掴むことができました。
可視化という意味では、他BIツールであったり、GoogleAnalytics、GoogleSpreadSheet、Excel、DataStudio、Re:Dash、Grafana、R、Pythonなども選択肢としてありますが、[個人個人が探索的に分析してデータを理解していく]という目的においては、機能面と操作性でTableauがバランスが取れていると思いました。
TableauはUIが直感的でデータの抽出速度も速いため可視化のコストが低い印象です。
今回TableauDesktopで完結させていますが、TableauOnline/Serverでブラウザ上で分析できる環境を整えると、データが民主化され一歩進んだ分析が可能になると思います。
参考URL
Tableau テクノロジー | Tableau Software
Hyper | Tableau Software
Mapbox マップの使用
Tableau Online または Tableau Server からのデータ主導アラートの送信
TableauでGoogle アナリティクスをデータソースとするときのコツ
Googleアナリティクス x Tableau(タブロー)ことはじめ 心得7か条
0 notes
Photo
This data visualisation tool has been utilised by the business intelligence sector ever since it was first developed. Tableau is widely used by businesses like Amazon, Walmart, Accenture, Lenovo, and others. Follow us for more interesting tips career If you wants to excel your career in Tableau, give a call now for a free demo Contact: 9966085577 or Visit: https://skildgrad.com/courses/tableau/ #SkildGrad #onliencourse #TableauSoftware #Tableau #datarock #data #datalover #dataanalytics #dataanalysis #dataanalyst #businessanalysis #businessanalytics #businessanalyst #businessintelligence #datarockstar #datahero #TableauWorkshop #TableauDesktop #TableauServer #TableauOnline #datavizualisation #tableaudashboard https://www.instagram.com/p/CiRsCtGvCXJ/?igshid=NGJjMDIxMWI=
#skildgrad#onliencourse#tableausoftware#tableau#datarock#data#datalover#dataanalytics#dataanalysis#dataanalyst#businessanalysis#businessanalytics#businessanalyst#businessintelligence#datarockstar#datahero#tableauworkshop#tableaudesktop#tableauserver#tableauonline#datavizualisation#tableaudashboard
0 notes
Text

Many people say Tableau is the best tool to master data visualization. Although debatable, they are right! Tableau is quick, easy to learn, and has an incredible UI. The tool’s creative features allow you to get invaluable insight from data that would drive key business decisions. To learn how to master in Tableau,
Contact info:
Call: +1 732-485-2499
Email: [email protected] | WhatsApp: https://wa.me/17324852499
#hachion#tableau#tableauonlinetraining#tableautraining#tableaucourse#tableaudeveloper#tableaudesktop#usa#usaindians
0 notes
Photo

Tableau for Beginners: Get Certified,Jump into data visualization with hands-on exercises.Create bar charts, pie charts, and line graphs.Create trend lines and understand the relevant statistical metrics such as p-value and R-squared.Create a dynamic dashboards combining multiple worksheets. Interested People can share me your details. Check our Info : www.incegna.com Reg Link for Programs : http://www.incegna.com/contact-us Follow us on Facebook : www.facebook.com/INCEGNA/? Follow us on Instagram : https://www.instagram.com/_incegna/ For Queries : [email protected] #tableau,#datavisualization,#barcharts,#piecharts,#datasources,#dataanalysis,#statistical,#pvalued,#Rsquare,#DataAggregation,#tableaudesktop,#WebAuthoring,#datablending https://www.instagram.com/p/B60Fi-agt5S/?igshid=1m7wep4cf3xdk
#tableau#datavisualization#barcharts#piecharts#datasources#dataanalysis#statistical#pvalued#rsquare#dataaggregation#tableaudesktop#webauthoring#datablending
0 notes
Last Seen Blogs

pluto-deserved-better-007-blog
Sem título


katesgotabow
payback's a bitch

gtfonatalie-blog
sweet taste of kerosene

multifandom-is-a-black-hole
you make me feel ✨bendy✨