#candlestickpattern
Explore tagged Tumblr posts
Visit Tumblr Blog
Explore Tumblr blogs with no restrictions, modern design and the best experience.
Last Seen Tumblr Blogs


Fun Fact
BuzzFeed published a report claiming that Tumblr was utilized as a distribution channel for Russian agents to influence American voting habits during the 2016 presidential election in Feb 2018.
Link
#AdaniPorts#AfricanUnion#candlestickpattern#China#crudeoil#DalalStreet#domesticinstitutionalinvestors#foreigninstitutionalinvestors#G20#G20Delhi#G20summit#India#India-MiddleEast-EuropeCorridor#IRCON#IRFC#NarendraModi#Nifty#Nifty50#Nifty50analysis#NiftyBank#Niftyindex#Railway#RelianceIndustries#RITES#RVNL#technicalanalysis#UAE
0 notes
Link
#CandlestickAnalysis#candlestickpatterns#chartpatterns#ForexTrading#markettrends#MomentumTrading#priceaction#ReversalPatterns#riskmanagement#StockMarket#supportandresistance#technicalanalysis#TradingSignals#TradingStrategy#TrendContinuation
2 notes
·
View notes
Text
Inverted Hammer Pattern Explained: Spot Market Reversals Like a Pro
Are you spotting the right reversal signals in the market?
Understanding candlestick patterns can provide a critical edge in trading, especially when it comes to identifying potential trend reversals. One such pattern is the Inverted Hammer—a powerful single-candle formation that often signals a possible shift from bearish to bullish momentum. However, recognizing it isn’t enough. Traders must understand the psychology behind the candle, its context within a trend, and how to confirm its validity with other indicators.
In our latest article, we break down the Inverted Hammer Pattern in detail: how to spot it, what it really means, and how to use it effectively in your trading strategy.
Start making smarter trading decisions today.
Read the full guide here:
#CandlestickPatterns#TradingForBeginners#InvertedHammer#StockMarket#TechnicalAnalysis#PriceAction#SmartTrading
0 notes
Text
youtube
Learn how to use the Money Flow Index (MFI) — one of the most powerful yet underrated technical indicators.
Perfect for stock traders, technical analysts, and beginners who want to use volume + price in one effective tool.
Read the full blog: https://navia.co.in/blog/money-flow-index-mfi/
Download the app - https://open.navia.co.in/index-navia.php?datasource=DMO-YT
Don't forget to like, share, and subscribe for more trading strategies!
#moneyflowindex#mfiindicator#technicalanalysis#stockmarketindia#tradingforbeginners#stocktradingtips#volumeanalysis#priceaction#tradingstrategies#niftytrading#stockmarketeducation#technicalindicators#overboughtoversold#bullishdivergence#bearishdivergence#breakoutstrategy#tradingtools#momentumtrading#indianstockmarket#naviatrading#chartpatterns#learntrading#intradaytrading#swingtrading#indicatorbasics#investingforbeginners#candlestickpatterns#macdtrading#bollingerbands#Youtube
0 notes
Text

🚀 Ready to transform your financial future in just 30 days? Join our Online Trading Education Programme with BMP AI and master the skills to earn for a lifetime! 💰📈
🔍 What you’ll learn: ✅ Basics of Trading ✅ Technical Analysis ✅ Indicators & Candlestick Patterns ✅ Futures & Options ✅ Trading Strategies ✅ Trading Psychology
💻 Attend Live Zoom Classes 🗓️ Starting: 21st May 🕣 Time: 8:30 PM IST
🌐 Visit: www.bmpAI.io 📩 Contact: [email protected]
📊 Learn. Trade. Grow.
#TradingEducation#LearnTrading#BMPAI#OnlineTradingCourse#FinancialFreedom#StockMarketIndia#ZoomClasses#TechnicalAnalysis#FutureAndOptions#TradingPsychology#CandlestickPatterns#artificialintelligence#forex#e-commerce#crypto#wealth management
0 notes
Text

Top 10 Most Powerful Candlestick Patterns | Trading Fuel
Learn the top 10 candlestick patterns that can improve your trading approach. Gain valuable insights to support better analysis and smarter market moves.
0 notes
Text
Price Action and Technical Setups
This Price Action and Technical Setups ebook lays down...
Ratios, Entry Levels/Stoploss Multiple Price Action Strategy Different Breakouts & Price Outcomes Buying & Selling Opportunities Several Technical Setups
And much more...
Educational content with high-level methods for beginners. The profits can be high with the right tools and knowledge. Get access to this ebook forever. Access it offline, anytime, anywhere. Once downloaded, the purchase can't be refunded.
File: PDF Size: 20,1 MB Pages: 580
14 E-BOOKS - 580 PAGES
#priceaction#technicalanalysis#tradingstrategies#markettrends#forextrading#stockmarketindia#daytrading#swingtrading#chartpatterns#tradingtips#investsmart#marketanalysis#candlestickpatterns#riskmanagement#tradingpsychology#technicalindicators#pricetrends#tradesetup#financialfreedom#investingwisely#tradingcommunity
0 notes
Text
#Here are some hashtags you can use for this content:#ClassroomOfTraders#StockMarket#TradingAcademy#LearnToTrade#TradingStrategies#FinancialEducation#Investing#StockTrading#MarketAnalysis#CandlestickPatterns#MoneyManagement#TradeSmart#MarketSuccess#StockMarketCourses#TradeWithConfidence#TradingCommunity#Stock market Course in Chennai
0 notes
Text
Classroom of Traders is a dynamic trading academy focused on empowering individuals with the knowledge and skills to succeed in the financial markets. They offer comprehensive courses on stock market trading, including personalized one-on-one sessions, practical guidance on trading strategies, and expert insights into candlestick patterns. The academy emphasizes disciplined trading and money management to help traders navigate market conditions confidently. With free video content and quick market analysis techniques, Classroom of Traders aims to shape successful traders, teaching them to analyze risks effectively while mastering the art of trading.
To learn more, visit their website at https://classroomoftraders.com/.
#ClassroomOfTraders#StockMarket#TradingAcademy#LearnToTrade#TradingStrategies#FinancialEducation#Investing#StockTrading#MarketAnalysis#CandlestickPatterns#MoneyManagement#TradeSmart#MarketSuccess#StockMarketCourses#TradeWithConfidence#TradingCommunity
0 notes
Text

Crack the candlestick code, and master the market
#CandlestickPatterns#TechnicalAnalysis#ChartPatterns#TradingSignals#StockCharts#StockMarket#TradingTips#InvestingWisely#MarketTrends#FinancialFreedom
0 notes
Text
Master the Thrusting Line Pattern
Want to sharpen your candlestick reading skills? Master the Thrusting Line Pattern — a subtle but powerful continuation signal that can guide your next trade. In our latest guide, learn:
What the Thrusting Line pattern looks like
When to use it
Real chart examples
Perfect for beginners and intermediate traders. Read now:
0 notes
Text
Candlestick Patterns and Their Role in Trading
In the world of trading, understanding and predicting market movements is crucial for success. Among the various tools available to traders, candlestick patterns stand out as one of the most powerful and widely used methods for technical analysis. Candlestick patterns not only help traders anticipate market trends but also offer valuable insights into the psychology of market participants. This article delves into what candlestick patterns are, their significance in trading, and how traders can use them to make more informed decisions.

What Are Candlestick Patterns?
Candlestick patterns are a type of chart pattern that originated in Japan in the 18th century. They were first used by Japanese rice traders to track and predict price movements. Over time, these patterns gained popularity in the Western world and have become an essential tool for modern traders.
Each candlestick on a chart represents the price movement for a specific time frame, such as one minute, one hour, or one day. A single candlestick is composed of four key pieces of information:
Open Price – The price at which the trading period started.
Close Price – The price at which the trading period ended.
High Price – The highest price reached during the trading period.
Low Price – The lowest price reached during the trading period.
The body of the candlestick (the rectangular part) shows the range between the open and close prices, while the thin lines above and below (called wicks or shadows) represent the high and low prices.
Bullish vs. Bearish Candlesticks
Bullish Candlestick: Indicates that the closing price is higher than the opening price. It’s often colored green or white and signifies upward price movement.
Bearish Candlestick: Indicates that the closing price is lower than the opening price. It’s often colored red or black and signifies downward price movement.
Understanding how to read individual candlesticks is the foundation for recognizing more complex candlestick patterns.
Why Are Candlestick Patterns Important?
Candlestick patterns provide valuable insights into market sentiment and potential future price movements. Unlike other technical indicators that rely on calculations and formulas, candlestick patterns offer a visual representation of the battle between buyers and sellers.
These patterns can:
Identify market reversals: Some patterns signal that a trend may be about to reverse direction.
Confirm existing trends: Others confirm the continuation of an ongoing trend.
Provide entry and exit points: Candlestick patterns help traders time their trades effectively.
Enhance decision-making: By understanding market psychology, traders can make more informed decisions.
Popular Candlestick Patterns Every Trader Should Know
There are numerous candlestick patterns, but some are more reliable and commonly used than others. These patterns can be broadly classified into two categories: reversal patterns and continuation patterns.
Reversal Patterns
Reversal patterns indicate a potential change in the current trend direction.
Hammer
Description: A single candlestick with a small body and a long lower wick.
Significance: Appears at the bottom of a downtrend, signaling a potential reversal to the upside.
Example: A hammer indicates that sellers pushed the price lower during the session, but buyers regained control before the close.
Shooting Star
Description: A single candlestick with a small body and a long upper wick.
Significance: Appears at the top of an uptrend, indicating a potential reversal to the downside.
Engulfing Pattern
Bullish Engulfing: A larger green candlestick completely engulfs the previous red candlestick, signaling a potential upward reversal.
Bearish Engulfing: A larger red candlestick engulfs the previous green candlestick, signaling a potential downward reversal.
Morning Star and Evening Star
Morning Star: A three-candlestick pattern that signals a bullish reversal. It consists of a bearish candle, a small indecisive candle, and a bullish candle.
Evening Star: The bearish counterpart of the Morning Star, signaling a potential downward reversal.
Continuation Patterns
Continuation patterns indicate that the current trend is likely to continue.
Doji
Description: A candlestick with an almost equal open and close price, resulting in a very small body.
Significance: Reflects market indecision. Depending on its position in the trend, it can either signal a continuation or a potential reversal.
Three White Soldiers
Description: Three consecutive bullish candlesticks with higher closes each time.
Significance: A strong bullish continuation pattern.
Three Black Crows
Description: Three consecutive bearish candlesticks with lower closes each time.
Significance: A strong bearish continuation pattern.
Rising and Falling Three Methods
Rising Three Methods: A bullish continuation pattern consisting of several small bearish candles followed by a large bullish candle.
Falling Three Methods: The bearish counterpart of the Rising Three Methods.
How to Use Candlestick Patterns in Trading
Recognizing candlestick patterns is only the first step. To use them effectively, traders must combine them with other technical indicators and strategies. Here are some practical tips for incorporating candlestick patterns into your trading plan:
Combine with Support and Resistance Levels Candlestick patterns are more reliable when they appear near significant support or resistance levels. For instance, a bullish engulfing pattern at a strong support level is a more reliable buy signal.
Use Multiple Time Frames Analyzing candlestick patterns across multiple time frames can provide a clearer picture of market trends. A pattern that appears on a daily chart is generally more significant than one on a five-minute chart.
Confirm with Technical Indicators Indicators such as the Relative Strength Index (RSI), Moving Averages, and Bollinger Bands can help confirm the signals provided by candlestick patterns.
Practice Risk Management No pattern guarantees success. Always use stop-loss orders and maintain a disciplined approach to risk management.
Monitor Market Context Always consider the broader market context. A candlestick pattern that appears during a news event or high-volatility period may behave differently than one in a stable market.
Common Mistakes to Avoid
While candlestick patterns can be powerful, they are not foolproof. Here are some common mistakes traders should avoid:
Over-reliance on a single pattern: Always seek confirmation from other indicators or patterns.
Ignoring the trend: Patterns are more reliable when traded in the direction of the prevailing trend.
Forgetting risk management: Even the most reliable patterns can fail, so proper risk management is essential.
Failing to practice: New traders should practice identifying and interpreting candlestick patterns using demo accounts before trading with real money.
Conclusion
Candlestick patterns are a valuable tool for traders seeking to anticipate market movements and improve their decision-making. At Shenzhou Capital, we believe that understanding the various patterns and how to use them effectively can give traders a significant edge in the markets. However, it’s essential to remember that no pattern is foolproof, and combining candlestick analysis with other technical tools and strategies is key to long-term success.
Whether you’re a beginner or an experienced trader, mastering candlestick patterns can enhance your trading journey and help you navigate the complexities of financial markets with greater confidence.
#CandlestickPatterns#TradingStrategies#TechnicalAnalysis#ForexTrading#StockMarket#CryptoTrading#MarketTrends#BullishPatterns#BearishPatterns#TradingTips
1 note
·
View note
Text
UNDERSTANDING OPENING PRICES IN TRADING
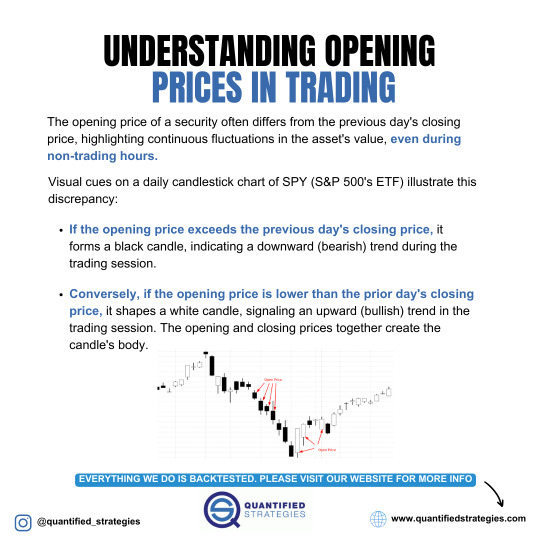
The opening price can differ from the previous day's close, highlighting overnight value shifts. On SPY's candlestick charts, a black candle suggests a bearish session, while a white candle signals a bullish trend. These patterns offer crucial insights into market sentiment.
0 notes
Text

Price Action and Technical Setups
This Price Action and Technical Setups ebook lays down...
Ratios, Entry Levels/Stoploss Multiple Price Action Strategy Different Breakouts & Price Outcomes Buying & Selling Opportunities Several Technical Setups
And much more...
Educational content with high-level methods for beginners. The profits can be high with the right tools and knowledge. Get access to this ebook forever. Access it offline, anytime, anywhere. Once downloaded, the purchase can't be refunded.
File: PDF Size: 20,1 MB Pages: 580
14 E-BOOKS - 580 PAGES
#priceaction#technicalanalysis#tradingstrategies#markettrends#forextrading#stockmarketindia#daytrading#swingtrading#chartpatterns#tradingtips#investsmart#marketanalysis#candlestickpatterns#riskmanagement#tradingpsychology#technicalindicators#pricetrends#tradesetup#financialfreedom#investingwisely#tradingcommunity
0 notes
Text
instagram
#sharemarket#stockmarket#candlesticks#candlestickpatterns#sharetrading#candles#chartpatterns#delhi#Instagram
0 notes
Text

I can say that all the stock groups, not as united as we are, we go to operate, is confident. We're the main force. We're a family. Last year's operation of NVDA, a wave of market we have earned 30%, this year Nvidia is crazy. January collective sprint ARQT, thanks to the main force. Too admire the group master, interested can join the WS group. https://chat.whatsapp.com/HSUyFs2MYEOESVLTuIELui
#us politics#russia#ukraine#titanic#oceangate#russian coup#mark zuckerberg#elon musk#stockmarket#youtube#nifty prediction#banknifty#stockanalysis#investmenttips#investmentstrategy#tradingstrategies#tradingtips#fundamentalanalysis#technicalanalysis#News#StockMarket#StockTrading#StockMarketsToday#HEX#CurveDAOToken#CandlestickPatterns#BullishReversal#TradingStrategies#TechnicalAnalysis#Unknown
0 notes