#datatables-react
Explore tagged Tumblr posts
Visit Tumblr Blog
Explore Tumblr blogs with no restrictions, modern design and the best experience.
Last Seen Tumblr Blogs


Fun Fact
Tumblr has been banned in Indonesia for providing people with access to pornographic content.
Text
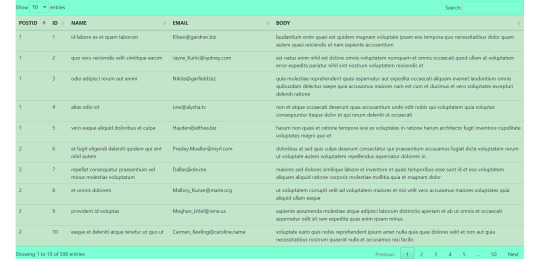
Fetch data from api and show in table with jquery dataTable plugin.
#react#react js#jquery dataTable plugin#fetch data from api#fetch data from api and show in table#get data from api and show in table#javascript#frontend#webtutorialstack
0 notes
Text
Metronic HTML Template: Elevate Your Best Web Design Game

Are you looking for a reliable admin dashboard template to power your next project? Look no further than Metronic Html Template! This powerful tool is designed to help you create beautiful and intuitive admin interfaces that will impress your clients and users alike.
In this review, we’ll take a closer look at what makes Metronic Html Template such a great choice for developers and businesses alike. We’ll explore its features, functionality, and compatibility with popular frameworks like Tailwind, Bootstrap, React, Vue, Angular, Asp.Net & Laravel. So, let’s dive in!
Features
Metronic Html Template comes loaded with a wealth of features that make it an excellent choice for developers and businesses alike. Some of its standout features include:
– High Resolution: Metronic Html Template is optimized for high-resolution displays, so your dashboard will look crisp and clear on any device. – Responsive Layout: The template is designed to be fully responsive, so your dashboard will look great on any screen size.
– Well Documented: Metronic Html Template comes with comprehensive documentation to help you get up and running quickly.
– Compatible Browsers: The template is compatible with all popular web browsers, including Firefox, Safari, Opera, Chrome, and Edge.
– Compatible With: Metronic Html Template is compatible with Angular 13.x.x, AngularJS, ReactJS, Bootstrap 5.x, Bootstrap 4.x, and other popular frameworks.
– Admin Dashboard Template: Metronic Html Template is designed specifically for use as an admin dashboard template, so you can be sure it has all the features you need to create a powerful and intuitive dashboard.
– Admin Themes: The template comes with a range of pre-built themes to help you get started quickly.
– PHP Files: Metronic Html Template comes with all the PHP files you need to get started quickly.
– HTML Files: The template comes with a range of pre-built HTML files, so you can get started quickly.
– CSS Files: Metronic Html Template comes with a range of pre-built CSS files to help you customize your dashboard.
– Sass Files: The template includes Sass files for advanced customization.
– SCSS Files: The template includes SCSS files for advanced customization.
– JS Files: Metronic Html Template includes a range of pre-built JavaScript files to help you get started quickly.
Compatibility
Metronic Html Template is compatible with a wide range of popular frameworks and platforms, including:
– Tailwind – Bootstrap – React – Vue – Angular – Asp.Net & Laravel
This makes it an excellent choice for developers who want a flexible and versatile tool that can be used with a variety of different frameworks and platforms.
12 Advanced Apps For Real-world Demands
Complete CRUD solution with managable datatables, advance form controls, wizards flows and interactive modals for any project requirements you can imagine
Metronic UI Kit Develop Design Fast
Create cohesive user interfaces for single or multiple projects without having to start from scratch. Metronic UI Kit is helpful for designers who are just starting out or who are working on projects with tight deadlines.
Company made it! Smart & Low-cost!
One stop solution that boosts your projects’ design and development at shortest amount of time and at ridiculously low cost. In the past 10 years, hundreds of thousands of web apps successfully launched by Metronic that are used by hundreds of millions of end users everyday
Pricing
Metronic Html Template is available for purchase on ThemeForest for just $49. This includes a Regular License, which allows you to use the template in a single end product that is not charged for. If you need to use the template in a product that will be sold to end users, you can purchase an Extended License for $969.
If you purchase the Regular License, you’ll receive quality checking by Envato, future updates, and six months of support from keenthemes. You can also extend your support to 12 months for an additional fee.
Reviews
Mr. Levan Dvalishvili Chief (Software Architect) at solarspace.io said Hands down the most developer friendly package that I have worked with.. A+++++
platform we tried out Metronic. I can not overestimate the impact Metronic has had. Its accelerated development 3x and reduced QA issues by 50%. If you add up the reduced need for design time/resources, the increase in dev speed and the reduction in QA, it’s probably saved us $100,000 on this project alone, and I plan to use it for all platforms moving forward. The flexibility of the design has also allowed us to put out a better looking & working platform and reduced my headaches by 90%. Thank you KeenThemes! Jonathan Bartlett, Metronic Customer
Metronic is an incredible template. Even with purchasing an extended license, the cost savings is immeasurable. The code & CSS is well organized and while it is feature rich, it is not bloated. It was quickly integrated into our relatively complex product and had ready-made UX for our many use cases. Where we needed to extend functionality, this system made it incredibly easy. A tremendous job by the Metronic team. Fatica, Metronic Customer
Conclusion
In conclusion, Metronic Html Template is an excellent choice for developers and businesses alike. It comes loaded with features, is compatible with a wide range of popular frameworks and platforms, and is available at an affordable price. Whether you’re building a new dashboard from scratch or looking to upgrade an existing one, this Template is definitely worth considering.
So, what are you waiting for? Head over to ThemeForest and check out Metronic Html Template today!
#admin dashboard template#admin themes#angular#asp.net core#blazor#bootstrap#bootstrap 5#django#html#laravel#metronic#react#tailwind#tailwind css#vuejs
0 notes
Photo

Learn how you can integrate DataTable in ReactJS.
#datatable#react#reactjs#data table#frontend#websites#programming#code#responsive table#vintage style#design
0 notes
Link
Demo: https://demo.smarttutorials.net/free-reactjs-admin-template-using-bootstrap4-datatables-jvectormap/
Tutorial: https://smarttutorials.net/free-responsive-reactjs-admin-template-using-bootstrap-4-html5-css3-datatables-jquery-jvectormap/
This Free Responsive ReactJS admin Template are built using Bootstrap 4, HTML5, CSS3, Datatables, jQuery, Chartist.JS & jVectorMap.
#reactjs#react#javascript#html5#css3#html#css#admin-template#jvectormap#datatables-react#react-chart
0 notes
Text
How To Process Quality AI Training Data For Machine Learning?

Are you constantly thinking of AI for your company? Do you feel that there is a necessity for AI in the current business world? Do you wish to see a successful boost in return on investment for your business? Who doesn't? Everyone wants to see more profit, however, fuel is needed to run the vehicle. Do you possibly have a database? The majority of companies currently are struggling to create an AI-ready Data Set. It's not difficult to create a data set on your own, however, it is a bit out of the area for a lot of businesses. Let me help you find the right area.
AI Training Dataset is basically the collection of data. Data sets can be as an array of tables that contain all data from statistical studies or it could be in shape of matrice which is an arrangement of rectangular columns and rows. The columns represent a specific variable, while each row represents a particular member of the data set. It is essential to have training data sets since they are the primary component that makes a training algorithm work. There could be sudden failures with your work if the data set isn't high enough. The quality and amount of your machine learning training data has to do with the performance of your project as the quality of your data.
Training data is what's that is used to train machines to recognize patterns. AI assists them in learning the pattern and operate in similarly for each one. The creation of AI training Data is now in progress. The High-Quality AI training dataset fulfills all needs for a particular learning purpose in the most complex tasks.
We agree that AI has made the process of generation easier on its own hands, however there are situations in which annotating data must be based on some human judgments. The most important thing is that individuals come to a consensus conclusion as to which portion of recorded data is the correct one. So, making annotation guidelines may not be as simple as one would imagine. This is why our Quality Check team perfectly guides you through the process.
What is AI Training Data?
Do you think it's a difficult concept for the layman? I'll make use of simple words to help you understand the significance and function. It is basically information utilized to train the AI machines in recognizing a repetitive pattern. AI aids the machines to understand the patterns and work in exactly the same way when it comes to the pattern. The process of creating AI training Datat is in the process of being created. Quality AI training dataset fulfills all the requirements for an exact learning goal, even for the most challenging tasks.
The set of data doesn't contain only data collection for text. The overall Data Set Collection includes Image Dataset Collection, Video Dataset Collection, Speech Data Collection as well as Video Data Collection. Let's take an easy ride through these data sets.
1.Speech/Audio Data Collection-
Each human's voice and speech pattern is different. They differ in their intonation the pace, pronunciation, and the dialect. These aspects make it difficult to create artificially-generated Speech Recognition Dataset technology. AI Speech Data Collection recognizes the way people speak and pronounce the instructions for assistants to speak, the way people react and respond on speech recognition software, the way people pronounce and pronounce the pre-defined phrases, as well as how easily sentences are understood when used by people from different backgrounds and from distinct background noise. This constantly changing nature demands the best AI training for the audio systems you use.
2. Video Dataset Collection-
To develop AI-based surveillance motion detection or gesture-based guidance systems it is crucial to gather a large amount of quality training data. These include motion sequences, gestures scenes, sports and objects, animals and other. AI is focused on quality check videos, recordings of video as well as lighting conditions. It also has an extensive collection in video sets and customised training data.
3. Image Dataset Collection-
Every AI system has to be trained using appropriate and model-specific photo dates for recognizing and assessing images for machine learning purpose. It should cover a vast range in Image Dataset collection as well as annotations for every types of deep learning and machine learning applications. An extensive array of images must be made available in order to create computer vision models using the largest images and deep-learning images.
4. Text Dataset Collection-
Text Dataset Collection or OCR Training Dataset takes a much more than any other type of dataset collection. This collection requires an end-to-end number of languages. This is unique in it is the model of machine learning they aid to construct. It's not simple for machine learning models to process huge volumes of structured text data and work with it in this method. To get a better ROI, you need to have large quantities from multilingual texts are needed are required for you machine learning.
What does Quality of Data mean?
Do you remember when the teacher you were with handed your an examination? How did you respond? You've probably gathered all of the data related to this particular subject from reliable sources. Also, high-quality data analysis is based on the search for the best information to use in machine learning. It is not possible for every type of data you gathered to complete the project could be used for machine learning. The data you collect is of sufficient quality to be used in Machine Learning algorithms that drive the development of artificial intelligence.
We are confident in the quality and accuracy of our AI Training Data is determined by:
Accuracy - The accuracy of any data set is determined by comparing it with any data set of reference.
Completeness- Then, we must ensure the accuracy of our data to ensure that it doesn't contain any insufficient or missing values. There shouldn't be any loopholes that remain in our database.
Its timeliness - Data should not be out of date. It must be up-to-date.
Consistency- When does consistency persist in any data set? It's when data is in various storage areas and could be considered to be comparable.
Integrity- The final key area to consider is integrity. High integrity adheres to the syntax (format type, format range, format) of its definition.
Four-step process to guide the user to Data Cleansing
Establish the Benchmarks by eliminating unneeded observations - Every data set when combined with multiple datasets can result in redundant data. Eliminating duplicate observations aids in improving the accuracy of the data. Invalid and duplicate values have be eliminated.
Correct the structural data errors that occur when measuring, transferring data, or in other similar scenarios are known as structural errors. They can be caused by typos in the names of attributes and attributes, or the same attribute but with the wrong name, incorrectly labeled classes, i.e. distinct classes that should be the same , or with inconsistent the capitalization.
Take care of the outliers that aren't needed. Outliers are a source of trouble for several models. Let's say linear regression models are less tolerant of extreme outliers than the decision tree model. It is not advisable to remove outliers unless we have an actual reason to eliminate them. Sometimes, eliminating them can improve the performance. The result could be harmful for us. Thus, it is necessary to have an argument to eliminate the outliers, like unusual measurements that are not likely to be a part of the actual data.
Resolving Missing DataIn the case of missing data, Data could be very useful. It could be an indicator of something important. This is a difficult issue when it comes to machine learning. Your entire program could fail if you simply overlook the missing observation. We should be aware of missing data and flag it. Make use of the technique of marking and filling. This method will be beneficial to you.
Our Working Process
Consulting- GTS's experts will help you establish strategic business objectives and the results to your plan. The proper consultation is offered by clients in a series of meetings.
The Data Collecting / Data collection is the most important stage in creating OCR Datasets . Our team can assist you collect data employing a variety of methods and in-house experience as per the requirements.
Training as well as Data annotation The team is trained , and annotations are used to gain valuable insights to train AI.
Feedback and EvaluationOur goal is to make your satisfaction our main goal. So, all data is put through rigorous quality checks before being is then sent to final deployment in order to ensure that the accuracy is at a minimum.
0 notes
Text
What you'll learn The basics of the webpack bundling systemCreating a React app with webpackBuilding isomorphic React apps with ReduxBuilding a node express APISecure API authenticationMaintaining a session on the clientRedux datatables and forms with validationReusable Redux codeRedux completes the missing piece of the React framework, and is used at the core of React for most complex React projects. In this course, we’ll be focusing on leveraging the Redux framework to impose better engineering on React applications. Redux is an implementation of FLUX, which is a pattern for managing application state in React. Redux brings a clean and testable design to the table using a purely functional approach. In this course will build an app piece by piece, starting with a minimal webpack application and quickly transforming it into an isomorphic Redux application with full API integration, including secure authentication. About the author Sam Slotsky is a software engineer and saxophonist originating from Sioux City, IA. He attended the University of Iowa for Computer Science and Music and is currently employed by Ackmann & Dickenson, Inc. of Minneapolis, specializing in back-end web applications, databases, and JavaScript. Additionally, Sam has authored and contributed to open source packages for use with the React, Redux, Knockout, and Meteor framework. Cooking and playing chess are his favorite pastime activities.Husband and father of three, he writes software programs during the day, cooks in the evening, listens to jazz obsessively, and has a bit of a thing for cycling. Who this course is for:This is for people who want to really explore the ins and outs of real world Redux applications.
0 notes
Text
Mare - Material & React Admin Template
Mare – Material & React Admin Template
Yellowred anniversary special discount 30%. update v.1.0.2 -Add Atv cards in Card page -Node-sass update last version -fixed checkbox wave in datatables page update v.1.01 -fixed node-sass install on npm 8+ version -upgraged npm package SOURCE DOWNLOAD GET IT NOW DEMO BUY FOR $16

View On WordPress
#admin#antd#babel#chart#dashboard#ES6#google material design#material#material design#react#react js#reactjs#sass#semantic#webpack
0 notes
Text
Infy Technology | Bootstrap admin template | Affiliate Website Theme
Bootstrap admin template is a free, open source, Bootstrap 4 based admin theme perfect for quickly creating dashboards and web applications. It's modern design style with subtle shadows and a card-based layout could be described as flat material, and is inspired by the principles of material design along with a simple, attractive color system.
● A modern, material design inspired layout
● Focus on utility classes to minimize CSS bloat
● Custom card and button components
● Custom utility classes for extended functionality
● Layout built using flexbox for seamless responsive behavior
● Intuitive collapsible sidebar and top bar navigation structure
● Built using SASS for customization of Bootstrap default SASS variables
● Includes dependency management using npm
● Advanced workflow environment based on npm and Gulp with live reloading via browserSync
● Chart.js interactive responsive charts
● dataTables sortable, searchable tables
● Minimal use of jQuery and JavaScript to make it easier to rewrite using JS frameworks
● Latest Font Awesome 5 (free version)
this collection of the best Bootstrap admin templates can simplify this process for you. Not only do these packages contain stylish pre-built templates and demos for your dashboards and admin areas, but they have all been built to be readily customizable.
The tools in this collection contain multiple UI kits, ensuring you can add all the most important elements to your dashboards and admin pages. Some options also include several predefined color schemes to speed up the development process. Everything you need is likely to be found in these template packs.
If you want to ensure your dashboard pages have a design that will appeal to your target audience, this collection of Bootstrap admin templates will help you create the user interfaces your users deserve.
Admin templates are design mock-ups for an existing website admin panel to make it look appealing and easy to operate. Most of the modern admin dashboard designs are based on the Bootstrap 3 framework. It is convenient to use and easy to modify mobile-first framework.
Bootstrap is less of a javascript library and more of a CSS framework with some additional javascript widgets. There is nothing preventing you from using jQuery or some other javascript library of your choice (indeed, it may be required to get the functionality you need.)
The use case for Bootstrap is to get the product out the door without spending time worrying about how each control should look. It defines some standard styles for common elements/widgets and styles them to look good. It uses best practices and common sense to get a uniform look for everything.
When it comes to creating an admin template, Bootstrap is one of the best frameworks that are used to build free and premium templates. Bootstrap admin templates are in great demand. ... It is very easy to create a responsive web application using Bootstrap, thanks to the Bootstrap grid system and it is highly customizable.
As your business grows and the website starts getting more traffic you might want to make some of these changes to your website. There’s a whole lot of tasks that are done from the admin side of the site.
Admin templates are simply HTML markups of designs that are suited for an admin side application. Admin templates come equipped with powerful UI components, widgets, forms, tables, charts, pages, and applications. So rather than creating your interface from scratch, you can purchase them and integrate with your web application. And the rest of the back-end coding can be started right away.
When it comes to creating an admin template, Bootstrap is one of the best frameworks that are used to build free and premium templates. Bootstrap admin templates are in great demand. Bootstrap has a wide range of UI components that can be extended easily using plugins and add-ons. With Bootstrap you don’t need to code from scratch because you can get ready-made blocks of code. It is very easy to create a responsive web application using Bootstrap, thanks to the Bootstrap grid system and it is highly customizable. Also, Bootstrap has got great browser compatibility.
With Bootstrap you don’t need to code from scratch because you can get ready-made blocks of code. It is very easy to create a responsive web application using Bootstrap, thanks to the Bootstrap grid system and it is highly customizable. Also, Bootstrap has got great browser compatibility.
There is an overwhelming amount of free and premium 20 Free Bootstrap 3 Admin Dashboard Templates Bootstrap admin templates available on the internet in different marketplaces. The premium admin templates often provide more in terms of plugins, animations, the quality of the UI. So a premium template has the design that you require, then a few amount of money is what will cost you to save a lot of design and development time.
But that doesn’t mean that free bootstrap admin templates are necessarily any less than premium ones. There are a lot of free admin templates that can easily compete with premium ones. If you have knowledge and experience in developing, then working with a free admin template will be a piece of cake.
The latest version of Bootstrap, Bootstrap 4 beta, is not production-ready yet. But you can find free admin templates for Bootstrap 4 also. You can use them, but not in production as per recommendation, to not fall behind with the advancements that the newest version provides. But if you need a stable version of Bootstrap you can stick to Bootstrap 3.
Bootstrap admin templates along with javascript libraries such as AngularJS and ReactJS helps you get best out of your Angular or React projects.
0 notes
Link
More and more developers are currently deciding to boost their workflow, minimize unnecessary tasks, and structure their virtual desks through admin panels with Node.js backend. Why Node.js you may ask? Node.js is a JavaScript runtime environment. That means that the main advantage of using this platform is that you can have frontend and backend in one programming language. That allows you to synchronize the data in both parts of your app. That speeds up the development process significantly. Admin template with Node.js backend not only provide you with ready frontend part of your application but also include some pre-made backend. Various login methods, product management, CRUD application, PostgreSQL can be already integrated with the admin panel. There’s no secret that becoming bigger, better and stronger within your development role requires some form of a switch or shift, in order to allow you to work productively. There’s a big difference in being productive and being busy, although the main key to effectively engage in this type of switch, is to equip yourself with the accurate tools. Today, we’ll do just that. We’re going to bounce through five various admin templates with Node.js backend, in order for you to improve your developing-productivity today. Light Blue React Node.js is a React admin template integrated with Node.js backend and PostgreSQL. It’s an extremely good fit for anyone looking to build E-Commerce apps, CMS, SASS web apps, CRM, etc. since it contains ready-to-use working Authentication, Social Login and Product Management components. The template also comes with 60+ ready-to-use and customizable UI components. In order to get started, all you need to do is to deploy the app and you’re good to go. Features PostgreSQL integrated CRUD Application 60+ ready-to-use and customizable UI components React 16.5.2 Deep Background 8 Chart Libraries E-Commerce section Pricing: $99.95 Learn more Demo Documentation For this admin template, Creative Tim partnered with Udevoffice to provide a fully coded “frontend + backend” solution. It features a great number of components in order to help you create any website you desire. The main benefit of this dashboard is it provides a lightweight, fast, scalable and modern way to build your app. Features 16 customized plugins 200 handcrafted elements 25 example pages SASS Files Sketch Files Pricing: $149 Learn more Demo Documentation Sing App Vue Node.js is an admin template integrated with Node.js backend and Postgres database. Product management pages and various login methods already implemented and ready to use. The app is ready to be deployed to any amazon aws, heroku, etc. It will be a great starting point if you are building SAAS, CMS, E-commerce applications and want to save time and money. You’ll also be greeted with 60+ ready-to-use and customizable UI components. Features 60+ ready-to-use and customizable UI components The latest version of Vue.js CRUD Application PostgreSQL integrated Theme Support E-Commerce Section Static & Hover Sidebar Pricing: $99.95 Learn more Demo Documentation This bundle is the a minimal package of ngx-admin integrated with Node.js backend. It contains JWT Authentication for both UI and Backend and Basic User Management. You’re able to choose from two different bundles based on your needs: the Starter Pack or the E-Commerce Kit. E-Commerce Kit has some additional features such as order details page and sample order table. The dashboard is based on Angular ngx-admin, Express REST API, MongoDB, and other popular and useful technologies. If are searching for documentation for this template, you should know that documentation is supplied with deliverable archive. Features Angular and Node.js Projects ExpressJS, MongoDB Intergration Public and JWT secured API endpoints Auth/Register/Password recovery forms and APIs Profile page CRUDL Pricing: $39 – $140 Learn more Demo Lexa is built with Bootstrap 4, Node.js and JQuery. It’s a fully responsive and have the clean user interface that includes a great collection of components, widgets, and UI elements. Horizontal layout of this admin template is looking good, this is a very nice peculiarity. Lexa has maintained a very high-quality code for all versions so developers can easily customize it according to their requirements. It is a flexible admin template and can be used to build all kinds of projects. Features Horizontal & Vertical Layouts Node version 9.11.2 SASS Support Login, register, error pages Calendar view Form validation Invoice with ready print button Directory List page Google maps Drop zone file upload Summernote Editor 6+ Charts Library Datatables Pricing: $22 Learn more Demo Originally published at https://flatlogic.com/blog/top-5-admin-templates-with-node-js-backend/
0 notes
Link
dhamaniasad starred gregnb/mui-datatables Jul 18, 2019
gregnb/mui-datatables
Datatables for React using Material-UI - https://www.material-ui-datatables.com
JavaScript 808 6 issues need help Updated Jul 18
0 notes
Link
Article URL: https://blog.kenforthewin.com/bring-datatables-to-react-redux/
Comments URL: https://news.ycombinator.com/item?id=16557019
Points: 11
# Comments: 2
0 notes
Text
New top story on Hacker News: Show HN: DataTable for React-Redux
Show HN: DataTable for React-Redux 4 by kenforthewin | 1 comments on Hacker News. from Blogger http://ift.tt/2DgiQum
0 notes
Link
One of my most frequently-used open-source tools is datatables.net, a jquery-based interactive table with dynamic sorting and searching. I sought to bring the simplicity of that project's serverside API to React, using Redux to handle state changes. The result is redux-remote-datatable. I limited th... http://ift.tt/2Hm64Ng
0 notes
Text
Data Visualization With DataTables.js and Highcharts.js
In this tutorial, you’ll learn how to visualize data by taking advantage of the DataTables.js and Highcharts.js JavaScript libraries.
Here’s what we're going to build (check out the larger version for a better experience):
Required Libraries
For the purposes of this example, we’ll have to load the following libraries in our pen:
jQuery
DataTables.js
Highcharts.js
With that in mind, if you look under the Settings tab, you’ll see that I've included one external CSS file:
In the same way, I've also included four external JavaScript files:
Note: we had to add jQuery to our project because DataTables.js is a jQuery plugin. However, keep in mind that Highcharts.js is a pure JavaScript library, and thus doesn’t require jQuery.
The HTML
To kick things off we define an element with the class of container which contains two sub-elements:
A table with 26 rows. The first row refers to the table headers th, while the other 25 rows carry country details. The source of our data for this example is worldometers.info.
An empty div which will hold the chart.
Here’s the HTML structure:
<div class="container"> <table id="dt-table"> <thead> <tr> <th>Country</th> <th>Population (2017)</th> <th>Density (P/Km²)</th> <th>Med. Age</th> </tr> </thead> <tbody> <tr> <td>China</td> <td>1,409,517,397</td> <td>150</td> <td>37</td> </tr> <!-- 24 more rows here --> </tbody </table> <div id="chart"></div> </div>
It’s worth mentioning that, for the sake of simplicity, we’ve specified the aforementioned hard-coded table data. In a real project though, the table might be created dynamically.
With the markup ready, and a background color added for clarity, the project looks like this:
The CSS
At this point, we define some basic styles, like so:
.container { display: flex; flex-wrap: wrap; align-items: center; padding: 0 10px; } #dt-table_wrapper { width: 35%; margin-right: 2%; } #chart { width: 63%; } table { text-align: left; } @media screen and (max-width: 1200px) { #dt-table_wrapper, #chart { width: 100%; } #dt-table_wrapper { margin-right: 0; } }
It’s important to understand that:
The #dt-table_wrapper doesn’t exist in our markup. It’s added by the DataTables as soon as we initialize it.
While we define a few basic rules for small screens, note that the demo won’t be fully responsive. There are a lot of things we can do to make the table and chart look better on small screens. For example, for DataTables there’s a Responsive extension available, but that’s beyond the scope of this tutorial.
With the CSS in place, let’s see how the project looks. We won’t see a big difference yet because we haven’t initialized the libraries:
The JavaScript
Now for the JavaScript window in our pen. When the DOM is ready, the init function is executed; this function triggers other sub-functions:
function init() { const table = $("#dt-table").DataTable(); const tableData = getTableData(table); createHighcharts(tableData); setTableEvents(table); }
As you’ll see, each of these sub-functions accomplishes a certain task.
Initializing DataTables
The first step is to convert our table into a “DataTables” table. We can do this with just one line of code: $("#dt-table").DataTable();
If we now look at the table, we’ll notice that it has adopted the capabilities of a DataTables table, ie: we can sort it, search it, and so on. Have a play with it in the following demo:
Now, as you can see, DataTables applies a default sorting to the table. If needed, we can customize this behavior.
Extracting Table Data
The next step is to grab the table data and build the chart. We don’t want all the table data. In fact, if you look back at the finished version of our demo, you’ll notice that the chart only contains data from the first three columns (Country, Population, Density).
With that in mind, in order to retrieve the required data, we’ll take advantage of the DataTables API. The function responsible for this behavior is the following one:
function getTableData(table) { const dataArray = [], countryArray = [], populationArray = [], densityArray = []; // loop table rows table.rows({ search: "applied" }).every(function() { const data = this.data(); countryArray.push(data[0]); populationArray.push(parseInt(data[1].replace(/\,/g, ""))); densityArray.push(parseInt(data[2].replace(/\,/g, ""))); }); // store all data in dataArray dataArray.push(countryArray, populationArray, densityArray); return dataArray; }
Inside this function, we iterate through the table rows and for each row, we grab the target column data and store them in the associated arrays. Finally, all those arrays are stored inside another array.
Here’s a quick visualization of the master (i.e. dataArray) array:
Before moving on, it’s important to understand one thing. By default, the getTableData function should collect data from all the table rows. But then, if we search the table for something specific, only the rows that match should be collected and processed. To accomplish these things, we pass an argument to the rows function. Specifically, an object with the search: "applied" property value.
Again note that if we don’t pass this object, we’ll always collect data from all the table rows (test it). For more information about the properties that we can pass to this object, be sure to look at this page.
Building the Chart
Now that we have the desired data, we’re ready to build the chart. This will contain two nested charts, one Column chart and one Spline chart.
Here’s the corresponding function:
function createHighcharts(data) { Highcharts.setOptions({ lang: { thousandsSep: "," } }); Highcharts.chart("chart", { title: { text: "DataTables to Highcharts" }, subtitle: { text: "Data from worldometers.info" }, xAxis: [ { categories: data[0], labels: { rotation: -45 } } ], yAxis: [ { // first yaxis title: { text: "Population (2017)" } }, { // secondary yaxis title: { text: "Density (P/Km²)" }, min: 0, opposite: true } ], series: [ { name: "Population (2017)", color: "#0071A7", type: "column", data: data[1], tooltip: { valueSuffix: " M" } }, { name: "Density (P/Km²)", color: "#FF404E", type: "spline", data: data[2], yAxis: 1 } ], tooltip: { shared: true }, legend: { backgroundColor: "#ececec", shadow: true }, credits: { enabled: false }, noData: { style: { fontSize: "16px" } } }); }
Don’t be overwhelmed by the code above! Without doubt the best way to understand how it works is to try it. Plus, you should definitely read the documentation. Anyhow, let’s briefly highlight the key concepts:
The x-axis contains all the countries.
We define two y-axes. The first one holds all the population values, while the second one includes all the available densities.
If our chart doesn’t contain any data a message appears. Note that we’re able to customize the message text through the lang object.
With the charts in place, let’s again look at our progress:
Synchronizing the Table and Charts
In the previous section, we built the chart based on the table data, but there’s still no full synchronization between the table and chart. To prove it, go back to the last demo and change the ordering (sorting) of the table, or search for something. You’ll notice that the chart doesn’t react to table changes.
To fix this, we’ll take advantage of the DataTables draw event. This event fires each time the table gets updated. So as soon as we modify the table we should recollect the table data and reconstruct the chart.
Here’s the tricky thing though. The draw event also fires during the table pagination; there’s no reason to rebuild the chart during this process. Ideally, we should prevent this behavior. Thankfully, there’s the page event which helps us accomplish this task.
Here’s the code that implements the desired functionality:
let draw = false; function setTableEvents(table) { // listen for page clicks table.on("page", () => { draw = true; }); // listen for updates and adjust the chart accordingly table.on("draw", () => { if (draw) { draw = false; } else { const tableData = getTableData(table); createHighcharts(tableData); } }); }
Now that both table and chart are synchronized, if we make a “bad” search, we’ll see the following messages:
The final version of our project:
Browser Support
Both plugins have great browser support (DataTables support, Highcharts support), so you can expect that this demo will work well in all recent browsers.
Again keep in mind that this demo isn’t optimized for small screens.
Lastly, as usual, we use Babel to compile the ES6 code down to ES5.
Conclusion
That’s it folks! We managed to visualize our data by combining two popular and powerful JavaScript libraries.
Now that you’re familiar with the process, go ahead and elaborate the functionality of the final demo. For instance, try to add custom filters to the table.
As always, if you have any questions or if there’s anything else you would like to see as a next step to this tutorial, let me know in the comments below.
via Envato Tuts+ Code http://ift.tt/2ikGbCL
0 notes
Text
angularjs, datatables, React, vue, jQuery https://t.co/SaNChbbQIf #blog
— JavaScript Facts (@mentallion) July 6, 2017
0 notes
Photo

This week's JavaScript news, issue 326
This week's JavaScript news — Read this e-mail on the Web
JavaScript Weekly
Issue 326 — March 16, 2017
Please note JavaScript Weekly will be moving to a new 'From' address soon - it will be [email protected] in case you have any filters or whitelists to update :-) Thanks!
An Animated Intro to RxJS
RxJS is a library for composing asynchronous, event-based code around observing and handling changing values over time.
David Khourshid
ECMAScript 2017 and Beyond (A 1 Hour Talk)
Filmed at The Rolling Scopes conference in Belarus, Axel gives a very thorough tour of the ECMAScript proposals process and forthcoming features.
Dr. Axel Rauschmayer
Quokka: A Live Scratchpad for JavaScript in VS Code
Want to do a quick experiment in isolation? Quokka.js is a rapid prototyping tool that works within VS Code (but with more editors coming soon).
Artem Govorov
New Course: ⚛️ A Complete Intro to React w/Router v4, Redux & more
Much more than an intro, build an entire real-world web application in layers with Brian Holt (Netflix) using React and library ecosystem like Router v4, Redux and Jest.
Frontend Masters Sponsor
A Dive Into Preact's Internals
A series of posts digging into the inner workings of Preact, a 3KB React alternative with the same API. (Part 2 covers the component model.)
Adam Solove
Understanding Component Architecture: Refactoring an Angular App
Jurgen van de Moere takes an existing Angular 2+ app and refactors it into a more modular component architecture.
Sitepoint
The Observables Proposal for ECMAScript
There’s an ECMAScript proposal for Observables ready to progress to stage 2. Nicolás Bevacqua looks at what it could bring to JavaScript.
Nicolás Bevacqua
Eagle.js: A Hackable Slideshow Framework Built with Vue.js
Supports animations, themes, and interactive widgets, and makes it easy to reuse slides and styles across presentations. Live demo.
Zulko
Jobs
Senior Front-End Developer at Catawiki (Amsterdam or Assen)Our mission is to make special items available to everyone. We offer a unique opportunity to join our team and improve the experience for millions of our users with an iterative, small-step approach through A/B testing. Catawiki
Software Engineer, Web - Zürich, SwitzerlandCentralway is seeking an experienced programmer to come and join the team. The right candidate will be responsible for building and maintaining high performance web applications with cutting-edge technologies. Centralway Numbrs
Front End Engineer at VSCO (Oakland, CA)We're looking for a Front-End Engineer who can face unique challenges in implementing web designs and craft great accessibility for users. VSCO
Can't find the right job? Want companies to apply to you? Try Hired.com.
In Brief
How setTimeout() Behavior Has Changed in Firefox news Changes to how callbacks are scheduled are making things smoother. Ben Kelly
testdouble.js 2.0 Released: A Great Mocking Library for JS news
Pro Ember.js: An advanced 2-day training event in Berlin course We'll tackle progressive web apps, modular architecture patterns, performance tuning, authentication and more. simplabs Sponsor
Why WebAssembly is Faster Than asm.js tutorial Alon Zakai
Communicating Sequential Processes: An Alternative to Async Generators tutorial Dr. Axel Rauschmayer
How to Create an Angular App and Add Styling with Kendo UI tutorial Tara Manicsic
End-to-End Testing Vue.js Apps with TestCafe tutorial Aligator
Randomizing SVG Shapes with JavaScript tutorial Chris Coyier
Writing a JavaScript Framework: The Benefits of Custom Elements tutorial Bertalan Miklos
How to Build A Live Comment Feature using JavaScript and Pusher tutorial Rahat Khanna
Master Fullstack Development (50% off for JS Weekly readers) course Learn how to build full stack apps with React, Angular, Node, Django and Rails with Thinkster. Use the JS Weekly coupon before Sunday for 50% off. Thinkster Sponsor
console-importer: Import JS and CSS Resources from Chrome's Console tools e.g. $i('jquery') will bring jQuery into play. pd4d10
Top 5 jQuery UI Alternatives tools Simon Codrington
React Router v4: Declarative Routing for React.js code Don’t forget we have a React newsletter too :)
Fetch Inject: Dynamically Inline Assets Into The DOM using Fetch Injection code Here’s an introduction and explanation. Josh Habdas
ngx-datatable: A Full-Featured Data-Table Angular Component code No external dependencies. Demos here. Swimlane
neurojs: A Deep Learning and Reinforcement Learning Library code Jan Hünermann
RxDB: A Reactive Client-Side Offline-First JavaScript Database code Daniel M
Planck.js: A Pure JS Rewrite of Box2D's Physics Engine code For cross-platform HTML5 game development. Demos. Ali Shakiba
Curated by Peter Cooper and published by Cooperpress.
Like this? You may also enjoy: FrontEnd Focus : Node Weekly : React Status
Stop getting JavaScript Weekly : Change email address : Read this issue on the Web
© Cooperpress Ltd. Office 30, Lincoln Way, Louth, LN11 0LS, UK
by via JavaScript Weekly http://ift.tt/2mzDDkX
0 notes