#energy sources
Text

Patagonian fungus produces myco-diesel from cellulose (Montana State University)
Article from MercoPress
#energy#energy sources#fungi#fantastic fungi#mushrooms#mycology#fungus#msu#forest photography#fungiphotography#wild fungi#useful fungi#patagonia
86 notes
·
View notes
Text
POLE STARS

#cinema4d#cinema4dart#processesproject#artists on tumblr#cinema4drender#3dcg#conceptart#original concept#digitalartists#3dblr#redshiftc4d#redshiftrenderer#redshift3d#after effects#aftereffectsedit#dystopia#power plant#energy sources#futuristic#oc artist
23 notes
·
View notes
Text
The life source of humanity

#alien art#aliencore#aliens#sourceenergy#cosmos#cosmicconnection#quantum#quantumhealing#midjourney#ai artwork#ai art#aiartist#starseed#lightworker#dolores cannon#the universe#aurora#aurora borealis#energy#energy sources#reincarnatedsoul#reincarnation#incarnation#utopia#futuristic#futurism#future
13 notes
·
View notes
Text
Power generation from renewable energy resources plays an essential role in Europe’s transition to a decarbonized energy system.
The European State of the Climate (ESOTC) report reveals that a record 43% of actual electricity generation in Europe came from renewable sources, up from 36% in 2022. For the second consecutive year, energy generation from renewables overtook the generation from polluting fossil fuels. The largest source is biomass, which is not covered in this report. Until 2018, hydro-power was the second largest renewable energy source, but that position has now been taken by wind power. The total installed capacity of wind and solar power has been steadily increasing over the past two decades.
Renewable energy resources and electricity demand are highly sensitive to climatic conditions, which are subject to long-term trends and fluctuations on timescales ranging from days to decades. With Europe’s increasing move to renewable resources for its electricity supply, monitoring and understanding their temporal and spatial variability, and how they may be changing in a warming climate, is becoming more vital. It is important to assess how these variations affect both the demand for electricity and the potential for renewable energy generation.
This section provides an overview of actual electricity generation in Europe in 2023. It then explores the implications of climate conditions for potential power production for onshore wind power, solar photovoltaic (PV) and run-of-river hydropower, and on electricity demand. Only climate-dependent variations are taken into account; all other factors, such as variations due to improvements in the efficiency of the technology, are taken as constant. Other assumptions, such as the homogenous distribution of production units for wind and solar power across Europe, are also made. Potential power generation is represented as capacity factor (CF) – the ratio between the average power potentially delivered and the theoretical maximum power. CF ranges in value between 0, when no power is delivered, and 1, when the delivered power is equal to the theoretical maximum power of the system.
Measured electricity generation and demand in 2023
Figure 1a. Percentage of the total actual annual electricity generation from 2016 to 2023 for Europe, from solar (yellow), wind (purple) and hydro (blue) power, and other sources, including other renewables and fossil fuels (grey). Total generation in TWh is shown in Figure S1[5]. Data source: ENTSO-E and Elexon.
In 2023, electricity demand across Europe was the lowest in eight years, at around 2.6 PWh. The year saw a record share of electricity generation from renewables, at around 43%, with 17% from hydropower, 18% from wind power and 7% from solar power. Solar and wind energy tend to follow a complementary seasonal cycle: solar power generation is naturally highest during spring and summer, while wind power produces more electricity in autumn and winter.
Climate-driven electricity demand and potential for generation in 2023
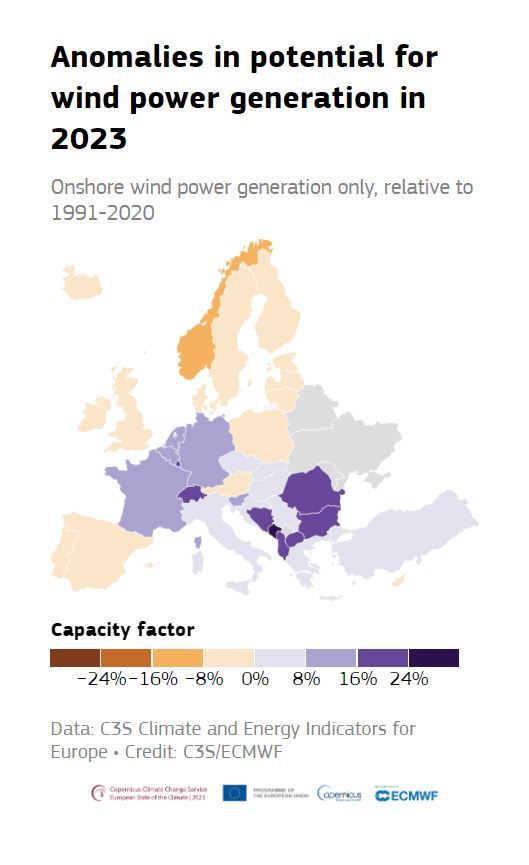
Figure 2. Anomalies (%) in potential electricity generation from three renewable sources in 2023: onshore wind capacity factor (top left), solar photovoltaic capacity factor (top right), run-of-river hydropower capacity factor (bottom left); and in climate-driven electricity demand (bottom right). All anomalies are relative to the average for the 1991–2020 reference period and expressed as a percentage of this average. Countries shaded in grey are those for which no data are available, except for solar PV for which these countries are not shown. Data source: C3S Climate and Energy Indicators for Europe.

The climate-driven electricity demand in countries in central and eastern Europe was close-to or below average for the year as a whole. This is consistent with warmer-than-average temperatures experienced across much of Europe, notably during the winter and autumn, and a corresponding reduced demand for heating. Conversely, climate-driven electricity demand was above average in parts of southern Europe, particularly Spain and Italy, and in Norway and Sweden. In southern Europe, this was largely due to high summer temperatures, leading to increased demand for cooling; in Scandinavia, it was linked to the well-below-average temperatures experienced during several months that increased the demand for heating. More on temperature conditions can be found in the ‘Temperature’ and ‘Contrasting summer’ sections.

Potential electricity generation from wind was above average in central and southeastern parts of Europe, and below average in Spain, the UK, Iceland, Fennoscandia, and parts of northeastern Europe.

Potential electricity generation from solar was below average in northwestern and central parts of Europe, and above average in southwestern and southern Europe, and Fennoscandia. Solar CF is closely related to surface solar radiation, but other technological factors also play a role. For example, while solar radiation was well above average across much of northern Europe in May and June, the potential for solar generation was not as high, as not all solar radiation is converted into power, particularly at high temperatures. Therefore, averaging across the year results in lower potential power generation from solar PV, compared to the anomalies in solar radiation.
For run-of-river hydropower, potential electricity generation was above average across much of Europe, except for Spain, Norway and Romania. This largely reflects regional anomalies in precipitation. Similarly, the month-to-month variability in hydropower CF, discussed below, reflects anomalies in monthly average river flow across the European river network.
Variability throughout the year
Potential power generation from renewable sources and climate-driven electricity demand both change throughout the year, due to variability in weather and climate. Below, June and November are discussed, to demonstrate this variability between warmer and cooler times of year.
Onshore wind power
Figure 3. Average onshore wind power capacity factor anomaly (%) for June 2023 (left) and November 2023 (right), relative to the respective monthly average for the 1991–2020 reference period and expressed as a percentage of this average. Countries shaded in grey are those for which no data are available. Data source: C3S Climate and Energy Indicators for Europe.
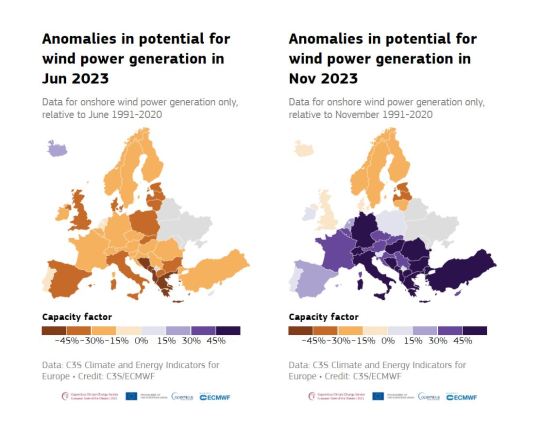
In June, wind power CF was below average across Europe, except for Iceland, with the largest anomalies observed in Serbia, Bosnia and Herzegovina, and Albania, at up to 64% below average. This reflects below-average wind speeds across all but northeastern Europe and Iceland. In contrast, November saw well-above-average wind power CF anomalies across central and southern parts of Europe, and below-average anomalies in Fennoscandia, the United Kingdom and Iceland. This is consistent with above-average wind speeds observed across most of Europe in the last three months of 2023, associated with storm activity.
Solar photovoltaic
Figure 4. Average solar photovoltaic capacity factor anomaly (%) for June 2023 (left) and November 2023 (right), relative to the respective monthly average for the 1991–2020 reference period and expressed as a percentage of this average. Countries with no data available are not shown. Data source: C3S Climate and Energy Indicators for Europe.
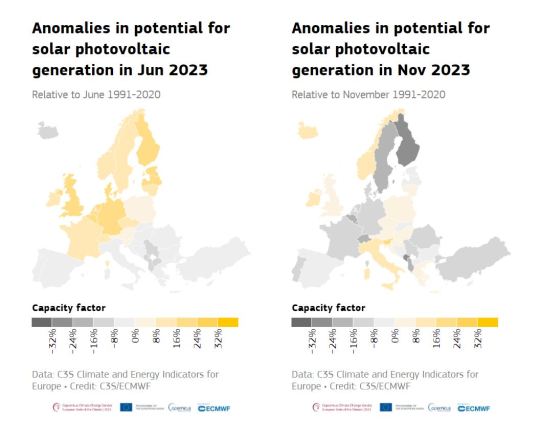
For solar PV power, June saw above-average CF across most of central and northern Europe, and below-average CF across southern Europe and Iceland. This reflects a contrast in surface solar radiation seen across Europe in June. During this month, positive surface solar radiation anomalies, of up to 70 W/m2, were seen in parts of central Europe and Scandinavia, and negative anomalies, as low as -40W/m2, in southern Europe. In November, the solar CF anomalies also corresponded to anomalies in surface solar radiation. Below-average solar radiation and solar PV CF were seen across central Europe, and particularly the Alps, and parts of southeastern Europe and eastern Scandinavia.
Run-of-river hydropower
Figure 5. Average run-of-river hydropower capacity factor anomaly (%) for June 2023 (left) and November 2023 (right), relative to the respective monthly average for the 1991-2020 reference period and expressed as a percentage of this average. Countries shaded in grey are those for which no data are available. Data source: C3S Climate and Energy Indicators for Europe.

In June, below-average run-of-river hydropower CF was seen across much of Europe, while Italy saw well-above-average run-of-river hydropower CF. This reflects positive precipitation anomalies and above-average river flows in Italy in May and June. In November, run-of-river hydropower CF was above average across most of Europe. For most areas, it was 10–20% above average, but it was as much as 57% above average in Portugal and 39% in Switzerland, associated with well-above-average precipitation anomalies and high river flow. The exceptions were Norway and Romania, where slightly-below-average run-of-river hydropower CF was observed, linked to slightly-below-average river flow. More on hydrological conditions in Europe can be found in the ‘Precipitation’ and ‘River flow’ sections.
Climate-driven electricity demand
Figure 6. Average climate-driven electricity demand anomaly (%) for June 2023 (left) and November 2023 (right), relative to the respective monthly average for the 1991–2020 reference period and expressed as a percentage of this average. Countries shaded in grey are those for which no data are available. Data source: C3S Climate and Energy Indicators for Europe.

Climate-driven electricity demand can be linked to factors such as a reduced need for heating when temperatures are warmer than average during winter, and increased need for air conditioning when temperatures are warmer than average during summer.
While the climate-driven electricity demand for the year as a whole was generally below average, it was slightly above average in June across much of western and central part of Europe. These areas correspond to those that saw above-average temperatures during June. However, warmer-than-average temperatures over Scandinavia in the same month corresponded to slightly below-average demand. Later in the year, demand over northern Europe was generally above average. From October to December, temperatures in Scandinavia were much colder than average, reflected in well-above-average demand. In November, however, southern Europe saw below-average demand associated with above-average temperatures for the time of year.
Changes in energy statistics through 2023
While climate conditions can drive demand for additional energy, to some extent they can also compensate through increased potential to generate power. For example, in summer, demand can be higher, but this can be balanced out by additional solar power generation.
Comparison of energy statistics aggregated over a region can highlight links and compensation between climate-driven electricity demand and renewable power resources at a larger geographical scale than that of individual countries[8]. Here, statistics are reported for a region of central Europe, defined here as France, Belgium, Luxembourg, the Netherlands, Germany and Switzerland. These countries are chosen because of their relatively similar climatic conditions in 2023.
Figure 7. Changes in energy statistics for run-of-river hydro-power capacity factor (CF), solar photovoltaic CF, onshore wind CF and anomalies in climate-driven electricity demand for each day in 2023. The daily average CF for the 1991–2020 reference period is indicated by the dashed grey line. Climate-driven electricity demand is expressed as a percentage of the 1991–2020 reference period. Values are averaged across a region of central Europe (here defined as France, Belgium, Luxembourg, the Netherlands, Germany and Switzerland). Data source: C3S Climate and Energy Indicators for Europe.
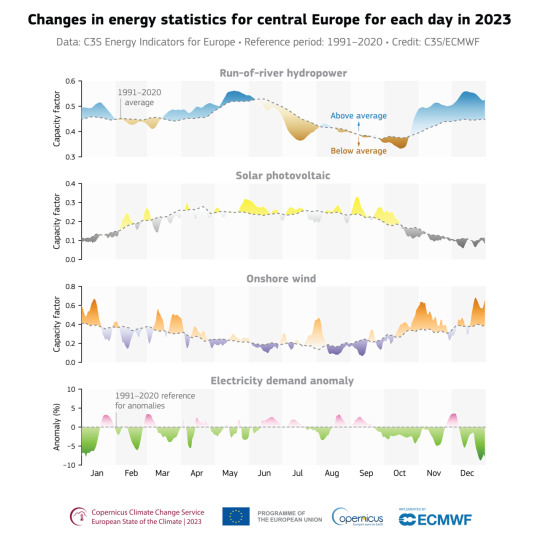
Averaged across six central European countries, the climate-driven electricity demand was below average for most of the year. January, February, October and December saw the largest negative anomalies, with daily values reaching around 7–9% below average in January and December. The lower demand reflected the higher-than-average temperatures during these months and the associated reduced demand for heating. Apart from two weeks in late November and early December, demand was persistently below average from late September until the end of the year.
Climate-driven electricity demand was most above average at the end of January, and in early March, late August, and early December; up to around 3.5% above average during all these periods. The two longest periods of above-average demand were early June to mid-July and mid-August to mid-September. These periods coincided with above-average summer temperatures and the associated demand for air conditioning.
Solar PV CF was above average during several periods in February, May, September and October. September saw the largest positive monthly anomaly, of 18% above average, with daily CF values reaching around 0.3. The increased solar PV CF in September partially compensated for the higher electricity demand.
Onshore wind CF was variable during 2023, but generally above average. There was a long period of above-average CF throughout October and November, which saw daily CF values peaking at around 0.65. November also saw the largest monthly onshore wind CF anomalies, at around 45% above average for the month as a whole. This increase in onshore wind CF was associated with storm activity across much of Europe. February, June and a period from mid-August to the beginning of October saw below-average onshore wind CF, except for a short period of slightly above average anomalies in mid-September. November’s storms continued into December; the associated above-average precipitation and river flow led to above average run-of-river hydropower CF during these two months. At its peak, it reached almost 20% above average, after being close to average for much of the year. July was the only month that saw below-average hydropower CF; as much as 12% below average for the month as a whole.

Monitoring wind, solar , and hydropower is crucial for optimizing the potential for renewable energy generation. Accurate climate monitoring supports strategies to accelerate the transition to sustainable energy sources, fostering both environmental protection and economic growth.
#climate-driven electricity demand#clean energy#capacity factor (CF)#potential power production#onshore wind power#solar photovoltaic (PV)#run-of-river hydropower#and on electricity demand.#energy transition#renewable energy sources#energy sources
0 notes
Text
Strengthening Swiss hydropower with science - Technology Org
New Post has been published on https://thedigitalinsider.com/strengthening-swiss-hydropower-with-science-technology-org/
Strengthening Swiss hydropower with science - Technology Org
Researchers at ETH Zurich, led by Robert Boes, are developing specific solutions to optimise electricity production from Swiss hydropower plants. This will ensure that hydropower remains the backbone of Switzerland’s electricity supply in the future.
“Although Swiss hydropower is a proven technology, we must constantly work on optimising it. If we don’t, electricity production and storage at existing plants will slowly erode,” explains Robert Boes, who has headed the Laboratory of Hydraulics, Hydrology, and Glaciology at ETH Zurich since 2009. This is because reservoirs, in particular, have a natural tendency to shrink due to rubble and gravel. Sediment in the waterways inevitably leads to wear and tear on the turbines over time.
ETH Zurich researchers have spent several years tackling these and other challenges: they have developed solutions for efficient water management, calculated maintenance strategies for turbines, and shown which locations have the potential for making the most effective and eco-friendly use of hydropower. This is how they are ensuring that hydropower remains the backbone of Switzerland’s electricity supply in the future – especially in winter, when photovoltaic systems generate less power.
Better water management for run-of-river power plants
There are 11 run-of-river power plants along the 36 kilometres that the River Limmat flows from Lake Zurich until it meets the River Aare. Lake Zurich resembles a large head reservoir through which water is drained into the Limmat. The authorities use the weir system at Zurich’s Platzspitz park to regulate the level of Lake Zurich and thus also how much water flows into the river. Besides playing a role in flood protection, navigation and ecology, this water level is particularly relevant for electricity production.
Boes and his research team recently showed in a study that optimised weir regulation at Platzspitz could allow around 2 percent more electricity to be generated in the power plants along the Limmat. This increase in efficiency would arise from a new management strategy that, first, permits lake water levels to be higher under today’s regulations and, second, uses weather models to better adjust water level regulation in Lake Zurich to expected precipitation and inflow volumes.
Zurich’s Platzspitz weir at the confluence of the Limmat and Sihl rivers. Image credit: Canton of Zurich
As a general rule, the more evenly the water flows into run-of-river power plants, the more electricity they can produce. Especially in the case of small and medium levels of high water, the new regulations would make better use of the additional water present. “If the weather model predicts heavy rain, the smart weir system would release a little more water into the Limmat ahead of time. Then, when the predicted rain arrives, the lake would have more of a buffer and could continue to release water evenly into the Limmat despite the heavy rainfall,” Boes explains. This would prevent the turbines from being overloaded by too much water. Of course, water managers would still have to comply with high-water regulations as well as ecological and other requirements.
Similar adaptations would also be possible on other rivers on the Swiss Plateau downstream of Alpine lakes. Boes and his team have calculated that electricity production from run-of-river power plants could be increased by around 100 gigawatt hours per year if weir systems were managed more intelligently. This would be enough to meet the annual electricity needs of around 25,000 four-person households.
Protecting turbines more effectively against sediment
The fine silt that rivers carry is the natural enemy of every hydropower turbine. It acts like sandpaper, causing turbines to wear out over time and generate significantly less electricity. Although this problem has been known for a long time, it has still not been fully resolved. While many power plants feature what are known as sand traps, these often fail to remove enough of the tiny particles from the water.
To increase the sand traps’ effectiveness, and thus protect the turbines and avoid production losses, Boes and his team investigated which types of trap are particularly effective: “Long traps with a gentle bottom gradient, which make the water flow as slowly as possible, work best. They let the particles settle more easily to the floor,” Boes says. These findings have already been used to improve the sand trap at the Susasca hydropower plant in Graubünden. However, longer traps also require more building materials and take up more space, making them expensive. As a result, decisions on which structural adaptations make economic and technical sense will differ from power plant to power plant.
Boulder bypasses for reservoirs
Weather-related erosion causes stones, gravel and other sediments to enter reservoirs via their water intake and reduce their storage volume. This problem, known as sedimentation, could reduce the storage capacity of Swiss reservoirs by around 7 percent by 2050. Today, small and medium-sized reservoirs use bypass tunnels as a structural measure against sedimentation. These tunnels guide stones, gravel and silt past the dam wall during floods. However, since floodwaters carry a great deal of sediment, the floor of the bypass tunnel is sometimes subject to pronounced wear.
Boes and his team have repeatedly investigated this problem in recent years. For example, the researchers investigated which materials are best suited to lining the floor of such tunnels. After countless tests, they concluded that high-strength granite is best able to withstand heavy wear and tear in particularly harsh conditions. Based on this realisation, several bypass tunnels worldwide have since been lined with granite.
The bypass tunnel at the Pfaffensprung reservoir in the canton of Uri has already been lined with granite. Image credit: ETH Zurich
Using the Solis reservoir in Graubünden as an example, the researchers were also able to prove how effective bypass tunnels actually are. The tunnel has reduced annual sedimentation in Solis by over 80 percent. However, this requires adjustments to storage management: the power plant’s operators can further increase the tunnel’s effectiveness by bringing the water level in the reservoir down low enough, as this enables the inflowing river to transport particularly large quantities of rock and sediment and discharge them via the tunnel. These findings are also relevant for the operators of numerous other power plants.
More electricity through optimised turbine maintenance
Another way to deal with the buildup of silt in reservoirs is to channel fine sediments into downstream sections of the river via the headrace and turbines. “The problem with this is that it causes more turbine wear. But it can still be a worthwhile measure for Alpine reservoirs if alternative measures, such as bypass tunnels, would be too expensive or not feasible,” Boes says.
However, to better assess the feasibility of this approach to the problem of sedimentation, power plant operators need to know what damage the silt causes to the turbines and how much it reduces their efficiency. Boes and his team analysed this problem in one hydropower plant in Valais and another in Graubünden. The researchers used their findings to develop a model that predicts when a turbine will lose output due to sediment wear and ought to be replaced. This enables power plant operators to optimise the maintenance of their systems and ultimately produce more electricity.
The potential of Swiss hydropower
In addition to these specific solutions for existing hydropower plants, Boes and his team at ETH Zurich have also been conducting in-depth research in recent years into the potential for expanding Swiss hydropower. For example, his research group have investigated which areas of glacial retreat would be most suitable for new reservoirs and which existing dams might be raised to create more storage volume.
In 2020, the Swiss Federal Office of Energy used the results of these ETH studies on suitable sites as the basis for a roundtable discussion at which electricity companies, environmental protection organisations and cantons agreed on a list of 15 hydropower plant expansion and new construction projects. Acting as facilitator between the parties, ETH Professor Emeritus Michael Ambühl also played a part in helping the parties reach a compromise. These projects were subsequently incorporated into a new Electricity Supply Act. Whether this legislation comes into force ultimately depends on the Swiss electorate, which will vote in June on expanding hydropower and other renewable energy sources.
Source: ETH Zurich
You can offer your link to a page which is relevant to the topic of this post.
#000#approach#Building#channel#Companies#confluence#construction#course#deal#Ecology#economic#efficiency#electricity#energy#Energy & fuel news#energy sources#Environmental#ETH Zurich#federal#floods#Fundamental physics news#Future#how#hydropower#hydropower plants#it#Lakes#LED#Legislation#LESS
0 notes
Text
I love to change in modern society?
Modern Society
In today’s rapidly evolving world, modern society faces numerous challenges that require thoughtful consideration and effective solutions. in this post delves into various aspects that can be improved to pave the way for a better future. I will discuss about essential areas where collective efforts can foster positive change and address some of the most pressing issues.
Education…

View On WordPress
#awareness#dailyprompt#dailyprompt-2007#education#energy sources#enviroment#mental health#modern#recycling#society#support#sustainable#system
0 notes
Text
Check out the colored graph on IEA's webpage entitled, Total energy supply (TES) by source, People's Republic of China 1990-2020.
0 notes
Text

#carrie white#source pinterest#gaslight gatekeep girlboss#girlblog#girlblogging#female hysteria#carrie 1976#manic pixie dream girl#coquette girl#female manipulator#this is a girlblog#coquette aesthetic#coquette#cinnamon girl#alana champion#girl boss gaslight gatekeep#girly stuff#girl interrupted#pinterest girl#girl interupted syndrome#this is what makes us girls#just girly posts#girlblogger#girl blogger#girlhood#virgin mary#girlcore#dark feminine energy
2K notes
·
View notes
Text
Baron Boghosian - World of Alternative Energy Sources
Baron Boghosian applies his passion for the environment to innovations which convert plastics into fuel. He has an affinity for wildlife, and he enjoys hiking. Mr. Boghosian was born and raised in California, and he attended UCSD as well as Pierce College and Cal Poly Pomona. He graduated Magna Cum Laude with a degree in chemical engineering. He founded Dieselgenix, Inc.
0 notes
Video
Read more here --> https://illuminatingfacts.com/largest-energy-sources/
#energy#energy sources#oil#wind power#turbo electric#solar#solar power#hydroelectric#nuclear power#nuclear energy#bio fuels#natural gas#coal#coal power#oil energy#oil production#electrical power#electricity
1 note
·
View note
Text
Our daily needs of electricity
Our daily needs of electricity
There are many uses of electricity in our lives, for example:
Lighting: The lighting lamp, one of the first applications on electricity,
works by heating: the current passing through resistance generates heat
The invention of Thomas Edison’s incandescent light bulb in the 1870s led lighting to become one of the first available applications of electric…
View On WordPress
#basic electricity#circuit#current electricity#davdo electricity#diplo electricity#dua lipa electricity#electric circuit#electricity#electricity basics#electricity consumption#electricity crisis#electricity intro#electricity lyrics#electricity pheelz#energy resources#energy sources#energy use#essay on importance of electricity#free electricity#generating electricity#how to make electricity#importance of electricity#importance of electricity essay#importance of electricity in everyday life#importance of electricity in our daily life#importance of electricity in our life#importance of electricity in our lives#introduction to electricity#life without energy#new song electricity
1 note
·
View note
Text
Dr.Tarek Kapiel: Nanotechnology and mitigating the effects of climate change in Egypt
Nanotechnology has the potential to play a significant role in reducing the effects of climate change.
Nanomaterials can be used to create more efficient energy sources, such as solar cells and fuel cells, which can reduce the amount of carbon dioxide released into the atmosphere.
Nanomaterials can also be used to create more efficient insulation materials, which can help reduce energy…

View On WordPress
0 notes
Text
Small scale, reliable and renewable: Clean electricity is changing lives in Madagascar.
According to energy industry experts, we're in the middle of a massive expansion of renewable energy sources, and it's likely to continue. At the UN climate conference in Dubai at the end of last year, governments committed to tripling global capacity by 2030, and the International Energy Agency, for one, is bullish about that goal being achieved. But will developing countries benefit?
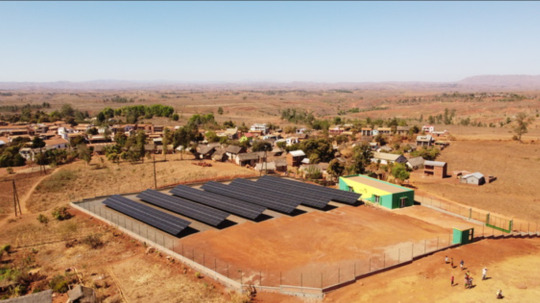
Moritz Brauchle is the managing director of Africa GreenTec Madagascar, a social enterprise which provides sustainable energy solutions to some of the 600 million people in sub-Saharan Africa currently living without any access to electricity.
He explained to Conor Lennon from UN News the advantages of minigrids and how they are breathing new life into communities that were formerly consigned to darkness once the sun went down.
#renewable energy sources#energy sources#sustainable energy#international day of clean energy#26 january#madagascar#solar energy
0 notes
Text
Energy Management Systems Market is projected to grow from USD 38.6 billion in 2022 to USD 75.0 billion by 2027, at a CAGR of 14.2% according to...
#energy#energy efficiency#energies#energia#energy management systems#energy management#energy conservation#energy and utilities#energy storage#energy and environment#energy supply#energy sources#renewable power#renewables#renewable#renewable energy#utilities
0 notes
Text
We use chemicals for more or less ‘everything’. Now we have to find smarter ways of making them - Technology Org
New Post has been published on https://thedigitalinsider.com/we-use-chemicals-for-more-or-less-everything-now-we-have-to-find-smarter-ways-of-making-them-technology-org/
We use chemicals for more or less ‘everything’. Now we have to find smarter ways of making them - Technology Org
Did you know the chemical industry supplies products to virtually all other value chains, including the food, construction, health and transport sectors? All these industries now have to renew themselves as part of the green transition, and SINTEF is working to help them.
Researcher and blog author Theresa Rücker, pictured here in her lab at SINTEF, where she is helping to develop innovative and eco-friendly methods of chemical manufacture. Image credit: Torbjørn Pettersen
The demand for innovative and greener chemical manufacturing has been clear for some time and represents a key aspect of the green transition in Norway and Europe. The chemical industry must undergo radical change, but how will this change take place?
Today, the chemical industry supplies products to virtually all other value chains, including the food, construction, health, and transport sectors. As chemicals become more expensive, this affects consumer prices throughout society. Across Europe, increases in the price of oil, gas, and energy are impacting all chemical manufacturing processes because these are commonly very energy-demanding.
Green chemical manufacture is just one area of investment in what the EU defines as its ‘twin transition’, which involves identifying new, non-fossil raw materials, promoting by-product utilisation, and accelerating the electrification of manufacturing processes.
At SINTEF Industry, where I work, we’re coordinating a project called ELOXYCHEM that is investigating alternatives to our conventional thermochemical manufacturing processes. ELOXYCHEM is an abbreviation for Electrochemical Oxidation of Cyclic and Biogenic Substrates for high-efficiency production of organic CHEMicals.
My team is investigating whether we can manufacture a variety of acids (carboxylic acids, in particular) using energy-saving processes. These acids are a key raw material in producing paints and varnishes, catalytic converters, fine chemicals, agricultural chemicals, scents, pigments and much more. What is special here is that we want to manufacture them using the waste products from other chemical manufacturing processes.
We will also look into poorly exploited by-products from biorefinery processes, so-called side streams, to manufacture chemicals of greater value. If we succeed, there will be multiple benefits including converting waste materials into a resource, energy savings, and a wealth generation boost with increased sustainability.
The ELOXYCHEM project will involve a study of three different manufacturing processes, where one line of investigation will conclude with a pilot facility as a precursor to chemical manufacture at industrial scale. SINTEF Industry will build the pilot facility in Trondheim and will later be transferred to one of the project partners, Evonik Operations in Germany. Here, both the equipment and the process will be tested for two years with a view to commercialisation and major upscaling.
The second strand of the project will involve the development of an eco-friendly process designed to produce approximately the same interim products from other industrial residual products.
Innovative technologies of the type that we are aiming to develop as part of the ELOXYCHEM project have the potential to produce not only familiar, but also new and exciting, building blocks for the chemical industry in much more sustainable ways by reducing greenhouse gas emissions, energy consumption and chemical waste.
Finally, the project will develop a so-called ‘digital twin’ of the manufacturing facility. This will be used to plan production using available energy sources in the smartest possible way. Since production will be powered by renewable energy sources alone, planning must take into account the intermittent nature of electricity supplies from wind and solar power, which may impact on the process.
Source: Sintef
You can offer your link to a page which is relevant to the topic of this post.
#acids#Blog#Building#change#chemical#chemicals#Chemistry & materials science news#construction#development#efficiency#electricity#electrification#electrochemical#Emissions#energy#energy consumption#energy sources#energy-saving#equipment#eu#Europe#Food#fossil#Fundamental physics news#gas#Germany#green#green manufacturing#greenhouse#greenhouse gas
0 notes
Last Seen Blogs

packedlunchmeat
Del

stpatricksweekifcmunich
St.Patrick'sWeekIFC

qdony
Ilium

agnesclementineblog
Agnes Clementine

froggydavevan
Untitled