#merging SQL rows
Explore tagged Tumblr posts
Visit Tumblr Blog
Explore Tumblr blogs with no restrictions, modern design and the best experience.
Last Seen Tumblr Blogs


Fun Fact
In Q3 of 2020, 31% of US users access the Tumblr app daily.
Text
Concatenating Row Values into a Single String in SQL Server
Concatenating text from multiple rows into a single text string in SQL Server can be achieved using different methods, depending on the version of SQL Server you are using. The most common approaches involve using the FOR XML PATH method for older versions, and the STRING_AGG function, which was introduced in SQL Server 2017. I’ll explain both methods. Using STRING_AGG (SQL Server 2017 and…
View On WordPress
#FOR XML PATH method#merging SQL rows#SQL Server concatenation#SQL Server text aggregation#STRING_AGG function
0 notes
Text
Reading and Importing Data in SAS: CSV, Excel, and More
In the world of data analytics, efficient data importation is a fundamental skill. SAS (Statistical Analysis System), a powerful platform for data analysis and statistical computing, offers robust tools to read and import data from various formats, including CSV, Excel, and more. Regardless of whether you are a beginner or overseeing analytics at an enterprise level, understanding how to import data into SAS is the initial step towards obtaining valuable insights.
This article breaks down the most common methods of importing data in SAS, along with best practices and real-world applications—offering value to everyone from learners in a Data Analyst Course to experienced professionals refining their workflows.
Why Importing Data Matters in SAS
Before any analysis begins, the data must be accessible. Importing data correctly ensures integrity, compatibility, and efficiency in processing. SAS supports a range of formats, allowing analysts to work with data from different sources seamlessly. The most common among these are CSV and Excel files due to their ubiquity in business and research environments.
Understanding how SAS handles these files can drastically improve productivity, particularly when working with large datasets or performing repetitive tasks in reporting and modelling.
Importing CSV Files into SAS
Comma-Separated Values (CSV) files are lightweight, easy to generate, and commonly used to exchange data. In SAS, importing CSVs is straightforward.
When importing a CSV file, SAS treats each line as an observation and each comma as a delimiter between variables. This format is ideal for users who deal with exported data from databases or web applications.
Best Practices:
Clean your CSV files before importing—ensure no missing headers, extra commas, or encoding issues.
Use descriptive variable names in the first row of the CSV to streamline your SAS workflow.
Always review the imported data to verify that variable types and formats are interpreted correctly.
Professionals undertaking a Data Analyst Course often begin with CSV files due to their simplicity, making this an essential foundational skill.
Importing Excel Files into SAS
Excel files are the go-to format for business users and analysts. They often contain multiple sheets, merged cells, and various data types, which adds complexity to the import process.
SAS provides built-in tools for reading Excel files, including engines like XLSX and the Import Wizard, which are available in SAS Studio or Enterprise Guide. These tools allow users to preview sheets, specify ranges, and even convert date formats during import.
Key Considerations:
Ensure the Excel file is not open during import to avoid access errors.
Use consistent formatting in Excel—SAS may misinterpret mixed data types within a single column.
If your Excel workbook contains multiple sheets, decide whether you need to import one or all of them.
Advanced users and those enrolled in a Data Analytics Course in Mumbai often work with Excel as part of larger data integration pipelines, making mastery of these techniques critical.
Importing Data from Other Sources
Beyond CSV and Excel, SAS supports numerous other data formats, including:
Text files (.txt): Often used for raw data exports or logs.
Database connections: Through SAS/ACCESS, users can connect to databases like Oracle, SQL Server, or MySQL.
JSON and XML: Increasingly used in web-based and API data integrations.
SAS Datasets (.sas7bdat): Native format with optimised performance for large datasets.
Each format comes with its own import nuances, such as specifying delimiters, encoding schemes, or schema mappings. Familiarity with these enhances flexibility in working with diverse data environments.
Tips for Efficient Data Importing
Here are a few practical tips to improve your SAS data importing skills:
Automate repetitive imports using macros or scheduled jobs.
Validate imported data against source files to catch discrepancies early.
Log and document your import steps—especially when working in team environments or preparing data for audits.
Stay updated: SAS frequently updates its procedures and import capabilities to accommodate new formats and security standards.
Learning and Upskilling with SAS
Importing data is just one piece of the SAS puzzle. For aspiring data professionals, structured training offers the advantage of guided learning, hands-on practice, and industry context. A Data Analyst training will typically begin with data handling techniques, setting the stage for more advanced topics like modelling, visualisation, and predictive analytics.
For learners in metro regions, a Data Analytics Course in Mumbai can provide local networking opportunities, expert mentorship, and exposure to real-world projects involving SAS. These programs often include training in data import techniques as part of their curriculum, preparing students for the demands of modern data-driven roles.
Final Thoughts
Reading and importing data into SAS is a vital skill that underpins all subsequent analysis. Whether you're working with CSV files exported from a CRM, Excel spreadsheets from finance teams, or direct connections to enterprise databases, mastering these tasks can significantly enhance your efficiency and accuracy.
By understanding the nuances of each data format and leveraging SAS's powerful import tools, you’ll be better equipped to manage data workflows, ensure data quality, and drive valuable insights. And for those committed to building a career in analytics, a course could be the stepping stone to mastering not just SAS but the entire data science pipeline.
Business name: ExcelR- Data Science, Data Analytics, Business Analytics Course Training Mumbai
Address: 304, 3rd Floor, Pratibha Building. Three Petrol pump, Lal Bahadur Shastri Rd, opposite Manas Tower, Pakhdi, Thane West, Thane, Maharashtra 400602
Phone: 09108238354,
Email: [email protected]
0 notes
Text
Advanced SAS Programming Techniques: Tips to Optimize Your Code and Workflow
In today’s data-driven world, SAS programming continues to play a critical role in analytics, data management, and business intelligence. While many professionals become comfortable with basic data handling and procedures, the true value of SAS lies in mastering advanced techniques that enhance both performance and efficiency.
If you're a data analyst, statistician, or programmer looking to level up your SAS programming skills, this guide will walk you through key tips and strategies to write better, faster, and cleaner code.
1. Why Advanced SAS Programming Matters
Basic SAS skills will help you clean, process, and analyze data. But advanced SAS programming is where productivity, scalability, and automation begin to shine. In fast-paced environments like clinical trials, finance, or e-commerce analytics, optimized SAS code can save hours of manual effort and significantly reduce errors.
Moreover, as datasets grow in size and complexity, writing efficient and scalable code becomes essential to avoid memory issues and long run times.
2. Use Macros to Automate and Reuse Code
One of the most powerful features in SAS is its macro language. Macros allow you to automate repetitive tasks, simplify your programs, and make your code easier to maintain.
By using macro variables and macro programs, you can dynamically generate code based on different input parameters. This not only saves time but also reduces the risk of manual coding errors.
For example, if you're running the same analysis for different regions or time periods, you can use a macro to loop through those values instead of writing separate blocks of code.
3. Efficient Data Step Programming
The DATA step is the backbone of most SAS programming workflows. To write efficient DATA steps, consider the following best practices:
Keep only the variables you need using the KEEP or DROP statements.
Read only necessary observations using conditional logic.
Use IF-THEN/ELSE efficiently to reduce the number of comparisons.
Minimize sorting operations by organizing your data early.
Every unnecessary line of code adds processing time, especially when you're working with millions of rows. Clean, purposeful DATA steps lead to faster execution and easier debugging.
4. Leverage PROC SQL for Flexible Data Manipulation
While the DATA step is excellent for row-by-row operations, PROC SQL is your best friend for more complex joins and aggregations. It allows you to:
Join multiple datasets without pre-sorting.
Perform subqueries and advanced filtering.
Aggregate data in a concise way.
Integrating PROC SQL into your workflow not only increases flexibility but also helps when transitioning between SAS and other SQL-based platforms.
5. Profiling and Debugging with the Log
Many programmers overlook the power of the SAS Log. This tool gives detailed information about data step processing, including the number of observations read, written, and the amount of time taken.
Learning how to read and interpret the log efficiently helps in identifying bottlenecks and bugs. Use options like OPTIONS MPRINT, MLOGIC, and SYMBOLGEN for debugging macro code and trace the flow of your program.
6. Indexing and Hash Objects
When working with large datasets, performance can be greatly improved using indexing and hash tables.
Indexing helps SAS find and retrieve data faster during BY or WHERE operations.
Hash objects are in-memory lookup tables that offer high-speed matching and merging without sorting, ideal for real-time data operations.
These features are more advanced but worth learning for performance-heavy tasks.
7. Modular Programming for Maintainability
Breaking your code into modular, reusable components is a best practice in any language, and SAS is no exception. Use INCLUDE files or macros to structure your programs logically.
This makes the code easier to understand and enables team collaboration. When multiple people are working on the same project, a well-organized codebase saves time and reduces errors.
youtube
8. Documenting Your Code
Good programmers write code that others can understand. Great programmers write code that they themselves can understand a year later. Use comments to explain:
Why certain logic is used
How parameters are defined
The purpose of a macro or subroutine
It’s not about writing more—it’s about writing smarter.
9. Continuous Learning and Community Engagement
The SAS community is active and supportive. Explore the SAS blogs, attend webinars, and participate in SAS user groups. Keeping up with updates, new procedures, and best practices ensures your SAS programming skills stay relevant.
#sas programming#sas programming tutorial#sas tutorial for beginners#sas programming course#sas blogs#Youtube
0 notes
Text
SQL for Data Science: Essential Queries Every Analyst Should Know
Introduction
SQL (Structured Query Language) is the backbone of data science and analytics. It enables analysts to retrieve, manipulate, and analyze large datasets efficiently. Whether you are a beginner or an experienced data professional, mastering SQL queries is essential for data-driven decision-making. In this blog, we will explore the most important SQL queries every data analyst should know.
1. Retrieving Data with SELECT Statement
The SELECT statement is the most basic yet crucial SQL query. It allows analysts to fetch data from a database.
Example:
SELECT name, age, salary FROM employees;
This query retrieves the name, age, and salary of all employees from the employees table.
2. Filtering Data with WHERE Clause
The WHERE clause is used to filter records based on specific conditions.
Example:
SELECT * FROM sales WHERE amount > 5000;
This query retrieves all sales transactions where the amount is greater than 5000.
3. Summarizing Data with GROUP BY & Aggregate Functions
GROUP BY is used with aggregate functions (SUM, COUNT, AVG, MAX, MIN) to group data.
Example:
SELECT department, AVG(salary) FROM employees GROUP BY department;
This query calculates the average salary for each department.
4. Combining Data with JOINs
SQL JOIN statements are used to combine rows from two or more tables based on a related column.
Example:
SELECT employees.name, departments.department_name FROM employees INNER JOIN departments ON employees.department_id = departments.id;
This query retrieves employee names along with their department names.
5. Sorting Data with ORDER BY
The ORDER BY clause sorts data in ascending or descending order.
Example:
SELECT * FROM customers ORDER BY last_name ASC;
This query sorts customers by last name in ascending order.
6. Managing Large Datasets with LIMIT & OFFSET
The LIMIT clause restricts the number of rows returned, while OFFSET skips rows.
Example:
SELECT * FROM products LIMIT 10 OFFSET 20;
This query retrieves 10 products starting from the 21st record.
7. Using Subqueries for Advanced Analysis
A subquery is a query within another query.
Example:
SELECT name FROM employees WHERE salary > (SELECT AVG(salary) FROM employees);
This query retrieves employees earning more than the average salary.
8. Implementing Conditional Logic with CASE Statement
The CASE statement allows conditional logic in SQL queries.
Example:
SELECT name, CASE WHEN salary > 70000 THEN 'High' WHEN salary BETWEEN 40000 AND 70000 THEN 'Medium' ELSE 'Low' END AS salary_category FROM employees;
This query categorizes employees based on their salary range.
9. Merging Data with UNION & UNION ALL
UNION combines results from multiple SELECT statements and removes duplicates, while UNION ALL retains duplicates.
Example:
SELECT name FROM employees UNION SELECT name FROM managers;
This query retrieves a list of unique names from both employees and managers.
10. Advanced Aggregation & Ranking with Window Functions
Window functions allow calculations across a set of table rows related to the current row.
Example:
SELECT name, department, salary, RANK() OVER (PARTITION BY department ORDER BY salary DESC) AS salary_rank FROM employees;
This query ranks employees within each department based on their salary
0 notes
Text
Use of Power Query in Power BI

Power Query in Power BI is a powerful tool used for data transformation and preparation before visualizing the data. It provides an intuitive interface to connect, combine, and refine data from various sources into a coherent, structured dataset ready for analysis. Excel Training in Mumbai often covers how to use Power Query to effectively prepare and transform data. Here's an overview of how Power Query is used in Power BI:
1. Connecting to Data Sources
Importing Data: Power Query can connect to various data sources like Excel files, databases (SQL Server, Oracle, etc.), online services (Azure, SharePoint, etc.), and even web pages.
Multiple Data Sources: You can combine data from multiple sources into a single dataset, which is especially useful when dealing with complex data architectures.
2. Data Transformation
Data Shaping: Power Query allows you to shape your data by removing unnecessary columns, renaming columns, filtering rows, and sorting data.
Data Cleansing: It provides tools to clean your data by handling missing values, removing duplicates, splitting and merging columns, and correcting data types.
Merging and Appending: You can merge (join) tables based on common columns or append (union) tables to create a unified dataset.
Conditional Columns: Power Query enables creating conditional columns based on specific logic, similar to using IF statements in Excel.
3. Advanced Data Manipulation
Grouping and Aggregation: You can group data by specific columns and aggregate data (e.g., summing, averaging) to create summary tables.
Pivoting and Unpivoting: Power Query allows pivoting rows to columns and vice versa, transforming your data into a more suitable structure for analysis.
Custom Columns: Using the M language (Power Query's formula language), you can create custom columns with complex calculations and logic.
4. Data Loading
Load to Data Model: Once the data is transformed, it can be loaded into the Power BI data model, where it can be used for creating reports and visualizations.
Direct Query vs. Import Mode: Power Query supports both Direct Query (where data is queried directly from the source) and Import Mode (where data is imported into Power BI for analysis).
5. Automation and Reusability
Query Dependencies: Power Query automatically tracks dependencies between queries, ensuring that changes in one query reflect in others that depend on it. This feature is crucial for maintaining accurate and up-to-date data models, especially in complex projects.
Reusable Steps: All transformation steps are recorded and can be modified or reused across different queries, ensuring consistency and efficiency. This capability allows users to standardize their data preparation processes and streamline workflows, which is often highlighted in Advanced Excel Classes in Mumbai to help professionals optimize their data management tasks
6. Integration with Other Power BI Features
Parameters: You can create parameters in Power Query that allow dynamic filtering and customization of data sources and queries.
Templates: Power Query transformations can be saved as templates and reused across different Power BI reports or shared with others.
7. Data Profiling
Column Quality and Distribution: Power Query provides tools to profile your data, showing column quality, value distribution, and statistics to help identify data issues early.
Error Handling: It highlights errors and outliers, allowing you to manage and clean data before loading it into the data model.
8. Performance Considerations
Query Folding: Power Query attempts to push data transformations back to the data source (query folding) whenever possible, optimizing performance by reducing the amount of data loaded into Power BI.
Example Use Cases
Sales Data Preparation: Importing sales data from multiple regional Excel files, cleaning it, and consolidating it into a single dataset for analysis.
Web Scraping: Extracting data from a web page, transforming it into a structured format, and using it in a Power BI report.
Data Integration: Combining data from an SQL Server database and a SharePoint list, transforming it, and creating a unified data model for reporting.
Steps to Access Power Query in Power BI
Open Power BI Desktop.
Go to the "Home" tab.
Click on "Transform Data" to open the Power Query Editor.
Use the various tools and options available in the Power Query Editor to connect to data sources, transform data, and prepare it for analysis.
Power Query is essential for anyone looking to perform robust data transformation and preparation in Power BI. It ensures your data is clean, well-structured, and ready for analysis, enabling better insights and decision-making. Learning Power Query is a key part of Advanced Excel Training in Mumbai, as it equips individuals with the skills needed to handle data efficiently and create powerful data models.
For more information, contact us at:
Call: 8750676576, 871076576
Email:[email protected]
Website:www.advancedexcel.net
#Excel Training in Mumbai#Advanced Excel Classes in Mumbai#Advanced Excel Training in Mumbai#advanced excel
0 notes
Text
What is Pandas in Data analysis
Pandas in data analysis is a popular Python library specifically designed for data manipulation and analysis. It provides high-performance, easy-to-use data structures and tools, making it essential for handling structured data in pandas data analysis. Pandas is built on top of NumPy, offering a more flexible and powerful framework for working with datasets.
Pandas revolves around two primary structures, Series (a single line of data) and DataFrame (a grid of data). Imagine a DataFrame as a table or a spreadsheet. It offers a place to hold and tweak table-like data, with rows acting as individual entries and columns standing for characteristics.
The Pandas library simplifies the process of reading, cleaning, and modifying data from different formats like CSV, Excel, JSON, and SQL databases. It provides numerous built-in functions for handling missing data, merging datasets, and reshaping data, which are essential tasks in data preprocessing.
Additionally, Pandas supports filtering, selecting, and sorting data efficiently, helping analysts perform complex operations with just a few lines of code. Its ability to group, aggregate, and summarize data makes it easy to calculate key statistics or extract meaningful insights.
Pandas also integrates with data visualization libraries like Matplotlib, making it a comprehensive tool for data analysis, data wrangling, and visualization, used by data scientists, analysts, and engineers.
0 notes
Text
Creating an Effective Power BI Dashboard: A Comprehensive Guide

Introduction to Power BI Power BI is a suite of business analytics tools that allows you to connect to multiple data sources, transform data into actionable insights, and share those insights across your organization. With Power BI, you can create interactive dashboards and reports that provide a 360-degree view of your business.
Step-by-Step Guide to Creating a Power BI Dashboard
1. Data Import and Transformation The first step in creating a Power BI dashboard is importing your data. Power BI supports various data sources, including Excel, SQL Server, Azure, and more.
Steps to Import Data:
Open Power BI Desktop.
Click on Get Data in the Home ribbon.
Select your data source (e.g., Excel, SQL Server, etc.).
Load the data into Power BI.
Once the data is loaded, you may need to transform it to suit your reporting needs. Power BI provides Power Query Editor for data transformation.
Data Transformation:
Open Power Query Editor.
Apply necessary transformations such as filtering rows, adding columns, merging tables, etc.
Close and apply the changes.
2. Designing the Dashboard After preparing your data, the next step is to design your dashboard. Start by adding a new report and selecting the type of visualization you want to use.
Types of Visualizations:
Charts: Bar, Line, Pie, Area, etc.
Tables and Matrices: For detailed data representation.
Maps: Geographic data visualization.
Cards and Gauges: For key metrics and KPIs.
Slicers: For interactive data filtering.
Adding Visualizations:
Drag and drop fields from the Fields pane to the canvas.
Choose the appropriate visualization type from the Visualizations pane.
Customize the visual by adjusting properties such as colors, labels, and titles.
3. Enhancing the Dashboard with Interactivity Interactivity is one of the key features of Power BI dashboards. You can add slicers, drill-throughs, and bookmarks to make your dashboard more interactive and user-friendly.
Using Slicers:
Add a slicer visual to the canvas.
Drag a field to the slicer to allow users to filter data dynamically.
Drill-throughs:
Enable drill-through on visuals to allow users to navigate to detailed reports.
Set up drill-through pages by defining the fields that will trigger the drill-through.
Bookmarks:
Create bookmarks to capture the state of a report page.
Use bookmarks to toggle between different views of the data.

Different Styles of Power BI Dashboards Power BI dashboards can be styled to meet various business needs. Here are a few examples:
1. Executive Dashboard An executive dashboard provides a high-level overview of key business metrics. It typically includes:
KPI visuals for critical metrics.
Line charts for trend analysis.
Bar charts for categorical comparison.
Maps for geographic insights.
Example:
KPI cards for revenue, profit margin, and customer satisfaction.
A line chart showing monthly sales trends.
A bar chart comparing sales by region.
A map highlighting sales distribution across different states.
2. Sales Performance Dashboard A sales performance dashboard focuses on sales data, providing insights into sales trends, product performance, and sales team effectiveness.
Example:
A funnel chart showing the sales pipeline stages.
A bar chart displaying sales by product category.
A scatter plot highlighting the performance of sales representatives.
A table showing detailed sales transactions.
3. Financial Dashboard A financial dashboard offers a comprehensive view of the financial health of an organization. It includes:
Financial KPIs such as revenue, expenses, and profit.
Financial statements like income statement and balance sheet.
Trend charts for revenue and expenses.
Pie charts for expense distribution.
Example:
KPI cards for net income, operating expenses, and gross margin.
A line chart showing monthly revenue and expense trends.
A pie chart illustrating the breakdown of expenses.
A matrix displaying the income statement.
Best Practices for Designing Power BI Dashboards To ensure your Power BI dashboard is effective and user-friendly, follow these best practices:
Keep it Simple:
Avoid cluttering the dashboard with too many visuals.
Focus on the most important metrics and insights.
2. Use Consistent Design:
Maintain a consistent color scheme and font style.
Align visuals properly for a clean layout.
3. Ensure Data Accuracy:
Validate your data to ensure accuracy.
Regularly update the data to reflect the latest information.
4. Enhance Interactivity:
Use slicers and drill-throughs to provide a dynamic user experience.
Add tooltips to provide additional context.
5. Optimize Performance:
Use aggregations and data reduction techniques to improve performance.
Avoid using too many complex calculations.
Conclusion Creating a Power BI dashboard involves importing and transforming data, designing interactive visuals, and applying best practices to ensure clarity and effectiveness. By following the steps outlined in this guide, you can build dashboards that provide valuable insights and support data-driven decision-making in your organization. Power BI’s flexibility and range of visualizations make it an essential tool for any business looking to leverage its data effectively.
#Dynamic Data Visualization#Business Analytics#Interactive Dashboards#Data Insights#Data Transformation#KPI Metrics#Real-time Reporting#Data Connectivity#Trend Analysis#Visual Analytics#Performance Metrics#Data Modeling#Executive Dashboards#Sales Performance#Financial Reporting#Data Interactivity#Data-driven Decisions#Power Query#Custom Visuals#Data Integration
0 notes
Text
This Week in Rust 531
Hello and welcome to another issue of This Week in Rust! Rust is a programming language empowering everyone to build reliable and efficient software. This is a weekly summary of its progress and community. Want something mentioned? Tag us at @ThisWeekInRust on Twitter or @ThisWeekinRust on mastodon.social, or send us a pull request. Want to get involved? We love contributions.
This Week in Rust is openly developed on GitHub and archives can be viewed at this-week-in-rust.org. If you find any errors in this week's issue, please submit a PR.
Updates from Rust Community
Foundation
Q4 2023 Recap from Rebecca Rumbul
Project/Tooling Updates
Ruffle 2023 in review
Four challenges cargo-semver-checks has yet to tackle
rustc_codegen_gcc: Progress Report #29
Roadmap for the Xilem backend in 2024
rust-analyzer changelog #217
pq-sys 0.5.0
What's new in SeaORM 0.12.x
Rust on Espressif chips - January 24 2024
Observations/Thoughts
Making Rust binaries smaller by default
My Best and Worst Deadlock in Rust
Why SQL hang for exactly 940s? TCP and Async Rust!
Making Async Rust Reliable
Identifying Rust’s collect::() memory leak footgun
[video] embassy is now on crates.io
[video] Rust full stack web frameworks have a bright future
[video] Rust Halifax - Rust & Tell #1
[video] Why Rust will keep growing in 2024
Rust Walkthroughs
Using mem::take to reduce heap allocations
Writing your own Rust linter
Using Serde in Rust
Parsing JSON in Rust
Billion-row challenge: Rust walkthrough
Embassy on ESP: Timers
Supporting LoRa on the SparkFun expLoRaBLE Thing Plus with Rust
How to work with !Sized types in Rust
Rocket - logging in the web application
Rocket - access custom configuration in the routes
Testing with tempfiles and environment variables
Research
Profiling Programming Language Learning
Rust-lancet: Automated Ownership-Rule-Violation Fixing with Behavior Preservation
Crate of the Week
This week's crate is apistos, an OpenAPI documentation tool.
Thanks to Romain Lebran for the self-suggestion!
Please submit your suggestions and votes for next week!
Call for Participation; projects and speakers
CFP - Projects
Always wanted to contribute to open-source projects but did not know where to start? Every week we highlight some tasks from the Rust community for you to pick and get started!
Some of these tasks may also have mentors available, visit the task page for more information.
* Ockam - Have a single SqlxDatabase instance per process * Ockam - Improve database migrations to pair sql and rust migration code * Ockam - Make install.sh not fail during upgrade process * Hyperswitch - [FEATURE]: Make cache configuration configurable at runtime * Hyperswitch - [FEATURE]: Implement Code cov for local system using makefile * Hyperswitch - [FEATURE]: Setup code coverage for local tests & CI * Hyperswitch - [FEATURE]: Add domain type for client secret * Hyperswitch - [FEATURE]: Have get_required_value to use ValidationError in OptionExt
If you are a Rust project owner and are looking for contributors, please submit tasks here.
CFP - Speakers
Are you a new or experienced speaker looking for a place to share something cool? This section highlights events that are being planned and are accepting submissions to join their event as a speaker.
If you are an event organizer hoping to expand the reach of your event, please submit a link to the submission website through a PR to TWiR.
Updates from the Rust Project
453 pull requests were merged in the last week
HashMap/HashSet: forward fold implementations of iterators
dead_code treats #[repr(transparent)] the same as #[repr(C)]
fix(rust-analyzer): use new pkgid spec to compare
large_assignments: Lint on specific large args passed to functions
maybe_lint_impl_trait: separate is_downgradable from is_object_safe
never_patterns: Count ! bindings as diverging
never_patterns: typecheck never patterns
pat_analysis: Don't rely on contiguous VariantIds outside of rustc
pattern_analysis: Remove Ty: Copy bound
proc_macro: Add Literal::c_string constructor
single_use_lifetimes: Don't suggest deleting lifetimes with bounds
add #[track_caller] to the "From implies Into" impl
add Ipv6Addr::is_ipv4_mapped
add PatKind::Err to AST/HIR
add help message for exclusive_range_pattern error
add private NonZero<T> type alias
add way to express that no values are expected with check-cfg
added NonZeroXxx::from_mut(_unchecked)?
allow any const expression blocks in thread_local!
always use RevealAll for const eval queries
avoid ICEs in trait names without dyn
consolidate logic around resolving built-in coroutine trait impls
deny braced macro invocations in let-else
detect NulInCStr error earlier
improve let_underscore_lock
improved collapse_debuginfo attribute, added command-line flag
make unsafe_op_in_unsafe_fn migrated in edition 2024
restrict access to the private field of newtype indexes
simplify closure_env_ty and closure_env_param
suggest .swap() when encountering conflicting borrows from mem::swap on a slice
undeprecate lint unstable_features and make use of it in the compiler
make MIR pass name a compile-time constant
make stable_mir::with_tables sound
SMIR: make the remaining "private" fields actually private
use an interpreter in MIR jump threading
use implied bounds compat mode in MIR borrowck
validate AggregateKind types in MIR
sandwich MIR optimizations between DSE
cache local DefId-keyed queries without hashing
pack u128 in the compiler to mitigate new alignment
use UnhashMap for a few more maps
fold arithmetic identities in GVN
optimize large array creation in const-eval
implement iterator specialization traits on more adapters
optimize EscapeAscii's Display and CStr's Debug
stabilise bound_map
stabilize round_ties_even
stabilize slice_first_last_chunk
stabilize single-field offset_of!
implement strict integer operations that panic on overflow
core: introduce split_at{,_mut}_checked
un-hide iter::repeat_n
fix deallocation with wrong allocator in (A)Rc::from_box_in
use bool instead of PartialOrd as return value of the comparison closure in {slice,Iterator}::is_sorted_by
regex: make Input::new guard against incorrect AsRef implementations
cargo-rustdoc: use same path by output format logic everywhere
cargo: use pkgid spec in in JSON messages
cargo: remap common prefix only
cargo doc: add a heading to highlight "How to find features enabled on dependencies"
cargo: inherit jobserver from env for all kinds of runner
cargo: fix precise-prerelease tracking link
cargo: go back to passing an empty values() when no features are declared
cargo: improve GitHub Actions CI config
rustdoc: Allows links in headings
rustdoc: hide modals when resizing the sidebar
rustfmt: check that a token can begin a nonterminal kind before parsing it as a macro arg
rustfmt: add config option generated_marker_line_search_limit
clippy: blocks_in_conditions: do not warn if condition comes from macro
clippy: default_numeric_fallback: improve const context detection
clippy: no_effect_underscore_binding: _ prefixed variables can be used
clippy: unused_io_amount captures Ok(_)s
clippy: add suspicious_open_options lint
clippy: correctly handle type relative in trait_duplication_in_bounds lint
clippy: don't emit derive_partial_eq_without_eq lint if the type has the non_exhaustive attribute
clippy: find function path references early in the same lint pass
clippy: fix FP on semicolon_if_nothing_returned
clippy: fix multiple_crate_versions to correctly normalize package names to avoid missing the local one
clippy: fix warning span for no_effect_underscore_binding
clippy: respect #[allow] attributes in single_call_fn lint
clippy: improve wording and fix dead link in description of arc_with_non_send_sync lint
rust-analyzer: add "One" import granularity
rust-analyzer: add a new config to allow renaming of non-local defs
rust-analyzer: goto type actions for notable trait hovers
rust-analyzer: show additional value information when hovering over literals
rust-analyzer: show notable implemented traits on hover
rust-analyzer: add error recovery for use_tree_list parsing
rust-analyzer: fix panic when extracting struct from enum variant
rust-analyzer: fix progress reporting getting stuck
rust-analyzer: handle SelfParam better in "Inline call"
rust-analyzer: include for construct in convert to guarded return conditions
rust-analyzer: infer OUT_DIR when workspace root contains a symlink
rust-analyzer: make value_ty query fallible
rust-analyzer: parse macro_rules as macro name
Rust Compiler Performance Triage
This week saw a bunch of regressions caused by correctness fixes and in general doing more work in the compiler. These were offset by many improvements (especially around hashing in the compiler) that improved performance by ~2% across a large number of benchmarks. Don't get too excited about the large 45+% wins though, these were only for tiny benchmarks like helloworld. They were caused by a change in Cargo which introduces stripping of debug symbols from Rust release binaries by default, and in turn also improves compilation time for small crates.
Triage done by @kobzol. Revision range: f9c2421a..d6b151fc
Summary:
(instructions:u) mean range count Regressions ❌ (primary) 0.7% [0.2%, 1.5%] 11 Regressions ❌ (secondary) 2.2% [0.2%, 9.9%] 26 Improvements ✅ (primary) -3.2% [-47.5%, -0.2%] 191 Improvements ✅ (secondary) -7.9% [-46.5%, -0.1%] 123 All ❌✅ (primary) -3.0% [-47.5%, 1.5%] 202
4 Regressions, 4 Improvements, 9 Mixed; 4 of them in rollups 48 artifact comparisons made in total
Full report here
Approved RFCs
Changes to Rust follow the Rust RFC (request for comments) process. These are the RFCs that were approved for implementation this week:
No RFCs were approved this week.
Final Comment Period
Every week, the team announces the 'final comment period' for RFCs and key PRs which are reaching a decision. Express your opinions now.
RFCs
No RFCs entered Final Comment Period this week.
Tracking Issues & PRs
[disposition: close] Add a default flag for enum documentation
[disposition: merge] impl From<&[T; N]> for Cow<[T]>
[disposition: merge] Tracking Issue for array_methods
Language Reference
No Language Reference RFCs entered Final Comment Period this week.
Unsafe Code Guidelines
No Unsafe Code Guideline RFCs entered Final Comment Period this week.
New and Updated RFCs
eRFC: Iterate on and stabilize libtest's programmatic output
Call for Testing
An important step for RFC implementation is for people to experiment with the implementation and give feedback, especially before stabilization. The following RFCs would benefit from user testing before moving forward:
No RFCs issued a call for testing this week.
If you are a feature implementer and would like your RFC to appear on the above list, add the new call-for-testing label to your RFC along with a comment providing testing instructions and/or guidance on which aspect(s) of the feature need testing.
Upcoming Events
Rusty Events between 2024-01-24 - 2024-02-21 🦀
Virtual
2024-01-24 | Virtual (Berlin, DE) | WeAreDevelopers Community
WeAreDevelopers LIVE - Rust Day
2024-01-25 | Virtual (Charlottesville, NC, US) | Charlottesville Rust Meetup
Crafting Interpreters in Rust Collaboratively
2024-01-25 | Virtual (Linz, AT) | Rust Linz
Rust Meetup Linz - 36th Edition
2024-01-25 | Virtual (Mexico City, DF, MX) | Rust MX
Iniciando 2024 con Rust
2024-01-28 | Virtual (Wrocław, PL) | Stacja IT Wrocław
Wprowadzenie do języka Rust
2024-01-30 | Virtual | Bevy Game Development
Bevy Meetup #1
2024-01-30 | Virtual (Buffalo, NY, US) | Buffalo Rust User Group
Buffalo Rust User Group
2024-01-30 | Virtual (Dallas, TX, US) | Dallas Rust
Last Tuesday
2024-01-31 | Virtual (Cardiff, UK) | Rust and C++ Cardiff
Rust for Rustaceans Book Club launch!
2024-02-01 | Virtual + In Person (Barcelona, ES) | BcnRust
12th BcnRust Meetup - Stream
2024-02-01 | Virtual (Berlin, DE) | OpenTechSchool Berlin + Rust Berlin
Rust Hack n Learn | Mirror: Rust Hack n Learn
2024-02-03 | Virtual + In-person (Brussels, BE) | FOSDEM 2024
FOSDEM Conference: Rust devroom - talks
2024-02-03 | Virtual (Kampala, UG) | Rust Circle
Rust Circle Meetup
2024-02-04 | Virtual | Rust Maven
Web development with Rocket - In English
2024-02-07 | Virtual (Indianapolis, IN, US) | Indy Rust
Indy.rs - with Social Distancing
2024-02-08 | Virtual (Charlottesville, NC, US) | Charlottesville Rust Meetup
Crafting Interpreters in Rust Collaboratively
2024-02-08 | Virtual (Nürnberg, DE) | Rust Nüremberg
Rust Nürnberg online
2024-02-10 | Virtual (Wrocław, PL) | Stacja IT Wrocław
Rust – budowanie narzędzi działających w linii komend
2024-02-13 | Virtual (Dallas, TX, US) | Dallas Rust
Second Tuesday
2024-02-15 | Virtual (Berlin, DE) | OpenTechSchool Berlin + Rust Berlin
Rust Hack n Learn | Mirror: Rust Hack n Learn
2024-02-21 | Virtual (Vancouver, BC, CA) | Vancouver Rust
Rust Study/Hack/Hang-out
Europe
2024-01-24 | Zagreb, HR | impl Zagreb for Rust
Rust Meetup 2024/01: WebGPU intro using Rust
2024-01-25 | Augsburg, DE | Rust Meetup Augsburg
Augsburg Rust Meetup #5: Async Part2 and Async in action
2024-01-25 | Vienna, AT | Rust Vienna
Rust Vienna Meetup - January - Blockchains and Data Pipelines
2024-02-01 | Hybrid (Barcelona, ES) | BcnRust
12th BcnRust Meetup
2024-02-03 | Brussels, BE | FOSDEM '24
FOSDEM '24 Conference: Rust devroom - talks | Rust Aarhus FOSDEM Meetup
2024-02-03 | Nürnberg, BY, DE | Paessler Rust Camp 2024
Paessler Rust Camp 2024
2024-02-06 | Bremen, DE | Rust Meetup Bremen
Rust Meetup Bremen [1]
2024-02-07 | London, UK | Rust London User Group
Rust for the Web — Mainmatter x Shuttle Takeover
2024-02-08 | Bern, CH | Rust Bern
Rust Bern Meetup #1 2024 🦀
North America
2024-01-24 | Austin, TX, US | Rust ATX
Rust Lunch - Fareground
2024-01-27-28 | Calgary, AB, CA | Rust Calgary
Harnessing Rust for Real-World Problems hackathon: Day 1
Harnessing Rust for Real-World Problems hackathon: Day 2
2024-01-25 | Mountain View, CA, US | Mountain View Rust Meetup
Rust Study/Hack/Hang-out
2024-01-30 | Cambridge, MA, US | Boston Rust Meetup
Harvard Square Rust Lunch
2024-02-07 | Brookline, MA, US | Boston Rust Meetup
Coolidge Corner Brookline Rust Lunch, Feb 7
2024-02-12 | Minneapolis, MN, US | Minneapolis Rust Meetup
Minneapolis Rust: Open Source Contrib Hackathon & Happy Hour
2024-02-13 | New York, NY, US | Rust NYC
Rust NYC Monthly Mixer
2024-02-13 | Seattle, WA, US | Cap Hill Rust Coding/Hacking/Learning
Rusty Coding/Hacking/Learning Night
2024-02-15 | Boston, MA, US | Boston Rust Meetup
Back Bay Rust Lunch, Feb 15
2024-02-15 | Seattle, WA, US | Seattle Rust User Group
Seattle Rust User Group Meetup
Oceania
2024-02-06 | Perth, WA, AU | Perth Rust Meetup Group
Rust Feb 2024 Meetup
If you are running a Rust event please add it to the calendar to get it mentioned here. Please remember to add a link to the event too. Email the Rust Community Team for access.
Jobs
Please see the latest Who's Hiring thread on r/rust
Quote of the Week
The functional ML roots of the language, Graydon's first Rust compiler was written in OCaml, shine through, influencing it right from the start.
It's not "C++ but better".
It's Haskell standing on Lisp's shoulders, hiding in C's coat to sneak into PRDCTN. (The fancy nightclub where all the popular language's hang out)
– tris on his "No Boilerplate" Youtube channel
Thanks to PrototypeNM1 for the suggestion!
Please submit quotes and vote for next week!
This Week in Rust is edited by: nellshamrell, llogiq, cdmistman, ericseppanen, extrawurst, andrewpollack, U007D, kolharsam, joelmarcey, mariannegoldin, bennyvasquez.
Email list hosting is sponsored by The Rust Foundation
Discuss on r/rust
1 note
·
View note
Text
Vertex Merging Magic of AlloyDB AI Elevates AI Apps!

AlloyDB AI Benifits
Google introduced AlloyDB AI at Next ‘23, a set of built-in features for creating generative AI applications. You may call a Vertex AI model from the database using SQL.
AlloyDB is a managed PostgreSQL-compatible database with high performance, availability, and scalability. In performance studies, AlloyDB AI conducts vector queries 10x quicker than PostgreSQL using the IVFFlat index and analytical queries 100X faster. Improved vector search and predictive ML are also included.
Google’s end-to-end AI platform, Vertex AI, lets you upload, label, train, and deploy ML models. Model Garden on Vertex AI supports Google, third-party, and open-source AI models.
You may use the google_ml_integration extension to connect AlloyDB to Vertex AI and execute predictions with your data using custom models or Model Garden models. AlloyDB AI uses open-source technologies like pgvector and LangChain to store embeddings and link to LangChain apps.
AlloyDB AI creates unique user experiences with real data leveraging Google Cloud products and open-source AI technologies. Therefore, you may design dynamic AI experiences that update in real time with database changes.
This article will show five ways to use SQL to use Vertex AI or custom models for similarity search, sentiment analysis, bot identification, healthcare forecasts, and risk prediction.
Vector embedding similarity search
Say you run South Bay Furnishers and maintain your inventory in a relational database. You might record product descriptions, inventory data, and more in a products table.
First, extract data from a database or data warehouse, construct embeddings, then upsert the vector into a vector database. At each stage, batching and API restrictions may slow performance. Building your own ETL process that uses various third-party services is typical of conventional processes. A vector database must be kept alongside your application’s transaction database.
AlloyDB AI simplifies this three-step procedure into one SQL query, letting you produce embeddings from your data and save them in your existing database.
To automatically produce table embeddings, add a generated column to your table using the following command:
Vertex AI’s model textembedding-gecko now generates product text embeddings when you put rows into your database. Using pgvector and AlloyDB AI’s improved vector search, you can do similarity search and improve product suggestions.
Analysis of sentiment
AlloyDB can use more data using Model Garden pretrained models. You may utilize Vertex AI’s sentiment analysis model to assess user sentiment without training your own.
Vertex AI’s pretrained sentiment analysis model can determine a score and magnitude for AlloyDB comments. A score between -1 and 1 (negative, neutral, or positive) is produced by the model. It also estimates negative vs. positive content magnitude. For example, the model might rate “You are a terrible streamer!” -.868 and.977.
To compute negative stream comments, shift the score distribution to 0–1 (instead of -1–1) and multiply by magnitude.
Use f(x) =.5(x +1) to transfer [-1,1] to [0,1] to shift the distribution.
The pretrained model lets you instantly assess audience response to live broadcasts, creating dynamic user experiences and giving producers real-time feedback to course correct. Track the general mood for each contributor and put it on their profile to give them further feedback to enhance their material.
Custom models
The google_ml_integration extension lets you execute predictions using your own Vertex AI models with an endpoint id. For real-time forecasts on time-sensitive transactions, use live data from your database.
Online game bot detection
Imagine you design a real-time multiplayer sports game. Due to bot cheating, daily active users have dropped, and some players have claimed that the game is unfair. Your data science team developed a cheating detection model to address this problem. You may ban a cheating gamer after flagging them.
Developers play cat-and-mouse to catch cheats. Hackers will discover new methods to beat the model as it adds signals to detect bot-like activity. With Vertex AI and AlloyDB, updating models is simple and downtime-free. Simply switch your deployed endpoint to your new model, and your application will utilize it without any code modifications.
Healthcare forecasts
As a health-tech startup, you want to help primary care doctors understand their patients’ heart health. Patient cardiac risk scores may be generated using updated vitals like BMI and blood pressure. You may automatically create a new heart risk score with fresh vitals in AlloyDB using a generated column. Return an updated record to your application and show it in a patient’s chart to let the doctor decide on treatment.
Risk models for insurance
Any insurance firm has to appropriately predict risk. Consider a car insurance provider that provides online quotes. Every time a client applies for an insurance, you must analyze their risk based on their data (e.g., driving record) and run a risk model to quote.
AlloyDB AI may access customer input and other data in AlloyDB to run a Vertex AI risk model. A model determines claim validity in claims processing and other insurance and financial fraud detection.
Conclusion
A data science team and many steps are needed to use machine learning models with database data from your firm. You can utilize machine learning models to produce embeddings, categorize data, forecast outcomes, and more using AlloyDB AI in one step. AlloyDB also lets users use Vertex AI’s pretrained models without data science help.
Read more on Govindhtech.com
1 note
·
View note
Text
SQL Merge Statement - EVIL or DEVIL:
Q01. What is the MERGE Statement in SQL? Q02. Why separate MERGE statement if we have already INSERT, UPDATE, and DELETE commands? Q03. What are the different databases that support the SQL MERGE Statement? Q04. What are the different MERGE Statement Scenarios for DML? Q05. What are the different supported MERGE Statement Clauses in MSSQL? Q06. What will happen if more than one row matches the MERGE Statement? Q07. What are the fundamental rules of SQL MERGE Statement? Q08. What is the use of the TOP and OUTPUT clauses in the SQL Merge Statement? Q09. How can you use the Merge Statement in MSSQL? Q10. How does the SQL MERGE command work in MSSQL? Q11. How can you write the query for the SQL Merge? Q12. Is SQL MERGE Statement Safe to use?
#crackjob#techpoint#techpointfunda#techpointfundamentals#sqlinterview#sqlmerge#evilofsqlmerge#devilofsqlmerge
1 note
·
View note
Text
Mastering SQL Joins: Unleashing the Power of Data Relationships
In the realm of relational databases, the ability to harness the power of data relationships is crucial for effective data retrieval and analysis. SQL (Structured Query Language) plays a pivotal role in this regard, offering a variety of join operations to combine data from multiple tables. In this article, we will delve into the art of mastering SQL joins and explore how they unlock the potential of data relationships.
Understanding the Basics of SQL Joins
Before delving into the intricacies of structured query language joins, it's essential to grasp the fundamentals. A join is essentially a way to combine rows from two or more tables based on a related column between them. The most common types of joins are INNER JOIN, LEFT JOIN, RIGHT JOIN, and FULL JOIN.
INNER JOIN: Merging Data with Commonalities
The INNER JOIN is the fundamental join type, extracting only the rows with matching values in both tables. Consider two tables: 'employees' and 'departments.' An INNER JOIN on the 'department_id' column would yield rows containing information where the 'department_id' is common between the two tables.
LEFT JOIN: Embracing Unmatched Rows
When you want to retrieve all rows from the left table and the matching rows from the right table, even if there are no matches, the LEFT JOIN comes into play. This join is particularly useful when dealing with scenarios where some data might be missing in one of the tables.
RIGHT JOIN: The Mirror Image of LEFT JOIN
Conversely, the RIGHT JOIN retrieves all rows from the right table and the matching rows from the left table. While it achieves a similar result to the LEFT JOIN, the distinction lies in which table data is prioritized.
FULL JOIN: A Comprehensive Data Snapshot
The FULL JOIN combines the results of both LEFT JOIN and RIGHT JOIN, providing a comprehensive snapshot of the data from both tables. This join type is beneficial when you want to capture all the information from both tables, matched and unmatched.
Cross Join: Cartesian Product Unleashed
A Cross Join, also known as a Cartesian Join, returns the Cartesian product of the two tables involved. It pairs each row from the first table with every row from the second table, resulting in a potentially vast dataset. While less commonly used than other joins, it has its applications, such as generating combinations.
Self-Join: Connecting Rows within the Same Table
In some scenarios, you may need to join a table with itself to establish relationships between rows within the same table. This is known as a self-join, and it involves creating aliases for the table to differentiate between the two instances. Self-joins are particularly useful when dealing with hierarchical data or organizational structures.
Utilizing Joins in Real-world Scenarios
To truly master SQL joins, it's crucial to apply them in real-world scenarios. Consider a business scenario where you need to analyze sales data stored in one table and customer information in another. A well-crafted INNER JOIN on the common 'customer_id' column can seamlessly merge the two datasets, enabling you to derive insights such as which customers generate the most revenue.
Optimizing Joins for Performance
While SQL joins are powerful, inefficient usage can lead to performance bottlenecks, especially with large datasets. To optimize performance, consider indexing the columns used in join conditions. Indexing allows the database engine to quickly locate and retrieve the relevant rows, significantly enhancing query speed. Additionally, carefully choose the appropriate join type based on the specific requirements of your query to avoid unnecessary computations
In conclusion, mastering SQL joins is a crucial skill for any data professional or developer working with relational databases. The ability to navigate and utilize different join types empowers individuals to extract meaningful insights from complex datasets, enabling informed decision-making. Whether you're merging employee and department data or analyzing sales and customer information, SQL joins are the key to unlocking the full potential of data relationships. As you delve deeper into the world of SQL, continue honing your join skills, and watch as the intricate web of data relationships unfolds before you
#onlinetraining#career#elearning#learning#programming#technology#automation#online courses#security#startups
0 notes
Text
ETL Pipelines Simplified: Building Data Transformation Workflows
As businesses generate a large amount of data in today's data-driven world, businesses must extract, transform, and load data from various sources. Extract, transform, load (ETL) refers to the three interconnected data integration processes that extract and move data from one database to another.
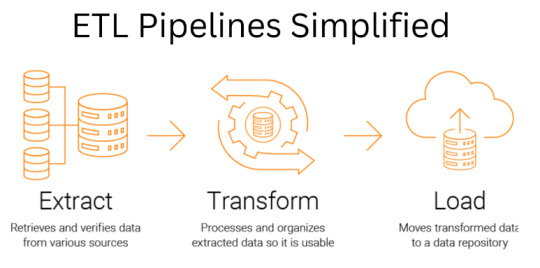
An ETL pipeline is the most popular method for effectively processing large amounts of data. This blog delves more into building an effective ETL pipeline process and different ways to build an ETL pipeline.
Understanding ETL Pipeline and its Significance
With the advent of cloud technologies, many organizations are transferring their data using ETL tools from legacy source systems to cloud environments. The data extraction, transformation, and loading (ETL) pipeline consists of tools or programs that take the data from the source, transform it according to business requirements, and load it to the output destination, such as a database, data warehouse, or data mart for additional processing or reporting. There are five types of ETL pipelines:
● Batch ETL pipeline - Useful when voluminous data is processed daily or weekly.
● Real-time ETL pipeline - Useful when data needs to be quickly processed.
● Incremental ETL pipeline - Useful when the data sources change frequently.
● Hybrid ETL pipeline - A combination of batch and real-time ETL pipeline, it is useful when there is a need for quick data processing but on time.
● Cloud ETL pipeline - Useful when processing the data stored in the cloud.
Methodology to Build an ETL Pipeline
Here are the steps to build an effective ETL pipeline to transform the data effectively:
1. Defining Scope and Requirements - Defining the ETL data and data points before beginning the building processis essential. Moreover, identify the source system and potential problems, like data quality, volume, and compatibility issues.
2. Extract Data - Using an API system, which includes SQL queries or other data mining tools, extract the data from the source system.
3. Data Manipulation - The extracted data is often not in the desired format. So, transform the data by cleaning, filtering, or merging it to make it suitable for achieving the desired goal.
4. Data Load - Now, load the modified data into an endpoint file storage system by creating schemas or tables, validating mapping fields and data, and managing the errors.
5. Testing and Monitoring - After installing the ETL pipeline, thorough testing is essential to ensure it works perfectly. Moreover, keep monitoring the ETL operations to resolve the errors during its functioning.
6. Iterate and Improve - The last step aims to update the ETL pipeline to continue meeting the business needs by optimizing it, adding new data sources, or changing the target system.
Different Phases of ETL Process
Extraction, Transformation, and Loading are different phases of the ETL process, and here's how each phase contributes to enhancing the data quality:
● Extraction
Data is collected from various data sources during the "extract" stage of ETL data pipelines, where it eventually appears as rows and columns in your analytics database. There are three possible and frequently employed methods:
1. Full Extraction: A complete data set is pulled from the source and put into the pipeline.
2. Incremental Extraction: Only new data and data that has changed from the previous time are collected each time a data extraction process (such as an ETL pipeline) runs.
3. Source-Driven Extraction: In source-driven extraction, the ETL systems receive notification when data changes from the source, which prompts the ETL pipeline to extract the new data.
● Transformation
Data transformation techniques are required to improve the data quality. It is an important step for developing ETL data pipelines because the value of our data depends entirely on how well we can transform it to suit our needs. Following are a few illustrations of data processing steps to transform the data.
1. Basic Cleaning: It involves converting data into a suitable format per the requirements.
2. Join Tables: It involves merging or joining multiple data tables.
3. Filtering: It involves filtering relevant data and discarding everything else to increase the data transformation process.
4. Aggregation: It involves summarizing all rows within a group and applying aggregate functions such as percentile, average, maximum, minimum, sum, and median.
● Loading
The process of building ETL data pipelines ends with the loading of data. The final location of the processed data may differ depending on the business requirement and analysis needed. The target databases or data warehouses to store processed data include the ones mentioned below.
● Flat Files
● SQL RDBMS
● Cloud
Best Practices to Build ETL Pipelines
Here are expert tips to include while building ETL pipelines:
● Utilize ETL logging to maintain and customize the ETL pipeline to align with your business operations. An ETL log keeps track of all events before, during, and following the ETL process.
● Leverage automated data quality solutions to ensure the data fed in the ETL pipeline is accurate and precise to assist in making quick and well-informed decisions.
● Remove all the unnecessary data and avoid using the serial ETL process all the time. The ETL pipeline generates quick and clean output with less data input.
● Set up recovery checkpoints during the ETL process so that if any issues come up, checkpoints can record where an issue occurred, and you do not have to restart the ETL process from scratch.
ETL Pipeline vs. Data Pipeline: The Differences
Data and ETL pipelines are used for moving the data from source to destination; however, they differ. A data pipeline is a set of processes to transfer data in real-time or bulk from one location to another. An ETL pipeline is a specialized data pipeline used to move the data after transforming it into a specific format and loading it into a target database or warehouse.

Wrapping up,
An ETL pipeline is an important tool for businesses that must process large amounts of data effectively. It enables businesses to combine data from various sources into a single location for analysis, reporting, and business intelligence. AWS Glue, Talend, and Apache Hive are the best tools for building ETL pipelines. Companies can build scalable, dependable, and effective automated ETL pipelines that can aid business growth by adhering to best practices and utilizing the appropriate tools.
Mindfire Solutions can help you support ETL throughout your pipeline because of our robust extract and load tools with various transformations. Visit our website today and talk to our experts.
0 notes
Text
Best Practices in SAS Programming: Ensuring Code Efficiency and Performance
SAS (Statistical Analysis System) programming is a powerful tool used by data professionals for statistical analysis, data management, and reporting. Whether you’re working with large datasets in clinical trials, performing business analysis, or conducting complex predictive modeling, optimizing code efficiency and performance is essential. Writing efficient and well-performing SAS code not only speeds up the process but also improves the accuracy and reliability of your results.
In this article, we’ll explore best practices in SAS programming that can help ensure your code runs efficiently, produces accurate results, and remains easy to maintain.
1. Optimize Data Access
Data access is one of the first things to consider when optimizing SAS code. The more efficiently you can access and manipulate your data, the faster your code will run.
Use Indexing
When working with large datasets, indexing is a key technique. By creating indexes on key variables, SAS can retrieve data faster, reducing the time it takes to search through large datasets. Indexing should be applied to frequently used columns, such as those used for sorting or joining datasets.
Efficient Data Management
Keeping your data in memory rather than repeatedly reading from disk can enhance performance. By managing memory settings in SAS, you can load data into memory, which significantly speeds up processing times, especially for larger datasets.
2. Minimize Data Movement
Data movement refers to the unnecessary reading, writing, or transferring of data between different locations. Reducing this helps to improve overall performance.
Use Efficient Filtering
Instead of filtering data after loading it into memory, try applying conditions during the initial data retrieval process. This can reduce the amount of data you need to load into memory and process. For example, filtering data directly in the where clause of queries can significantly speed up your operations.
Avoid Unnecessary Duplicates
Duplicating data unnecessarily can waste time and resources. Instead of creating multiple temporary datasets, merge or join datasets directly in SAS to minimize overhead. Reducing the number of intermediate datasets you create will help keep the process lean and efficient.
3. Leverage Efficient Procedures
Certain SAS procedures are optimized to handle large datasets efficiently. As a SAS programmer, it’s essential to know which procedures will deliver the best performance for specific tasks.
Choose the Right Procedures
For instance, when summarizing data, PROC MEANS is often more efficient than PROC SQL for large datasets, as it uses specialized algorithms for calculating summary statistics. Similarly, when sorting datasets, PROC SORT is optimized for performance and can be faster than alternatives.
4. Write Efficient Loops and Macros
Loops and macros are common in SAS programming for automating repetitive tasks. However, if not used properly, they can become bottlenecks in your code.
Minimize the Use of Loops
While loops are a great tool, inefficient loops that process data one step at a time can slow down execution, especially with large datasets. Instead, use vectorized operations where possible to handle multiple data points in a single operation.
Optimize Macro Usage
Macros are powerful in SAS because they allow you to write reusable code. However, overusing macros or creating overly complex ones can hurt performance. Ensure that your macros are efficient and only used when necessary, and keep them simple to avoid unnecessary complexity.
5. Optimize Output and Reporting
Generating output reports such as tables and graphs can sometimes cause performance issues. By optimizing this process, you ensure that your results are produced quickly and efficiently.
Minimize Unnecessary Output
When generating reports, avoid including unnecessary rows or columns in your output. Directing output to external files, such as HTML or PDF, rather than displaying it on the screen or in the log, can improve both speed and usability.
Use Efficient Graphing Procedures
For complex visualizations, using the appropriate graphing tools in SAS, such as ODS GRAPHICS, can provide better performance than older procedures. These tools are specifically designed to handle large datasets while producing high-quality visual output.
Watch the video here:
youtube
6. Maintain Readable and Modular Code
Efficiency is important, but readability and maintainability are equally critical. Clean, well-organized code is essential for long-term success in SAS programming, especially when working in a team environment.
Add Meaningful Comments
Commenting your code is essential for explaining the logic behind complex operations, the purpose of specific procedures, and any assumptions you’ve made. Proper comments help others (and your future self) understand the code and maintain it more easily.
Use Modular Programming
Break down your code into smaller, reusable modules. This not only improves readability but also helps in debugging and testing specific sections of the code more efficiently. Consider using macros to encapsulate common tasks and avoid redundant code.
Conclusion
Optimizing SAS programming practices is essential for improving both the efficiency and performance of your data analysis. By focusing on effective data access, reducing unnecessary data movement, using the right procedures, and writing clean, modular code, you can enhance the speed and reliability of your SAS applications.
Remember, while performance is crucial, clarity and maintainability should not be sacrificed. By balancing both, you can create high-performing SAS code that is easy to manage and scale for future projects.
#sas programming#sas programming tutorial#sas tutorial#sas tutorial for beginners#Code Efficiency#Code Performance#Youtube
0 notes
Text
Demystifying SQL Pivot and Unpivot: A Comprehensive Guide
CodingSight
Demystifying SQL Pivot and Unpivot: A Comprehensive Guide
In the realm of data management and analysis, SQL Pivot and Unpivot operations shine as invaluable tools that enable the transformation of complex datasets into meaningful insights. This article is a deep dive into the world of SQL Pivot and Unpivot, providing a comprehensive understanding of their functions, applications, and when to employ them.
Defining SQL Pivot
SQL Pivot is a data manipulation technique that revolves around the reorganization of rows into columns, facilitating a shift from a "long" format to a more reader-friendly "wide" format. This operation streamlines data analysis and reporting, making it indispensable in numerous scenarios.
The Mechanism Behind SQL Pivot
To execute a Pivot operation, you must specify the columns that should become new columns in the output, along with the values that will fill these columns. Typically, an aggregate function is employed to compute values for each new column. Here's a simple example to illustrate this:

In this instance, data is pivoted to display total revenue for each product and salesperson. The SUM function serves to aggregate the revenue values.
When to Employ SQL Pivot
SQL Pivot is the ideal choice when you need to transform data from a long format into a wide format for enhanced reporting or analysis. Common use cases include:
Generating sales and revenue reports, as exemplified above.
Creating cross-tabulated reports for survey data.
Converting timestamped data into time series data for trend analysis.
Understanding SQL Unpivot
Exploring SQL Unpivot
SQL Unpivot operates as the antithesis of Pivot. It reverses the process by transforming wide-format data back into a long format, which is more conducive to specific analytical tasks. Unpivot is used to normalize data for further processing or to simplify the integration of data from diverse sources.
The Mechanics of SQL Unpivot
Unpivot works by selecting a set of columns to convert into rows. You must also specify the column that will store values from the chosen columns and the column that will hold the original dataset's column names. Here's an illustrative example:

In this example, the data is unpivoted, returning to its original long format. The "Product" column values become new rows, while the "Revenue" column houses the corresponding values.
When to Utilize SQL Unpivot
SQL Unpivot is indispensable when you need to normalize data or amalgamate information from multiple sources with varying structures. Common use cases include:
Analyzing survey data collected in a cross-tabulated format.
Merging data from different departments or databases characterized by distinct column structures.
Preparing data for machine learning algorithms that require specific input formats.
Conclusion
SQL Pivot and Unpivot operations emerge as indispensable assets in the realm of data manipulation and analysis. Pivot facilitates the transformation of data for improved reporting and analysis, while Unpivot streamlines data normalization and the integration of disparate information sources. Mastery of these techniques empowers data analysts, business intelligence professionals, and data scientists to unlock the full potential of their data, thereby enabling better decision-making and the revelation of hidden insights. Whether you're a seasoned data professional or just embarking on your data journey, SQL Pivot and Unpivot operations are vital tools to have at your disposal, ready to reveal the true potential of your data. Start exploring their capabilities today and embark on a data-driven journey of discovery and transformation.
0 notes
Text
Merging in Data Analyst
Data Analyst Course Online, Merging, or data merging, is a critical process in data analysis where multiple datasets are combined to create a unified and comprehensive dataset. This is often necessary because data may be collected and stored in different sources or formats. Here's an overview of data merging in data analysis:
Why Data Merging is Important:
Completeness: Merging data from various sources can help fill gaps and provide a more complete picture of the phenomenon or topic being studied.
Enrichment: Combining different datasets can enhance the information available for analysis by adding new variables or dimensions.
Comparative Analysis: Merging allows for the comparison of data from different sources, such as sales data from multiple regions or years.
Common Methods of Data Merging:
Joining: In relational databases and tools like SQL, merging is often achieved through joins. Common join types include inner join, left join, right join, and full outer join. These operations link rows in one dataset with rows in another based on a specified key or common attribute.
Concatenation: When merging datasets with the same structure vertically, concatenation is used. This is common in scenarios where data is collected over time and stored in separate files or tables.
Merging in Statistical Software: Tools like R and Python offer functions (e.g., merge() in R or pd.merge() in Python) that facilitate dataset merging based on specified keys or columns.
Data Integration Tools: For large and complex data integration tasks, specialized data integration tools and platforms are available, which offer more advanced capabilities for data merging and transformation.
Challenges in Data Merging:
Data Consistency: Inconsistent data formats, missing values, or conflicting information across datasets can pose challenges during merging.
Data Quality: Data quality issues in one dataset can affect the quality of the merged dataset, making data cleaning and preprocessing crucial.
Key Identification: Identifying the correct keys or columns to merge datasets is essential. Choosing the wrong key can result in incorrect merging.
Data Volume: Merging large datasets can be computationally intensive and may require efficient techniques to handle memory and performance constraints.
Data merging is a fundamental step in data analysis, as it allows analysts to work with a more comprehensive dataset that can yield deeper insights and support informed decision-making. However, it requires careful planning, data preparation, and attention to data quality to ensure accurate and meaningful results.
0 notes
Text
How to Create a Tableau Prep Flow: A Step-by-Step Guide for Beginners

When working with raw, unstructured data, cleaning and preparing it is one of the most crucial steps in the analytics process. That’s exactly where Tableau Prep shines. This powerful tool helps users visually shape, clean, and combine data—without writing complex code or scripts.
In this guide, you’ll learn how to create a Tableau Prep flow step by step, perfect for both beginners and professionals aiming to streamline their data preparation process.
What Is Tableau Prep?
Tableau Prep is a dedicated data preparation tool within the Tableau ecosystem. It allows you to connect to multiple data sources, clean and transform your data, merge tables, and output structured datasets ready for visualization in Tableau Desktop.
Key Components of Tableau Prep
Input: Load raw data from various sources.
Cleaning Steps: Modify and fix data issues visually.
Joins/Unions: Combine data from multiple tables or files.
Output: Save the cleaned data for use in Tableau dashboards.
Step-by-Step: How to Create a Tableau Prep Flow
Step 1: Open Tableau Prep Builder
Launch Tableau Prep Builder and start a new flow or open an existing one. The intuitive interface makes it easy to get started right away.
Step 2: Connect to Your Data
Click Connect to Data and select your source. Tableau Prep supports:
Excel files
CSV files
SQL databases
Google Sheets, and more
Choose the relevant tables or sheets to include in your flow.
Step 3: Add and Configure Input Steps
Drag your selected data into the workspace, creating an Input Step. Here you can:
Rename columns for clarity
Remove unnecessary fields
Apply filters to limit data size
If you’re pursuing the Best Tableau classes in Chandigarh, you’ll find hands-on sessions greatly simplify mastering this step.
Step 4: Clean Your Data
Add a Clean Step by clicking the plus (+) icon next to your Input Step. Tableau Prep offers tools to:
Split fields for better structure
Remove null or invalid values
Change data types to match your needs
Group and replace similar values to fix inconsistencies
Visual data profiles help you quickly spot and resolve data quality issues.
Step 5: Combine Data with Joins or Unions
Need to work with multiple tables? Use these steps:
Join Step: Match records from two datasets using common fields.
Union Step: Stack rows from different tables vertically.
Tableau Prep shows visual feedback, letting you verify joins or unions instantly.
Step 6: Aggregate Your Data (Optional)
If summarizing data is required—like total sales by region—add an Aggregate Step. Select fields to group by and choose aggregation types such as sum, average, or count.
Step 7: Output Your Data
Once your flow is ready, click Add Output. You can export your cleaned data as:
Tableau Data Extract (.hyper)
CSV file
Publish directly to Tableau Server or Tableau Cloud
Name your output file, select a destination, and run the flow to generate your cleaned dataset.
Best Practices for Tableau Prep
Always preview your output to ensure accuracy.
Use descriptive names for each step to keep your workflow organized.
Document your process for easy collaboration and future updates.
Save flows as templates to reuse for repetitive tasks.
Conclusion
Creating a Tableau Prep flow is a straightforward yet powerful way to transform raw data into clean, structured information ready for analysis. Thanks to its visual, drag-and-drop interface, Tableau Prep makes data cleaning accessible—even for those without technical backgrounds.
Whether you’re self-learning or enrolled in the Best Tableau classes in Chandigarh, mastering Tableau Prep is an essential skill for any aspiring data professional. It not only saves time but also ensures your analysis is built on high-quality, reliable data.
Start experimenting with Tableau Prep today and take your data visualization journey to the next level!
1 note
·
View note