#netflow-capable networking
Explore tagged Tumblr posts
Visit Tumblr Blog
Explore Tumblr blogs with no restrictions, modern design and the best experience.
Last Seen Tumblr Blogs


Fun Fact
China blocked Tumblr because of pornography and censorship problems in 2013.
Text
48-port Gigabit PoE+ Switch CISCO C9200L-48P-4G-E
48-port Gigabit PoE+ + 4x1G Uplink Switch CISCO C9200L-48P-4G-E – Catalyst 9200L 48-port PoE+ 4x1G uplink Switch, Network Essentials. – Layer 3 capabilities, including OSPF, EIGRP, ISIS, RIP, and routed access. – Advanced network monitoring using Full Flexible NetFlow. – Cisco Software-Defined Access (SD-Access) + Simplified operations and deployment with policy-based automation from edge to…
0 notes
Text
10 Best Network Monitoring Tools (June 2024)
New Post has been published on https://thedigitalinsider.com/10-best-network-monitoring-tools-june-2024/
10 Best Network Monitoring Tools (June 2024)
Effective network monitoring is crucial for maintaining the performance and reliability of today’s complex IT environments. With the right tools, network administrators can proactively identify and resolve issues before they impact end-users. In this blog post, we’ll explore some of the best network monitoring solutions available, including both cloud-based platforms and open-source options.
Auvik is a cloud-based network monitoring and management platform designed to give IT teams full visibility and control over their networks. It automates many complex and time-consuming network management tasks, allowing administrators to work more efficiently. By providing real-time network mapping, detailed device information, and intelligent alerts, Auvik enables IT professionals to proactively monitor network health and quickly troubleshoot issues.
One of Auvik’s standout capabilities is its ability to automatically discover and inventory all devices on the network within minutes of deployment. It creates dynamic, interactive topology maps that visualize physical and logical connections between devices. Auvik also provides in-depth traffic analysis to easily identify who is on the network, what they are doing, and where their traffic is going. With features like automated config backups and an intuitive dashboard to access key network data from anywhere, Auvik is a comprehensive tool to streamline network management.
Key features of Auvik include:
Automated network discovery and inventory that provides a complete view of all network devices
Dynamic network mapping to visualize physical and logical network topology
Intelligent network traffic analysis to monitor bandwidth usage and identify traffic patterns
Automated configuration backups and easy restore to quickly recover from network issues
Extensive integrations with popular IT platforms and a powerful API to build custom workflows
Visit Auvik →
SolarWinds is a leading provider of powerful and affordable IT management software. Their flagship product for network monitoring is called Network Performance Monitor (NPM). NPM is designed to provide comprehensive network monitoring capabilities that allow IT professionals to quickly detect, diagnose, and resolve network performance issues and outages.
SolarWinds NPM can automatically discover network devices and start monitoring them within hours of deployment. It provides real-time visibility into the health and performance of routers, switches, firewalls, load balancers, wireless access points, and any other SNMP-enabled devices. NPM uses a web-based interface with customizable dashboards, views, and charts to present critical performance metrics at a glance. It also includes advanced alerting capabilities to notify administrators of issues before they impact end-users.
In addition to NPM, SolarWinds offers several other tools that extend its network monitoring capabilities. NetFlow Traffic Analyzer provides detailed visibility into bandwidth usage by application, protocol, and IP address group. Network Configuration Manager automates network configuration and change management. IP Address Manager streamlines IP address management with integrated DHCP and DNS servers. Taken together, these tools provide a comprehensive and scalable network monitoring solution.
Key features of SolarWinds network monitoring tools include:
Automated network discovery and mapping to quickly inventory devices and visualize topology
Customizable dashboards, views, and reports to present key performance metrics and health data
Over 1200 pre-built templates for monitoring Cisco, HP, Dell, Juniper, and other network device vendors
Advanced alerting with dynamic baseline thresholds and dependencies to reduce false alarms
PerfStack performance analysis dashboard for easy cross-stack data correlation and root cause identification
Visit SolarWinds →
LogicMonitor
LogicMonitor is a SaaS-based infrastructure monitoring platform that provides unified visibility into complex and hybrid IT environments. It offers comprehensive monitoring capabilities across networks, servers, cloud resources, applications, and more. By collecting metrics, logs, and traces through an agentless collector architecture, LogicMonitor delivers real-time insights into the health and performance of the entire technology stack.
One of LogicMonitor’s key strengths is its ability to automatically discover and monitor devices within minutes of deployment. It creates dynamic topology maps to visualize relationships between critical resources. LogicMonitor also leverages AI and machine learning for advanced capabilities like anomaly detection, forecasting, and intelligent alerting. With customizable dashboards, pre-configured alert thresholds, and extensive integrations, LogicMonitor optimizes digital experiences while consolidating tools and reducing operational overhead.
Key features of LogicMonitor include:
Automated discovery and monitoring of devices, cloud resources, and applications
Dynamic topology mapping to visualize relationships and dependencies
AI-driven insights for anomaly detection, forecasting, and smart alerting
Customizable dashboards and reporting for tailored views of key metrics
Extensive integrations with 2000+ technologies and open API for custom data sources
Visit LogicMonitor →
Nagios
Nagios is a powerful open-source IT infrastructure monitoring tool that enables organizations to identify and resolve problems before they impact critical business processes. Originally developed under the name NetSaint in 1999, Nagios has evolved to become one of the most widely used monitoring platforms, with thousands of projects and plugins extending its core functionality. Nagios runs natively on Linux and other Unix-like systems but can also be deployed on Windows using virtualization.
At its core, Nagios is designed to monitor hosts, services, and network devices. It uses a server-client architecture where plugins run on remote hosts to collect data and send it back to the Nagios server for processing. When issues are detected, Nagios can send alerts via email, SMS, or other notification channels to IT staff, allowing them to quickly respond to outages or performance problems. Nagios also provides a web-based interface for viewing monitoring status, generating reports, and managing configuration.
Beyond its core monitoring engine, the Nagios ecosystem includes several other tools to extend its capabilities. Nagios XI provides an enterprise-grade web interface, advanced visualizations, and features like capacity planning and audit logging. Nagios Fusion allows centralized viewing of multiple Nagios instances. Nagios Log Server enables log monitoring and analysis, while Nagios Network Analyzer provides NetFlow-based traffic analysis.
Key features of Nagios include:
Comprehensive monitoring of IT infrastructure components including servers, network devices, applications, and services
Flexible, plugin-based architecture that allows monitoring of virtually any resource
Centralized view of monitoring status via web interface with user-specific views and dashboards
Proactive alerting via multiple channels to ensure rapid response to issues
Extensible ecosystem with add-ons for log monitoring, network analysis, configuration management, and more
Visit Nagios →
Zabbix
Zabbix is a mature and feature-rich open-source network monitoring solution designed for monitoring the availability and performance of IT infrastructure components including servers, network devices, virtual machines and cloud services. It provides a centralized monitoring system that enables real-time monitoring of thousands of metrics collected from servers, network devices and applications.
One of Zabbix’s key strengths is its flexibility and extensibility. It can monitor a wide range of devices and systems using multiple methods including Zabbix agent, SNMP, IPMI, JMX and custom checks. Zabbix also provides powerful data visualization capabilities including custom graphs, network maps, dashboards and reports. With features like anomaly detection, predictive analytics and auto-discovery of devices, Zabbix helps IT teams proactively monitor their infrastructure and quickly troubleshoot issues.
Key features of Zabbix include:
Distributed monitoring with support for remote Zabbix proxies for monitoring across multiple locations
Agentless monitoring using multiple protocols including SNMP, IPMI, JMX, SSH and Telnet
Powerful data visualization with custom graphs, network maps, dashboards and slideshows
Flexible alerting with customizable escalation scenarios and multiple notification channels
Auto-discovery for automatic registration of new devices and application of appropriate monitoring templates
Visit Zabbix →
Datadog is a comprehensive cloud-based monitoring and analytics platform designed to provide real-time visibility into modern IT environments. It enables organizations to monitor their entire infrastructure, including servers, databases, applications, network devices, and cloud services. By collecting, searching, and analyzing metrics, traces, and logs across fully distributed architectures, Datadog empowers IT teams to proactively detect and resolve performance issues before they impact end-users.
Datadog supports over 600 technologies and services out-of-the-box. This allows seamless data collection from various sources, providing a holistic view of the IT ecosystem. Datadog also offers customizable dashboards, intelligent alerts, and collaboration features, enabling teams to efficiently monitor, troubleshoot, and optimize their systems. With its scalable architecture and flexible deployment options, Datadog caters to businesses of all sizes, from startups to large enterprises.
Key features of Datadog include:
Real-time monitoring of servers, containers, databases, and cloud services, with auto-discovery and detailed performance metrics
End-to-end tracing of requests across distributed systems, identifying bottlenecks and optimizing application performance
Centralized log collection, indexing, and analysis, with powerful search and filtering capabilities
Visibility into network traffic, analyzing communication between services, containers, and cloud environments
Customizable dashboards for visualizing key metrics in real-time
Visit Datadog →
AdRem NetCrunch is a comprehensive network monitoring and management solution designed to provide real-time visibility into IT infrastructure. It offers a wide range of features to streamline network monitoring, including auto-discovery of devices, performance monitoring, customizable dashboards, and an intuitive alerting system. NetCrunch runs on Windows and provides an agentless approach to monitoring, making it easy to deploy and scale.
NetCrunch automatically discovers and maps network devices, creating a dynamic, interactive network atlas. This allows IT teams to visualize their network topology, identify dependencies, and quickly locate the root cause of issues. NetCrunch supports monitoring of various devices and systems, including servers, network devices, applications, virtual environments, and cloud services.
Key features of AdRem NetCrunch:
Agentless monitoring using protocols like SNMP, WMI, and SSH
Automatic network discovery and interactive topology mapping
Customizable dashboards and alerts for tailored network insights
Supports monitoring of servers, network devices, VMs, and cloud services
Extensive reporting and integration with IT management platforms
Visit NetCrunch →
Observium is an open-source network monitoring and management platform that offers auto-discovery capabilities to automatically detect and monitor devices on the network, including servers, switches, routers, and more. Observium supports a wide range of device types and operating systems, such as Cisco, Windows, Linux, HP, Juniper, Dell, and others.
Observium boasts a user-friendly web interface, which presents network data through customizable dashboards, graphs, and reports. It collects data using SNMP and stores it using RRD (Round-Robin Database), enabling efficient storage and retrieval of historical performance metrics. Observium also provides alerting features to notify administrators of potential issues or performance degradations.
Key features of Observium:
Automatic discovery of network devices for easy setup and monitoring
Support for a wide range of device types and operating systems
Customizable dashboards and graphs for data visualization
Alerting system to notify administrators of potential issues
Scalable architecture to monitor large and complex network environments
Visit Observium →
Domotz is a comprehensive cloud-based network monitoring and management software designed for MSPs, IT professionals, and enterprises. It provides real-time visibility and control over IT infrastructure, enabling users to work more efficiently, increase productivity, and resolve issues faster. Domotz offers a user-friendly interface and automated features such as network discovery, topology mapping, and device inventory.
Domotz can monitor a wide range of devices, including servers, workstations, printers, routers, switches, firewalls, and IoT devices, regardless of the manufacturer. It supports various monitoring protocols like SNMP, WMI, and SSH. Domotz also provides secure remote access to devices for troubleshooting, as well as network configuration management with backup and restore capabilities.
Key features of Domotz:
Automated network discovery, inventory, and topology mapping
Supports monitoring of diverse devices across multiple sites and networks
Secure remote access for troubleshooting and issue resolution
Network configuration management with backup, restore and change alerts
Intuitive web-based interface with customizable dashboards and reporting
Visit Domotz →
AKIPS
AKIPS is a powerful and scalable network monitoring software designed to provide comprehensive visibility into large enterprise network infrastructures. It offers a fully-featured, fast, and cost-effective solution for monitoring network performance, enabling network engineers to proactively identify and resolve issues before they impact business operations. AKIPS can monitor over one million interfaces and 500,000 flows per second from a single server, making it one of the most scalable network monitoring tools on the market.
One of the standout features of AKIPS is its ability to provide real-time insights and historical data down to one-minute granularity for up to three years. This allows network administrators to quickly identify the root cause of issues and make informed decisions. AKIPS also offers automated device discovery, adaptive polling, syslog and SNMP trap management, NetFlow analysis, and configuration management capabilities, providing a comprehensive toolkit for network monitoring and management.
Key one-line features of AKIPS:
Scalable architecture monitoring over 1 million interfaces from a single server
Real-time insights and 3 years of historical data at 1-minute granularity
Automated network discovery and adaptive polling optimizing SNMP traffic
Advanced syslog, SNMP trap management and alerting for proactive issue detection
NetFlow analysis with up to 500k flows/sec and configuration management tools
Visit AKIPS →
The Bottom Line
Choosing the right network monitoring tool is essential for keeping your IT infrastructure running smoothly. Whether you opt for a comprehensive cloud-based platform, a flexible open-source solution, or a combination of tools, having real-time visibility into your network’s performance is crucial. Consider your organization’s specific needs, budget, and existing IT ecosystem when selecting a monitoring solution. By implementing the right tool or combination of tools, you can proactively identify and resolve issues, optimize network performance, and ensure a seamless experience for your end-users.
#000#2024#agent#ai#alerts#Analysis#Analytics#API#applications#approach#architecture#audit#auvik#backup#backups#Best Of#Blog#box#Business#change#change management#charts#Cisco#Cloud#cloud services#Collaboration#communication#comprehensive#Containers#dashboard
0 notes
Text
does vpn hide from router logs
🔒🌍✨ Get 3 Months FREE VPN - Secure & Private Internet Access Worldwide! Click Here ✨🌍🔒
does vpn hide from router logs
VPN encryption methods
VPN encryption methods play a crucial role in safeguarding online privacy and security by ensuring that data transmitted over the internet remains confidential and secure. Encryption is the process of converting data into a code to prevent unauthorized access, and VPNs use various encryption methods to achieve this.
One of the commonly used encryption protocols in VPNs is Secure Socket Layer (SSL) or Transport Layer Security (TLS). SSL/TLS employs a combination of asymmetric and symmetric encryption algorithms to establish secure connections between the user's device and the VPN server. This method provides a high level of security by encrypting data in transit and authenticating the parties involved.
Another widely used encryption protocol is Internet Protocol Security (IPsec), which works by encrypting data at the IP layer. IPsec operates in two modes – Transport Mode and Tunnel Mode – to secure data communication between devices. It uses encryption algorithms like DES (Data Encryption Standard), 3DES (Triple DES), and AES (Advanced Encryption Standard) to protect data integrity and confidentiality.
Furthermore, VPN services may also utilize OpenVPN, an open-source encryption protocol known for its strong security features and compatibility across different platforms. OpenVPN combines SSL/TLS protocols with custom security algorithms to create secure VPN connections that are resistant to cyber threats and data breaches.
In conclusion, VPN encryption methods are essential for maintaining online privacy and security in today's digital world. By implementing robust encryption protocols like SSL/TLS, IPsec, and OpenVPN, VPN users can enjoy safe and secure internet browsing experiences while protecting their sensitive information from potential cyber attacks.
Router logging protocols
Router logging protocols play a crucial role in network management and security by providing detailed information about network activities, errors, and potential security threats. These protocols ensure that network administrators can monitor and analyze the performance of routers effectively to prevent any disruptions to network operations.
One of the commonly used router logging protocols is Syslog, which enables routers to report events and log messages to a centralized server for analysis. Syslog messages can provide valuable insights into network events such as failed login attempts, interface status changes, and system errors. By collecting and analyzing Syslog messages, network administrators can identify patterns, troubleshoot issues, and enhance network security.
Another important router logging protocol is SNMP (Simple Network Management Protocol), which allows routers to communicate with a network management system (NMS) to collect and monitor device statistics, performance data, and alert notifications. SNMP enables network administrators to proactively manage network devices, monitor bandwidth usage, and detect any abnormalities that may indicate a security breach or network failure.
In addition to Syslog and SNMP, other router logging protocols such as NetFlow and IPFIX (Internet Protocol Flow Information Export) are widely used for traffic analysis, monitoring, and reporting. These protocols provide detailed information about network traffic patterns, source, and destination of data flows, which helps in optimizing network performance, identifying potential security threats, and ensuring compliance with data protection regulations.
Overall, router logging protocols are essential tools for network administrators to maintain network visibility, troubleshoot issues, and enhance network security by providing valuable insights and real-time monitoring capabilities. By leveraging these logging protocols effectively, organizations can ensure the reliability, performance, and security of their network infrastructure.
Privacy features of VPN services
When it comes to ensuring online privacy and security, VPN services offer a robust solution for users looking to safeguard their sensitive information. VPN, or Virtual Private Network, encrypts your internet connection, preventing third parties from tracking your online activities. However, not all VPN services are created equal, and it's essential to understand the various privacy features that reputable providers offer.
One of the key privacy features of VPN services is a strict no-logs policy. This means that the VPN provider does not keep a record of your online activities, ensuring that your browsing history remains private and secure. Additionally, top VPN services offer strong encryption protocols, such as AES-256, to protect your data from cybercriminals and hackers.
Another critical privacy feature to look for in a VPN service is a kill switch. A kill switch automatically disconnects your device from the internet if the VPN connection drops, preventing your IP address and sensitive information from being exposed. Additionally, some VPN providers offer DNS leak protection to ensure that your online activity remains anonymous and cannot be traced back to your device.
Furthermore, reputable VPN services offer a variety of server locations to choose from, allowing users to bypass geo-restrictions and access content from around the world while maintaining their privacy. By connecting to a server in a different location, you can browse the internet as if you were physically located in that region, enhancing your online privacy and security.
In conclusion, VPN services play a crucial role in safeguarding your online privacy. By selecting a VPN provider with robust privacy features such as a strict no-logs policy, strong encryption, kill switch, and DNS leak protection, you can browse the internet with confidence knowing that your data and online activities are secure and private.
VPN tunneling techniques
VPN tunneling is a crucial aspect of ensuring secure and private internet communication. It involves the encapsulation of data within an encrypted tunnel, which helps protect sensitive information from unauthorized access or interception. There are several VPN tunneling techniques used to establish secure connections between devices and networks.
One common VPN tunneling protocol is called Point-to-Point Tunneling Protocol (PPTP). It is known for its ease of setup and compatibility with a wide range of devices. However, PPTP is considered less secure compared to other protocols due to known vulnerabilities.
Another widely used VPN tunneling technique is Layer 2 Tunneling Protocol (L2TP). L2TP is often combined with IPsec (Internet Protocol Security) to enhance security. This combination provides strong encryption and authentication methods, making it a popular choice for creating secure VPN connections.
Internet Key Exchange version 2 (IKEv2) is another VPN tunneling protocol that is known for its stability and ability to quickly re-establish connections in case of network changes. IKEv2 is also highly secure, making it suitable for mobile devices that frequently switch between different networks.
OpenVPN is an open-source VPN tunneling protocol that offers high levels of security and flexibility. It uses SSL/TLS protocols for encryption and authentication, making it a reliable choice for ensuring data privacy.
Overall, VPN tunneling techniques play a critical role in safeguarding online communications and protecting sensitive data from potential threats. By understanding the different protocols available, users can choose the most suitable VPN tunneling technique to meet their security and privacy needs.
Router log analysis techniques
Analyzing router logs is crucial for maintaining network security and optimizing performance. By examining router logs, network administrators can identify potential security breaches, troubleshoot connectivity issues, and optimize network traffic. Here are some effective techniques for router log analysis:
Regular Log Monitoring: Establish a schedule for reviewing router logs to ensure timely detection of any anomalies or suspicious activities. Automated tools can help streamline this process by flagging unusual patterns or unauthorized access attempts.
Identifying Security Threats: Router logs contain valuable information about attempted security breaches, such as login failures, port scans, or unauthorized access attempts. By analyzing these logs, administrators can proactively identify and mitigate potential security threats before they escalate.
Traffic Analysis: Router logs provide insights into network traffic patterns, including peak usage times, bandwidth consumption, and application usage. By analyzing this data, administrators can optimize network performance, allocate resources efficiently, and identify any abnormal traffic patterns that may indicate a security breach or performance issue.
Event Correlation: Correlating events across multiple router logs can provide a comprehensive view of network activity and help identify potential security incidents. By analyzing the sequence of events, administrators can pinpoint the root cause of issues and take appropriate remedial action.
Log Aggregation and Visualization: Aggregating router logs from multiple devices into a centralized logging system allows for easier analysis and visualization of data. Tools such as Splunk or ELK stack (Elasticsearch, Logstash, and Kibana) can help administrators efficiently manage and analyze large volumes of log data.
In conclusion, effective router log analysis is essential for maintaining network security, optimizing performance, and ensuring smooth operation of enterprise networks. By leveraging the techniques outlined above, administrators can proactively identify and address potential security threats and performance issues before they impact business operations.
0 notes
Text
Top 6 Best Network Sniffing Tools In 2022 - A Complete Guide

Top 6 Best Network Sniffing Tools In 2022 - A Complete Guide
Knowing what’s going on with your network from moment to moment is the only way to troubleshoot issues swiftly and avoid downtime. There are lots of tools that give you on-the-fly insights into network performance, but not all are created equal. To help you find the right network sniffer, we’ve ranked the best of the bunch on the market right now.
SolarWinds
As well as supplying products including service desk software for IT departments, SolarWinds also has an impressive Network Performance Monitor package, part of which is the Network Packet Sniffer. As the name suggests, this is capable of quickly identifying the causes of performance snafus, while ensuring that the data that it delves into is displayed in a coherent way. Another benefit of this tool is that it lets you sift through network traffic according to the different types of applications that are being used across the infrastructure. Thousands of apps are supported natively, including common social media solutions, communications services, cloud storage products and much more besides.
Auvik
Like SolarWinds’ offering, there’s a lot to be said about the user-friendliness of Auvik’s competing network sniffing tool. You don’t need to be a mastermind to work out what’s being tracked and analyzed by the software, and this kind of shallow learning curve is very useful in any new tool that’s in line for adoption at your organization. It’s also worth noting that this service is browser-based, which is convenient in terms of not being reliant on a local installation, or being beholden to a specific OS ecosystem.
Wireshark

So far we’ve discussed network sniffing tools that offer free trials, but require payment to unlock the full functionality of the premium experience in the long term. With Wireshark, you get an open source tool that’s free to employ and is backed up by a large community of users, along with a vast knowledge base which you can draw upon to make the most of it. It supports Windows, Linux, MacOS and other platforms, and makes it easy not only to track traffic, but also export the data that’s gathered in whatever format you prefer for additional analysis and reporting elsewhere.
ManageEngine
The NetFlow Analyzer from ManageEngine may have a fancy name, but it also manages to have a clear and unfussy interface and a solid set of capabilities that make it worth considering alongside its better known rivals. You can use it to identify patterns in network traffic, and to oversee the ebb and flow of resource usage, logging everything as time passes and empowering admins with the info they need to make improvements to performance.
Paessler
Paessler’s PRTG platform is a wide-ranging monitoring solution in the same vein as SolarWinds’ equivalent suite, and factors in monitoring for traffic from the web, alongside things like file transfers and mail servers as well. As you’d expect from an enterprise-focused tool, it comes at a price, but you can try it out for free for up to 30 days before committing, which is helpful for budget management. One selling point of this tool is that it offers support for mobile operating systems like Android and iOS, and so is arguably more flexible than some of its rivals.
TCPDump
The most basic of network sniffing is provided by TCPDump, which is entirely command-line based and follows the open source approach to development. You’ll need to get to grips with the syntax it deployed to execute user instructions, but once you have it’s a lightweight and efficient monitoring solution. The thing to remember is that you can always change how you monitor your network, so don’t get wedded to one tool if there’s a better option out there. Read the full article
4 notes
·
View notes
Text
Simple Network Management Protocol
Simple Network Management Protocol
The Simple Network Management Protocol (SNMP) is an approach for managing network-attached devices. The SNMP, which was initially created in 1988, is designed to monitor the status of network components and network items that include software, hardware, link utilization, interface temperatures, processors, memory utilization and more. SNMP operates on all equipment used for private internet access like routers, switches and servers. As a protocol, SNMP almost exclusively operates over the Internet Protocol (IP), typically using port 161 or 161U where 161 is the standard port used by SAP for version 1 of the protocol and 161U is the standard port used by SAP for v2 of the protocol.
What is SNMP?
The SNMP is an open standard that defines how network management applications, such as Hewlett Packard's Network Node Manager (NNM) or Cisco's Integrated NetFlow Monitor (INM), can be integrated into network devices to monitor and control the devices' performance. The SNMP is not a network operating system, nor is it a management application. It is a set of standards for management applications that provide information about the network device. The SNMP uses a management information base (MIB) to store information about the device. This information is shared with management applications. The MIBs that describe a device are contained in an object. A management application can obtain information about a device by accessing the object that describes the device.
MIB
The MIB defines the information that is stored about the device and its operation. The MIB is a database that contains definitions for objects that describe the device and its operation. The MIB defines the SNMP operations that can be performed on the device.
SNMPv1
SNMPv1 is defined in RFC 1157. The SNMPv1 protocol has three different modes of operation:
A Management Information Base (MIB)
A Management Information Tree (MIT)
A Simple Network Management Protocol (SNMP) Agent
SNMPv2
SNMPv2 is defined in RFCs 1912 and 2161.SNMPv2 supports the following three MIBs:
The Management Information Base (MIB)
The Management Information Tree (MIT)
The Simple Network Management Protocol (SNMP) Agent
SNMPv3
The SNMPv3 protocol is designed to provide new capabilities to the SNMP protocol. The new capabilities include:
Improved scalability
Improved security
Improved management of large networks
Improved MIBs
Improved management of large networks
Increased scalability
SNMP Objectives
The SNMP is a protocol for network management. The SNMP has multiple objectives:
To support network management applications that access and control network devices.
To support the transfer of management information about the device.
To define a set of objects that describe the device.
Provide a mechanism for management applications to access and control devices.
Provide a mechanism for management applications to transfer management information about the device.
SNMP Authentication
SNMP authentication is the process of proving that a message was sent by a user with the right authorization. SNMP authentication is performed when the management application receives a message.
Common SNMP Errors
Errors that occur when SNMP operations are performed. The following common errors that can occur when SNMP operations are performed.
Invalid OID: An OID is not valid.
Invalid MIB: An MIB is not valid.
No MIB No: MIB exists.
Unsupported OID: An OID is not supported.
Unsupported MIB: An MIB is not supported.
SNMP Traps
The SNMP Trap is a mechanism that allows a management application to notify another management application that a particular event has occurred. The management application can notify the other management application by sending a trap message. A trap is sent by a management application when a specific event occurs. The management application must specify the SNMP version and the type of trap. The management application must specify the OID that identifies the event that occurred. The OID is an OID that identifies a particular event. There are three types of traps that can be sent by the management application:
An SNMPv1 Trap
An SNMPv2 Trap
An SNMPv3 Trap
2 notes
·
View notes
Text
What all you need to know about WS-C3650-24TD-L?
In order to provide wired and wireless services on a single Cisco IOS XE Software-based platform, Cisco has developed the Cisco Catalyst 3650, (WS-C3650-24TD-L) which may function alone or as part of a stacked configuration. Through this, Cisco has been at the forefront of introducing several advanced features across wired and wireless networks, including high availability based on stateful switchover (SSO) on stacking, granular quality of service (QoS), security, and Flexible Netflow (FNF).
With the wired and wireless functions combined into a single Cisco IOS Software image, there are fewer software images for customers to qualify and certify before they can turn them on in their network. The network's complexity, operational simplicity, and total cost of ownership (TCO) are all improved by having only a single console port for command-line interface (CLI) control across wired and wireless services.
What is the use of WS-C3650-24TD-L?
Convergence of wired and wireless networks into a single infrastructure is made possible by the Cisco Catalyst 3650 Series, the next generation of enterprise-class standalone and stackable access-layer switches. The 3650 Series relies on the cutting-edge Cisco StackWise-160 platform and makes use of the innovative Cisco Unified AccessTM Data Plane (UADP) ASIC (ASIC).
This switch can facilitate consistent policy enforcement between wired and wireless networks. As well as application visibility, application optimization, and high availability. Modular and field-replaceable redundant fans and power supplies, as well as complete IEEE 802.3at Power over Ethernet Plus (PoE+) compliance, are all features of the Cisco Catalyst 3650 Series multigigabit switches.
You may install switches from the 3650 Series in remote branches. Also, offices where space is at a premium by taking advantage of their 12-inch shallower depth form factor. The 3650 multigigabit switches also work with both new and old wireless protocols and speeds. It includes 802.11ac Wave 2, while still making use of the same wired network. Increase wireless productivity while decreasing the total cost of ownership with the 3650 Series switches.
Enterprise-grade Cisco Catalyst 3650 Series access-layer switches. It can be used alone or stacked to establish the groundwork for the complete convergence of wired and wireless networks. The 3650 Series is based on Cisco's cutting-edge StackWise-160 architecture. It uses the company's latest application-specific integrated circuit, the Unified Access Data Plane (UADP) (ASIC). These switches can facilitate consistent policy enforcement between wired and wireless networks, application visibility, application optimization, and high availability.
The Cisco Catalyst 3650 Series multigigabit switches have redundant fans and power supplies that are modular. Additionally, it can be replaced in the field, as well as complete IEEE 802.3at Power over Ethernet Plus (PoE+) compliance. Switches from the 3650 Series can boost wireless productivity and lower the total cost of ownership.
The uplink ports on Cisco Catalyst 3650 Series Switches are hardwired in. And the devices come with three fans that may be swapped out in the field. By default, just one power supply is included with the purchase of a Cisco Catalyst 3650 Series Switch.
The Cisco WS-C3650-24TD-L Switch is a standalone unit with optional stacking capabilities. Also, it was enabled by purchasing the StackWise stacking upgrade kit (C3650-STACK-KIT). Moreover, an extra power supply unit for twin redundant power sources.
0 notes
Text
Diagnose Microsoft Teams AV and end-to-end network performance issues
Exoprise released its long-awaited Teams Audio Video Conferencing sensor. This sensor fully tests Audio/Video end-to-end capacity, throughput, and network performance through the actual underlying Microsoft Teams and Azure infrastructure. The Teams AV sensor provides deep insight into a network’s capability to handle the Teams/Skype Unified Communications (UC) platform. Desktop, Collaboration, and Network administrators can now easily diagnose and proactively plan a Microsoft Teams rollout and migration.
Exoprise is the only vendor that can automate, test, and proactively monitor the true experience of the Team platform. When you want to know how Microsoft Teams is performing before that important call or conference, you need Exoprise CloudReady.

Microsoft Teams relies on WebRTC and Exoprise captures low-level network characteristics without the need for SSL inspection or complex Netflow instrumentation. The Teams AV Conferencing sensor relies on a hosted media bot to proactively test and monitor low-level the UC workflow, Audio, and Video streams in real-time. Use the Teams AV sensor for accurate networking testing as recommended for deploying and assessing network capacity for Microsoft Teams according to Microsoft.
Microsoft Teams Built Atop WebRTC
Microsoft Teams, both for regular browsers and their Teams App relies on WebRTC for audio and video communications. WebRTC is a free and open standard that provides browsers and mobile apps with the ability to perform Real-Time Communications (RTC) via simple JavaScript compatible APIs. The WebRTC project is supported by Google, Mozilla, and now with the announcement of Microsoft Edge to be based off of Chrome/Chromium, also by Microsoft.
WebRTC is responsible for the various workflows involved in establishing real-time communications between peers or to central servers. It utilizes many standards such as Session Traversal Utilities for NAT (STUN) and Traversal Using Relays around NAT (TURN) for discovering and optimizing the connections. Once network discovery is complete, WebRTC handles the required signaling and session establishment protocols such as JSEP, ICE, SIP, SDP, NAT and UDP/TCP. We help you ascertain the suitability of WebRTC in your LAN/WAN environment.
As opposed to the legacy Skype for Business protocols, WebRTC is an open standard that can more easily be supported on mobile clients or Linux desktops. Hurrah!
Skype Transition to Microsoft Teams
At the end of July, Microsoft announced that the Skype for Business Online Service will be ending on July 31, 2021 and that Microsoft is encouraging its customers to use the Microsoft Teams service instead.
The writing was on this wall for sometime. On-premises Skype for Business Server will exist for some time but Microsoft is putting its full weight behind Microsoft Teams. Thankfully, Exoprise has arrived with its Microsoft Teams monitoring solutions in the nick of time. Now, armed with a cadre of CloudReady Teams, VoIP and Skype sensors, Unified Communications administrators can properly baseline, test, and evaluate their network for Microsoft Teams performance.
Watch our Video on Monitoring Microsoft 365 Teams
See at the bottom
How Exoprise Monitor’s Microsoft Teams
Deploying and setting up an Exoprise Teams AV Conferencing Sensor is easy. Because the sensor utilizes an Azure-hosted Teams Bot to stream audio and video into a client conference call, it doesn’t require a peer-to-peer setup like the Exoprise Skype sensors. However, it does require more maintenance and infrastructure from the team at Exoprise.
Easy Deployment
All that’s required for setting up a Teams AV Conference sensor is a Teams account and one-time administrative access to the tenant so that it can accept an Exoprise OAuth registration for the Bot to join the meaning. Accepting the OAuth registration currently requires Tenant administrative rights but the OAuth registration only needs to happen once for the entire tenant. See the following screenshots for reference:


Configure A CloudReady Teams AV Conferencing Sensor:
Supply the credentials for a valid account within your tenant. This can be a managed or federated account — the sensor supports both and both types of accounts should be tested.
Optionally, if you supply a specific team then you must create the team first and make sure that the account is a member of the team. If you leave it blank, then the account must have permission to create a team. It will create a team in the form of exoprise_test_team(account_name). This is detailed in the introduction (please read!).
For step 3, if you’ve already accepted our Teams AV Bot OAuth registration, then you can just select it from the drop down list. You may have other domains within your tenant so choose the correct registration that corresponds to the domain of the test account.
If this is your first time setting up a Teams AV Sensor, then you will need to accept our OAuth registration and you’ll need an account that has administrative access just to accept the OAuth registration. You don’t need an admin account for the sensor access, just for the one time registration acceptance. Supply a registration label and click ‘Add New’. You’ll see a normal Azure AD popup to accept our OAuth registration like the following screenshot.

That’s it. That is all it takes to configure a Teams AV Conferencing sensor and begin monitoring end-to-end Microsoft Teams network performance. Once you proceed to the next step, your configuration will be validated and then onto deployment to a CloudReady private sites you’ve deployed.
Start a Free Trial Today. Its Simple To Get Started
Every day customers start and deploy a full suite of sensors in under 5 minutes. Give it a try for network benchmarks, root cause analysis and complete visibility into ALL of Office 365.
FREE TRIAL
Diagnose Microsoft Teams Audio Video Performance Issues
Once you deploy a Microsoft Teams AV Sensor, it will create conference sessions (Meet Now) and invite the Exoprise AV bot to join. When the Bot joins it starts streaming audio and video content into the conference which the sensor monitors. High level actions and low-level WebRTC metrics about the session, network and performance of the audio and video content are aggregated for analysis and alarming. Below are metric details and how they are used to diagnose and baseline Microsoft Teams performance on your network:
Audio / Video Streams
The streaming of audio and video from the Exoprise AV bot is monitored from the WebRTC perspective and a compliment of statistics is captured:
Max Audio Jitter The maximum audio jitter as perceived by the client is sampled and recorded once a second and aggregated for the session. Jitter, or network jitter, is the variance in time delay in milliseconds (ms) between data packets over a network. The technical term for jitter is “packet delay variance”. Generally, you want the maximum audio jitter to be below 20ms but periodic spikes in the 20ms-30ms with average jitter in the single digits is acceptable.
Mean (Avg) Audio Jitter Avg audio jitter is the aggregate average over the life of the session. You definitely want to see this value below 20ms or your users conference experience will be poor. Average jitter values of 20ms or higher and higher spikes in Max Jitter will indicate poor network quality for Microsoft Teams.
Audio Packet Loss Percentage audio packet loss in either audio or video channels is very detrimental to the experience of a conference or meeting. Audio packets are smaller and more monotonic, so if you see audio packet loss it is a strong indicator of poor networking and congestion.
Comparing any of these metrics to the CloudReady crowd helps you in pinpointing the problem. If the crowd metrics are exhibiting the same patterns as your own sensors, that points to a shared problem with Teams or Azure infrastructure. If the your deployed sensors are only experiencing detrimental affects then the problem is localized to your own networks or where the sensor is deployed.
Video Packet Loss Sessions with elevated video packet loss will have jumpy or missed video frames. Video packets are larger and more consumptive within the transport so more video packet loss spikes are common. Most AV protocols and codecs, including WebRTC, prioritize audio channels over video because it is more detrimental to have audio drop than lost video frames.
Audio & Video Bitrate Lower streaming bitrates are also an indicator of poor conference networking. Most AV transports and codecs try to maintain a consistent bitrate or Bits-Per-Second (bps). If the Teams client can’t sustain a healthy bitrate then it will have make up for lost packets with frame skipping, audio cutouts, or attempting to synthesize the lost bits (error correction). You should see a consistent audio bitrate and a more variable video bitrate (they’re bigger packets and less prioritized).
Of interest for advanced telemetry in the Teams AV sensor is NACK, FIR and PLI packets. These special WebRTC transport packets are generated used in response to poor networking conditions and the detection of dropped frames or audio samples. Basically, the client sends a “reset” to the server or peer and requests that the missing bits or frames are resent or re-synchronized. If these event occurrences are sustained then you have some poor networking on your hands.
Meeting Connection
The metrics on the Meeting Connection tab cover the overall quality of the connection for the conference to the actual Microsoft Teams hosting infrastructure.
Max RTT The maximum round-trip time (RTT) is a measure of latency as perceived by the WebRTC client throughout the session. Every real-time connection (RTC) stack utilizes protocol headers, fields and control packets to evaluate round-trip times during sessions for quickly determining when the streams may be out of sync or underlying QoS issues. Max RTT is the maximum round-trip time that was seen during the session. Sustained Max RTT rates above 300ms between the client and the edge/media servers will reflect a poor conferencing experience.
Avg RTT This is the average round-trip time seen during the session. For good audio/visual conferencing experience you want this Avg RTT to be below 100ms but, ideally, below 50ms.
Teams QoS and Media Quality
Video Frames Per Second Dropped Frames dropped per second indicate the video frames during the conference are dropped per second. Depending on the network quality, and the negotiated video frame size, this number can be higher than expected. The video playback will skip frames and the WebRTC stack will try to compensate for the lost video frames during the session. Also, audio delivery is prioritized over video delivery, the audio samples are smaller, more constant and consistent in packet size.
Video Frames Per Second Received This is a measure of the video frames received and rendered during the Video conference. Currently, the Exoprise AV Bot will choose and downgrade video frame sizes depending on the end-to-end quality of the connection.
Audio Sample Rate Audio samples are sent in 20 millisecond packets and are prioritized over video samples.
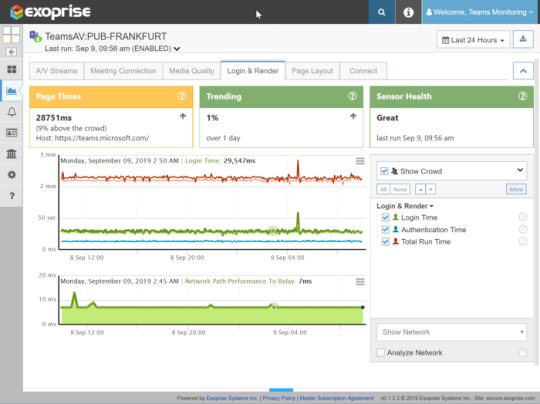
Login & Render, Page Layout & Connect Times
The Microsoft Teams AV Sensor includes metrics for the underlying page navigation, login, authentication, and connection times. Aggregate metrics for the underlying TCP/IP Connection and SSL Timings are also captured for each sensor run. This is an aggregate sample of everything it takes to get into a meeting within Microsoft Teams including signing in and starting a meet-now conference session.
Sample Screenshots of the Teams AV Sensor
It wouldn’t be an Exoprise blog post without the requisite set of screenshots. We believe in presenting screenshots and examples to show prospects and customers that our platform and technology are real. There’s no magical hand-waving when it comes to seeing our sensors in action. Try the new Microsoft Teams Audio Video Conferencing see what you see for yourself.
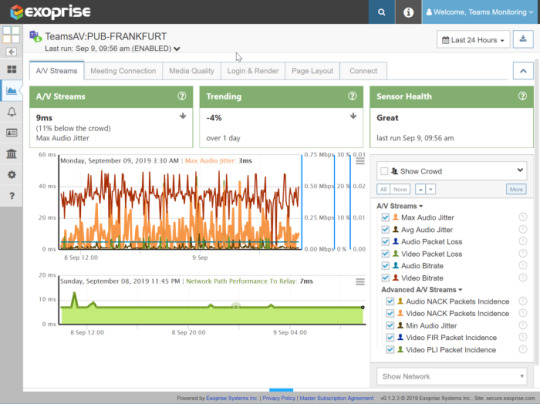
Audio Video Media Stream Metrics including Jitter, Packet Loss, Correction and Bitrate for Teams AV Conferencing


Real User Monitoring of Microsoft Teams from an End-User Perspective
What you read till now was about synthetics. And with everyone working from home these days, IT needs to monitor Teams’ performance from an end-user perspective. So, while synthetic agents can proactively detect Microsoft teams outages, you also need a comprehensive strategy to monitor remote employee digital experience with Teams.
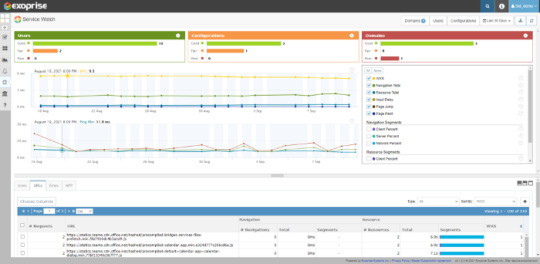
Real user monitoring (RUM) of Teams web app with Service Watch Browser helps your team accomplish this goal by collecting the following metrics.
Web Experience Score (WXS) This quantifiable score is an overall indicator of the experience health and well-being of a remote worker using a web app.
Navigation Total The time it takes to load a particular page.
Resource Total When a page loads, so do its resources. Resource Total measures the time for all the resources to download.
Input Delay The time before a page starts responding to user input.
Page Jump The amount a page shifts when it’s loading.
Page Paint The time it takes for the page to render its largest element.
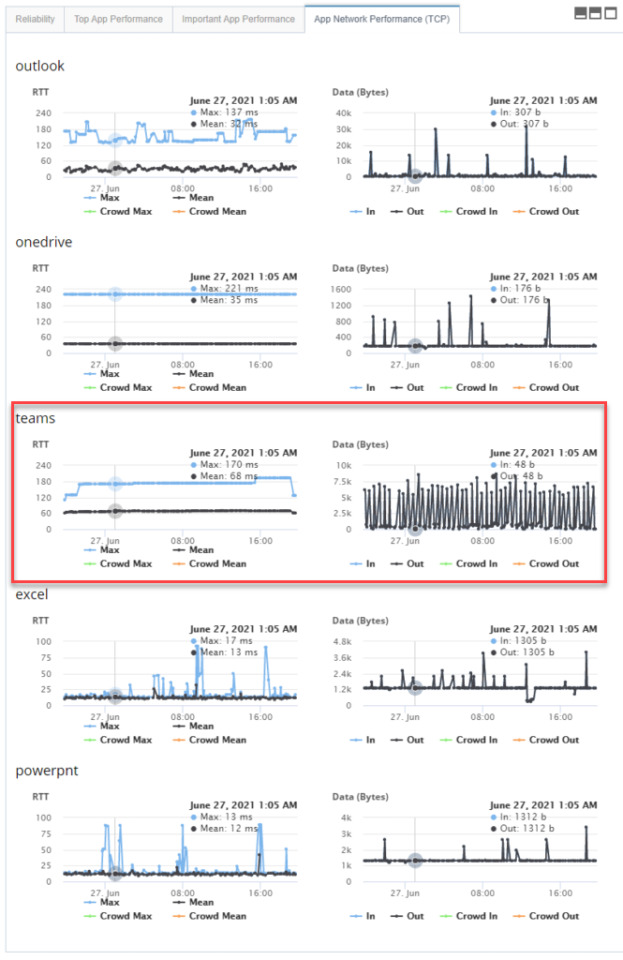
Monitor Microsoft Teams Desktop App in Real-time with Application Network Scoring
Is the Microsoft Teams desktop app down? I am sure you think about this question when there is an issue or outage with Microsoft 365. And that question frightens you as you have a large distributed workforce to manage.
In our recent press release, Exoprise addresses the application network visibility gap with the latest digital experience monitoring solution, we address how IT can leverage our unique application network score to identify poor-performing Desktop apps like Teams.
Network admins and app owners can instantly gain end-to-end visibility into the response time and performance of Teams with Service Watch Desktop. The tool can pinpoint the root cause of slow network apps such as Wi-Fi strength, VPN connection, backend computing resources (memory, CPU, disk), etc.
Wrapping it up…
We can provide you with a free Digital Experience Monitoring tool for Microsoft Teams. Your team can easily deploy, try, and start collecting insights for your remote workforce today. Managing the Teams performance shouldn’t be difficult, so join us. We are here to assist you!
Weekly Office 365 Health Report
Subscribe to our weekly Cloud Health Report to see how Office 365 performed last week. Measured from 1000’s of locations throughout the world — its legit.
SUBSCRIBE
Download the Datasheet
Download the CloudReady Office 365 Datasheet for more information. Take it with you, share it, print it, frame it — you name it.
DOWNLOAD
youtube
#microsoft teams#digital experience monitoring#saas#microsoft 365#office 365#productivity#collaboration
0 notes
Text
Can Izotope Rx Be Installed On Multiple Computers
Oct 30, 2019 Re: Izotope RX pushing 'C' drive into red by miN2 » Wed Oct 23, 2019 5:53 pm I think saving in RX writes the.rxdoc completely before emptying its cache, so these 2 combined can get pretty large (single files on their own can get pretty large in RX if you've done a lot of work).
Using Waves Products on Multiple Computers. A single Waves product license can be used on just one system at a time, but can easily be moved back and forth between compatible systems as often as you like. Learn how to move your licenses.
Where are my iZotope applications stored on my Mac/PC? IZotope plug-ins are installed to the following locations on your machine: Mac.
Installation and Authorization Help Mac OS iLok Compatibility Chart; Documents folder issues with iZotope products; Welcome to iZotope Product Portal. How to use iZotope Products on Multiple Machines; iZotope Software Partner Bundles; Uninstalling iZotope Products; Install error: 'can't be opened because it is from an unidentified developer.
Feb 22, 2019 Their equipment has been rock-solid for me and for my installed clients. One of their greatest features is the ease of setup, including the flexibility of naming each unit. Most of the less-expensive Airplay endpoints I have seen or used are maddening to set up, or are frustratingly inflexible for renaming (and identifying) multiple endpoints.
Oct 18, 2013 RX 2 is ideal for any music, audio production or video post production challenge. It can read most standard audio files, but cannot directly work on an audio track embedded within a video file, like a QuickTime movie. IZotope RX 2 comes in a standard and advanced version.
Can Izotope Rx Be Installed On Multiple Computers 2
Can Izotope Rx Be Installed On Multiple Computers For Sale
Can Izotope Rx Be Installed On Multiple Computers 2017
Remote Utilities – Viewer 6.10.8.0 Crack With Registration Code Full Version Here (2019)!
IZotope products missing presets; RX Connect FAQ; Latency and Delay Compensation; iZotope Software Appears as Blank Window; Using iZotope plug-ins in Apple Logic Pro; See all 22 articles Purchase and Account Help. Loyalty Offers FAQ; Avid Loyalty RX redemption; How to Upgrade iZotope Software; How to Locate Your iZotope Serial Numbers.
Re: Team Viewer NOT Working on Mac Is there a box at the top right of the TeamViewer window for the partner ID? If you don't have the TeamViewer window open, right click the TeamViewer icon on your Doc and select TeamViewer. Feb 13, 2019 Having the same problem on my on my Mac even after following the directions for How to control a Mac running macOS 10.14 Mojave on both apple computers one running MAC OS 14 and one running MacOS 10.13. Team Viewer is the same Version on both computers. Also added Teamview to the Firewall Settings still no keyboard and mouse on remote computer. Teamviewer pc to mac not working windows 10.
Remote Utilities – Viewer 6.10.8.0 Crack Patch The Host module is installed on a remote PC and works for both unattended and attended access. You can access the program settings through the Windows Start menu or by right-clicking its icon in the system tray. The Host runs as a SYSTEM service so you can restart the remote PC and connect to the Windows welcome screen before any Windows user logs on. By default, the Host starts with Windows, but you can switch from auto to manual mode in the Host settings. Remote Utilities – Viewer 6.10.8.0 keygen All traffic that Remote Utilities send over the network is encrypted. The program uses TLS 1.2 for secure communication between Viewer and Host. Encryption is always on and cannot be disabled by the user. Transferred data is encrypted regardless of connection type and user license.
Remote UtilitiesRemote Utilities is a powerful yet extremely easy to use high-performance remote administration software for local or wide area networks. Pro kontrol trolling motor handles. It offers access and control for multiple computers from remote server, you can view client screens in real-time, access computers from anywhere using PC, Android or iOS devices, transfer files between clients and server or client with client, control the computer remotely, and do any other operation just as if you in front of the remote computers. Omnisphere 2 slow.
Remote Utilities – Viewer 6.10.8.0 Crack With Torrent Key!
Remote Utilities – Viewer 6.10.8.0 Crack resources communicate by developing a pair between a host and a customer PC. The host computer installs the scheduled program that is recorded is host the client connects the Viewer program. The “Host” here means the computer that really must be removed into certainly, while the “Viewer” is certainly one that’s doing the remoting in – the computer that ought to get a grip on the other one. Whenever the applying that is host launched, finished . that is initially told to do is set a password. It is an action that is necessarily protected your computer from unauthorized access. This password is going to be used by probably the audience system to achieve utilization of the host computer.

Remote Utilities – Viewer 6.10.8.0 Crack also supports file transfers, remote task manager, power control, terminal session, remote webcam, voice/video chat, and remote file executions. Other features include support for remote installations, firewall bypass mode, multi-monitor support, and much more.
Features Of Remote Utilities – Viewer:
Full Control and View Connect to a remote desktop from anywhere over a secure connection. View the remote screen, move the remote mouse pointer and send keystrokes.
Active Directory Support Easily integrate Remote Utilities into your Active Directory environment. Add new domain controllers, push-install the program across your AD network and connect in one click.
MSI Configuration Use the built-in MSI Configurator to create a custom Host installer for further deployment across your network.
Self-hosted Server Enhance Remote Utility capabilities with an on-premises server and build a 100% autonomous remote support solution to comply with strictest security requirements.
RDP Integration Prefer to use RDP? No problem. Use Remote Utilities to manage your saved RDP sessions and connect to a remote computer over the Internet using the RDP protocol.
Key Features:
But excessive humility and optimistic deal of time Reserved citizens.
Is a file from the passage of, the work of the Mass from afar, afar off, and were over a LAN.
Remote set up. Direct contact through the whole of that country is a place for all things behind, he let loose RUT equally applied to the PC.
Manufacturing so that if the current system topology, from the city of sophisticated options such as “Join all the way ‘and’ Callback Connection”.
Multilingual interface.
Health. All knowledge is encrypted with the assistance of the up-to-date science and applied for public key protocols (RS 2048, when the bit-bit session key and a public key copper and 256).
What’s New?
Remote Command Prompt
Can connect via desktop PC software or software that is iOS/Android
Wake-on-LAN (WOL) is supported
Unattended access
Operating procedures could be power down remotely with simplicity
System Requirements:
Can Izotope Rx Be Installed On Multiple Computers 2
Windows XP/ Vista/ 7/ 8/ 8.1/ 10 or Server 2003/ 2008/ 2012/ 2016 (32-bit or 64-bit – all editions)
Computer with reasonable speed
Internet Connection.
How to Install:
Can Izotope Rx Be Installed On Multiple Computers For Sale
1. First of all, disconnect from the internet. 2. Then, start the software installation. 3. Also, Use the given license key. 6. Finally, enjoy Remote Utilities Pro Crack with License Key Free Download.
Can Izotope Rx Be Installed On Multiple Computers 2017
You Can Also Free DownloadRemote Utilities – Viewer 6.10.8.0 Crack!
Aria math mp3 1 hour download. Hybrid SIEM solution combining real-time (event) log monitoring with comprehensive system health & network monitoring provides users with a complete picture of their servers and endpoints.The included security event log normalization & correlation engine with descriptive email alerts provides additional context and presents cryptic Windows security events in easy to understand reports that offer insight beyond what is available from raw events.EventSentry's NetFlow component visualizes network traffic, can detect malicious activity and offers insight into bandwith usage. Keeping track of Active Directory changes is easy with EventSentry's ADMonitor component that records all changes to AD & Group Policy objects and provides a complete user inventory to help identify obsolete accounts.Various integrations & multi-tenancy available.
0 notes
Text
Whats Make You Beautiful Download

Install GameGain and play the latest PC games with the highest settings possible. With GameGain you can instantly increase the performance of your computer to make games run faster and play smoother.
What's Make You Beautiful Download Video
What Makes You Beautiful Lyrics Download
Compatible: Windows 10, 8, 7, Vista, XP & Windows Server 2012, 2008, 2003. 32-BIT/64-BIT ready.
What Makes You Beautiful is an English language song and is sung by One Direction. What Makes You Beautiful, from the album What Makes You Beautiful, was released in the year 2011.
Stream What Makes You Beautiful by One Direction from desktop or your mobile device.
What Makes You Beautiful Lyrics: You're insecure, don't know what for / You're turning heads when you walk through the door / Don't need makeup to cover up / Being the way that you are is enough.
One of the first and most comprehensive products, GameGain sets the standard for PC gaming optimization software. GameGain instantly increases the performance of your computer and squeezes out every last bit of performance your computer gaming hardware is capable of. With many of the latest PC games requiring high hardware requirements to have a suitable gaming experience, it is important to optimize your computer's performance. Windows is a general operating system which is used for many everyday tasks; it is not optimized for gaming performance. With GameGain and a few clicks of your mouse, you will notice an increase in frames per second, smooth game play and less lag during gaming. GameGain makes several Windows registry and system changes to increase the performance of your current gaming hardware; this allows you to play the most recent games without having to spend hundreds of dollars to upgrade your computer hardware. These changes made to your computer improve memory usage, how foreground applications are prioritized with the CPU, hard drive access read and write speeds and how fast graphics can display on your screen. GameGain does not make changes, no patches and no modifications to games themselves, thus no anti-cheat detection software considers our software cheating software and you will not be banned from those gaming networks.

Network Bandwidth Analyzer pack gives you the power of SolarWinds Network Performance Monitor and NetFlow Traffic Analyzer so you can detect, diagnose, and resolve network performance issues, track response time, availability, and uptime of routers, switches, and other SNMP-enabled devices, monitor and analyze network bandwidth performance and traffic patterns, and find bandwidth hogs on a.
Constant Updates We constantly update GameGain with new system performance tweaks; this allows your gaming computer to keep up with the latest games that demand fast hardware.
Faster Gaming Graphics Increase the frames per second you are getting when playing the most current and exciting games without having to purchase a new graphics card, memory, or CPU.
CPU Prioritization GameGain instructs the CPU to prioritize full screen applications so they are given the most power and access to more CPU cores; this allows games to work faster.

No Patches to Games Games run faster and are not directly patched or modified, thus you are not banned from networks that have cheat detection software that detect modifications to games.

Sometimes even the most powerful computer gaming hardware can be slowed down by the latest games. Many of the newer games require faster graphics cards, more memory and faster processors to have a playable game experience. Also due to the popularity of home game consoles many of these games are ported to the PC poorly, impacting performance on the fastest of machines. With GameGain your computer hardware is optimized to the extreme, allowing you to get the best performance possible for these games without sacrificing graphics fidelity. Optimizing your Windows desktop environment to work faster with games is a no brainer if you are a hardcore PC video game enthusiast. Just like tuning a sports car to get higher performance, GameGain tunes your PC's hardware to work faster which improves gaming performance. Get every last bit of horsepower out of your computer to play your games smoother and faster with a few clicks of the mouse. Download a trial version of GameGain today and unleash the full power of your computer hardware for faster gaming.
GameGain 4 Screenshots & Features
Compatible with Microsoft Windows 10, 8, 7, Vista, XP & Windows Server 2012, 2008, 2003. 32-BIT/64-BIT ready.
Optimizes your computer hardware to allow the latest games to run faster with the highest graphic settings possible.
Decreases the amount of lag and screen pop-in you get playing games that require large map files to load during game play.
Increase the frames per second that is displayed allowing games to play much smoother and increase your enjoyment of these games.
Advanced software based over-clocking feature which enhances memory speed, CPU prioritization of full screen applications, making games run faster.
Changes are made to the Windows system directly not patches to game files; this prevents anti-cheat systems from accusing you of game modification.
New and improved modern user interface, easy and intuitive to use and compliant with Windows user interface guidelines.
Software updates can be downloaded and installed directly from inside the application without having to visit our web site.

What's Make You Beautiful Download Video

Latest Update: 4.11.23.2020 - Added fix for application start up as admin mode in Windows 10.
What Makes You Beautiful—a new song from the young British-Irish boy band One Direction, from their debut studio album, Up All Night. The music video for “What Makes You Beautiful” was directed by John Urbano and premiered on 19 August 2011, and shows One Direction spending time on Malibu, California beach. Since it was released, it has got warm response and great result. Now let’ enjoy What Makes You Beautiful. Would you like to download it from YouTube? If you like this video, just download it with free YouTube downloader.
Download and install YouTube downloader. Supermarket mania journey cheats.
Alton Generator Manual Alton 500 Watts Potable Venerator from Sears.com Looks like you searched for term 'alton 3500 watt portable generator.' Manual, size Alton 3500 watt generator from sears.com Hyundai Power Equipment Energizer 3500 Watt Portable Generator with Manual. Alton generator manual. We make generators for BSA, Triumph, Matchless, Vincent, Velocette, AJS and others that neatly replace the existing 3” dynamo making that flat battery feeling a thing of the past. With an Alton generator you can be sure of good quality lighting plus a well-charged battery. Finished the days when you had to garage your bike from October to March. Shop now for Alton AT04105D AT041050 Parts. Our Engineers are always happy to help. From the leader in Portable Generator Parts. USA Canada UK EU. Alton Generator Owners Manual If you are looking for the ebook Alton generator owners manual in pdf form, then you have come on to correct website. We furnish utter release of this ebook in DjVu, ePub, PDF, doc, txt forms. You may reading online Alton generator owners manual either load.
1- Download Free YouTube Downloader. Install and run it. 2- Searching the video on YouTube.com with the built-in web browser of the free downloader. Play the video. 3-While it is playing; a reminder will pop out to remind you download the song. Ncaa football 13 ps3 iso ppsspp. Click “Save as” original video format to start downloading. 4- Check the downloading process in “Convert” tab.
What Makes You Beautiful Lyrics Download
Download and install YouTube downloader for Mac 1- Install and run YouTube downloader for Mac freely. 2-copy and paste the URL of “What Makes You Beautiful’” in “Add” zone of the free YouTube downloader for Mac. Or click on the “Download” button appeared on the bottom of the video; or directly drag and drop the URL to the downloader on deck. The download task will be on queue. When the process finished, go to “Library” to check downloaded YouTube files.
Installation is quick and effortless. Mxl usb mic mate dynamic xlr to usb microphone adapter for mac. This incredibly versatile and compact universal interface facilitates the connection of dynamic microphones directly to a computer via USB, effectively converting any dynamic microphone into a USB microphone. Product Information.
0 notes
Text
Enterprise Routers Market Sector Analysis Report, Regional Outlook & Competitive Share & Forecast, – 2025
The enterprise routers market is poised to grow at a CAGR of 6.2% during the forecast period from 2020 to 2025. Enterprise routers are vital products that any business or enterprise uses regularly. They play an essential role in enterprises in connecting computer networks and the internet. Routers perform many functionalities, such as enterprise routing, which gives businesses a higher CPU capacity to control place tasks. Furthermore, it provides companies the ability to enhance their interface for both Ethernet and WAN circuits, run NetFlow/sFlow, MPLS, QoS, and other security features. It has functions to integrate deep packet inspection and WAN acceleration. Enterprise routers assist in maximizing productivity in the office, and the installation of an enterprise router requires the skills and expertise of an engineer. - In the first quarter of 2019, the enterprise and service provider router market grew 8.2%. The service provider segment accounts for 75.3% of router market revenues. The service provider router market rose 7.1%, and the enterprise router market grew 11.9%. The top seven enterprise routers which had high market share till June 2019 were Cisco (55.7%), Huawei (9.3%), HPE (5.3%), Nokia (3.7%), Juniper (3.6%), Netgear (2%), Dell EMC (1.7%). Cisco Systems is one of the top networking companies in the world with the highest market share providing a wide variety of enterprise routers. Cisco's enterprise router revenue rose 16.1%, and Cisco's SP and enterprise router market share increased to 42.4% from 37.4% in the first quarter, according to telecom lead.
Click Here to Download Sample Report >> https://www.sdki.jp/sample-request-90107 - Huawei's Global Industry Vision (GIV) predicts that by 2025, 85% of enterprise applications will be moved to the cloud, resulting in significant traffic growth at the egress of enterprise WANs. Traditional private lines offer several Mbit/s bandwidth and are prone to network congestion, and so service experience cannot be guaranteed. Leveraging flexible and efficient application-based traffic steering, Software-Defined WAN (SD-WAN) is the best choice for enterprise WAN interconnection in the cloud era, as it can effectively ensure customer service experience. However, when traditional enterprise routers intersect with SD-WAN, their forwarding performance decreases by about 80% on average. In response, Huawei launched next-generation NetEngine AR enterprise routers that provides higher forwarding performance at the egress of enterprise WANs. - Furthermore, service providers are rapidly modernizing their networks to satiate enterprises' growing appetites for higher performance and superior user experiences. However, as service providers adopt virtualization and SDN capabilities, they are being held back by monitoring techniques that cannot keep up. The enterprise cloud migrations and increasing reliance on software-as-a-service applications- introduced new challenges. This has driven service providers to adopt NFV, SDN, and cloud-native computing technologies. In May 2020, 128 Technology, the leader in Session Smart Routing, announced that Momentum Telecom selected 128 Technology's Session Smart Router to enable a new era of software-defined network services for its thousands of enterprise customers and partners. Key Market Trends Wireless Connectivity is Expected to Hold Major Share - An ordinary wireless router can only support approximately 10-20 users’ access. In contrast, the wireless access router point allows over 50 or even hundreds of users’ access, with the potential ability to send and receive signals. According to Cisco, the expected penetration of enterprise internet traffic via wireless fixed-line connection in 2021 shall be 125988 petabytes per month. With the rise in high internet traffic and devices, average fixed broadband speed, along with average internet users, will grow exponentially in the forecast period. Average fixed broadband speed is likely to increase from 5.1 Mbps in 2015 to 12.9 Mbps in 2020. - For instance, the industry’s first 5G optimized wireless WAN edge router for enterprise branch deployments has been released by Cradlepoint in May 2020. The Cradlepoint E3000 Series, according to the company, optimizes performance and investment protection and enables customers to deploy a wireless wide-area network (Wireless WAN) using the latest LTE and Wi-Fi technology and seamlessly upgrade to 5G in the future. The COVID-19 pandemic has fueled an already growing demand for agile and rapidly deployable wireless WANs based on LTE for primary connectivity. Cradlepoint said in the release that the E3000 Series is intended to target this market directly. - Furthermore, M2M Connectivity supplies a broad range of wireless routers for 4G/3G as well as models for satellite and short-range RF (WLAN, Bluetooth). These ethernet routers enable remote access and communication with equipment and assets such as remote PLCs, data loggers, and microcontrollers. With the increasing usage of such solutions in various end-users, the market tends to grow in this sector. In April 2020, Digi International announced the launch of several new cellular routers and extenders, each designed to meet the present and future connectivity needs of organizations for M2M applications in the transportation and enterprise marketplaces. North America is Expected to Hold Major Share - North America is expected to hold a prominent share in the enterprise routers market. Moreover, the region has a strong foothold of network routers vendors. Some of them include Cisco Systems, Inc., Dell EMC, Juniper Networks, Inc., among others, which contribute to the growth of the market. It is estimated that till 2022, in the United States the market for network router will grow to USD 11,950 million which includes the market for ethernet service edge router, multiservice edge router, service provider core router, and internet exchange router (source Cisco), where the expectation of high market growth potentially move towards internet exchange router in 2022. - Moreover, according to Cisco, 46% of network devices will be machine -to -machine or IoT by 2020, which are vulnerable to attacks. To fully realize the potential of these connected devices, the industries need to be equipped with WANs that are flexible to meet the network demands anticipated over the future. Furthermore, the emergence of trending technologies, such as cloud networking, SaaS-based application, network analytics, DevOps, and virtualization, has encouraged the users and businesses in North America to undertake enterprise routers products. - However, security and privacy concerns are restraining the market. According to the study, five out of every six routers in the United States are running out-of-date firmware with exploitable security vulnerabilities, which hinders market growth globally. In a situation where many employees are currently working from home due to a COVID-19 pandemic or access wi-fi networks that operate at enterprise-level security, devices such as routers can be hacked to plant a range of malware into handheld devices used by employees. Subex, through its honeypot network (a decoy computer system for trapping hackers), spread across 62 cities, has been tracking cyberattack trends and malware activity that can be correlated with the outbreak. Competitive Landscape The enterprise routers market is fragmented as the global players invest in R&D for the latest innovations in the product for several small to medium-sized companies. Key players are Cisco Systems, Inc., Juniper Networks, Inc., Hewlett Packard Enterprise, etc. The companies operating in the market continuously strive to launch new solutions to help service providers achieve a holistic approach to infrastructure transformation and gain new orders in that course for strategic aim. - March 2020 - Huawei confirmed that its next-generation NetEngine AR600 and AR6000 series enterprise routers have passed the verification test by The Tolly Group which is an authoritative international provider of testing and validation. The results showed that Huawei's NetEngine AR routers are equipped to handle the growth in traffic from digital transformation in the next three to five years, leading the way to a new era of ultra-fast interconnection for enterprise WANs. - December 2019 - Cisco Silicon One based Q100 processor and 8000 Series routers. Cisco will uniquely allow ecosystem players to separately buy processors, the XR7 router software, 8000 series routers without software, optical modules (QSFP-DD and QSFP28), or a fully integrated 8000 Series solution. The 8000 Series router and the Q100 processor is targeted at service providers and data center operators ranging from large aggregation to core applications. Reasons to Purchase this report: - The market estimate (ME) sheet in Excel format - 3 months of analyst support
The dynamic nature of business environment in the current global economy is raising the need amongst business professionals to update themselves with current situations in the market. To cater such needs, Shibuya Data Count provides market research reports to various business professionals across different industry verticals, such as healthcare & pharmaceutical, IT & telecom, chemicals and advanced materials, consumer goods & food, energy & power, manufacturing & construction, industrial automation & equipment and agriculture & allied activities amongst others.
For more information, please contact:
Hina Miyazu
Shibuya Data Count Email: [email protected] Tel: + 81 3 45720790
Related Links https://www.sdki.jp/
1 note
·
View note
Text
Cisco Certified CyberOps Professional 300-215 CBRFIR Exam Questions
Conducting Forensic Analysis and Incident Response Using Cisco Technologies for CyberOps v1.0 (CBRFIR 300-215) exam is the concentration exam to achieve Cisco Certified CyberOps Professional Certification, you also need to pass the core exam 350-201 exam to get certified. PassQuestion new released Cisco Certified CyberOps Professional 300-215 CBRFIR Exam Questions which cover the real 300-215 exam topics to ensure you pass Cisco 300-215 exam successfully. It is wise to choose our PassQuestion Cisco Certified CyberOps Professional 300-215 CBRFIR Exam Questions and you will get the most satisfied product you want.
Cisco Certified CyberOps Professional Certification
Achieving the Cisco Certified CyberOps Professional certification elevates your skills and confirms your abilities as an Information Security analyst in incident response roles, cloud security, and other active defense security roles. To earn a Cisco Certified CyberOps Professional certification, you pass two exams: one that covers core technologies (350-201) and one concentration exam (300-215).
300-215 CBRFIR Exam Description - Conducting Forensic Analysis and Incident Response Using Cisco Technologies for CyberOps
Conducting Forensic Analysis and Incident Response Using Cisco Technologies for CyberOps v1.0 (CBRFIR 300-215) is a 60-minute exam that is associated with the Cisco CyberOps Professional Certification. This exam tests a candidate's knowledge of forensic analysis and incident response fundamentals, techniques, and processes.
Exam Topics
1.0 Fundamentals
1.1 Analyze the components needed for a root cause analysis report
1.2 Describe the process of performing forensics analysis of infrastructure network devices
1.3 Describe antiforensic tactics, techniques, and procedures
1.4 Recognize encoding and obfuscation techniques (such as, base 64 and hex encoding)
1.5 Describe the use and characteristics of YARA rules (basics) for malware identification, classification, and documentation
1.6 Describe the role of:
1.6.a hex editors (HxD, Hiew, and Hexfiend) in DFIR investigations
1.6.b disassemblers and debuggers (such as, Ghidra, Radare, and Evans Debugger) to perform basic malware analysis
1.6.c deobfuscation tools (such as, XORBruteForces, xortool, and unpacker)
1.7 Describe the issues related to gathering evidence from virtualized environments (major cloud vendors)
2.0 Forensics Techniques
2.1 Recognize the methods identified in the MITRE attack framework to perform fileless malware analysis
2.2 Determine the files needed and their location on the host
2.3 Evaluate output(s) to identify IOC on a host
2.3.a process analysis 2.3.b log analysis
2.4 Determine the type of code based on a provided snippet
2.5 Construct Python, PowerShell, and Bash scripts to parse and search logs or multiple data sources (such as, Cisco Umbrella, Sourcefire IPS, AMP for Endpoints, AMP for Network, and PX Grid)
2.6 Recognize purpose, use, and functionality of libraries and tools (such as, Volatility, Systernals, SIFT tools, and TCPdump)
3.0 Incident Response Techniques
3.1 Interpret alert logs (such as, IDS/IPS and syslogs)
3.2 Determine data to correlate based on incident type (host-based and network-based activities)
3.3 Determine attack vectors or attack surface and recommend mitigation in a given scenario
3.4 Recommend actions based on post-incident analysis
3.5 Recommend mitigation techniques for evaluated alerts from firewalls, intrusion prevention systems (IPS), data analysis tools (such as, Cisco Umbrella Investigate, Cisco Stealthwatch, and Cisco SecureX), and other systems to responds to cyber incidents
3.6 Recommend a response to 0 day exploitations (vulnerability management)
3.7 Recommend a response based on intelligence artifacts
3.8 Recommend the Cisco security solution for detection and prevention, given a scenario
3.9 Interpret threat intelligence data to determine IOC and IOA (internal and external sources)
3.10 Evaluate artifacts from threat intelligence to determine the threat actor profile
3.11 Describe capabilities of Cisco security solutions related to threat intelligence (such as, Cisco Umbrella, Sourcefire IPS, AMP for Endpoints, and AMP for Network)
4.0 Forensics Processes
4.1 Describe antiforensic techniques (such as, debugging, Geo location, and obfuscation)
4.2 Analyze logs from modern web applications and servers (Apache and NGINX)
4.3 Analyze network traffic associated with malicious activities using network monitoring tools (such as, NetFlow and display filtering in Wireshark)
4.4 Recommend next step(s) in the process of evaluating files based on distinguished characteristics of files in a given scenario
4.5 Interpret binaries using objdump and other CLI tools (such as, Linux, Python, and Bash)
5.0 Incident Response Processes
5.1 Describe the goals of incident response
5.2 Evaluate elements required in an incident response playbook
5.3 Evaluate the relevant components from the ThreatGrid report
5.4 Recommend next step(s) in the process of evaluating files from endpoints and performing ad-hoc scans in a given scenario
5.5 Analyze threat intelligence provided in different formats (such as, STIX and TAXII)
1 note
·
View note
Text
Sell Cisco Switches-A Guide To Best Cisco Switches

When you are searching for ideal Cisco Switch, it is better to first understand their basics and fundamental operations in networks. Switches allow efficient communication between various network devices. So, how can you choose the best suited Cisco switch from the broadest range of models? Here's your guide to the leading-edge switching solutions for Branch offices & Campuses.sell cisco switches
Functionalities of these Cisco switches are intelligently designed to handle all types of corporate data centers, virtual environments, network cores and work-groups. They deliver the cost efficiency, scalability and high-performance services for fast growing networks.
Ideal Solution for Campus
Campuses mostly feature a complex network of WANs and LANs. In addition to this, there might be virtualized systems designed for inter & intra data centers. So they must have the ability to address the growing workload at all sites.
For such demanding environments, Cisco has engineered a high-class Nexus 7000 Series featuring 10, 40 & 100 GE scalability for campus core deployments. This solid platform of modular switching solution is well suited for unified fabric networks.
IT admins will enjoy industry-leading resilient features and greater productivity in aggregation and data center core. Moreover, the innovative NX-OS operating system facilitates users to design robust, flexile fabrics for campus networks.
Improved Scalability
10, 40 & 100 GB
Slot chassis (9, 10, 18) can be up-graded seamlessly to 96/32 40/100GE, or the GE ports (768 10, 768 1)
Ultra-high switching capacity reaching 17 Tbps
Each Nexus 7000 chassis has the remarkable capability of handling 1536 Gigabit Ethernet servers
Inclusion of Nexus 2000 helps to further improve the performance to 32 fabric extenders
Ideal Solution for Branch Office
Branch office networks require consolidation of appliances with flexibility of segmentation, address space separation, file sharing and isolation of path.
For these demanding challenges, the Cisco Catalyst 6500 switches provide a solid platform and allow end-to-end network virtualization. They are equipped with:
IP/MPLS functionalities
Virtual Switching technologies (capacity up to 4 terabit)
100 Gigabit Ethernet. Each slot can reliably handle 160 gigabits
EVN (Easy Virtual Network). It allows users to design separate logical networks
Integrated services modules, which play key role in improving wireless control, network management & security
Enhance the Security Level

State-of-the-art features of EAC (endpoint admission control) and Security Group Access Control ensures unprecedented reliability for all network devices. Cisco 6500 Catalyst Switches support VSS (Virtual Switching System) thus elevating the capacity of your system to 4Tbps. Without VSS, it can scale the per slot capacity to 80Gbps. Supervisor Engine 2T works seamlessly with IPv6 and IPv4. The performance extends to 390 mpps and 720 mpps respectively.
Key Benefits:
Trouble-free deployment of new service modules. Control multiple component versions through a single modular. Efficient monitoring of entire switches attached to your network. Mini Port Analyzer, ERSPAN (Encapsulated Remote SPAN), Convenience of console logging, Onboard packet capturing, Netflow Export, CMP (Connectivity Management Processor).
0 notes
Text
In addition to these advanced features, the Cisco Catalyst 4500E Supervisor8L
The APIC-EM path tracking app also allows for flow-based detail rendering and troubleshooting by tracing paths between two servers. It provides additional insight into the nature of each jump, including information like whether the path segment is Layer 2 or Layer 3 and what protocols are running on it.
In addition to these advanced features, the Cisco Catalyst 4500E Supervisor8L-E also supports all of the other security, high availability, and IT simplification features of the Catalyst 4500E. With Stateful Switchover (SSO) and In Service Software Upgrade (ISSU), customers can receive supervisor redundancy on framework C4507R + E. Supervisor8L-E also supports Virtual Switching Systems (VSS) for redundancy. two-frame and inter-framed rooms in integrated deployments. It also supports Network capabilities as a Sensor and Network as an Implementer with Cisco TrustSec, Flexible Netflow, Wireshark encryption, and embedded MACSec.
https://banthietbiroutercisco.blogspot.com/2020/08/cach-xac-inh-lai-quyen-truy-cap-theo-mo.html
0 notes
Quote
Network management encompasses a range of tasks and processes. Explore 10 crucial tasks and accompanying best practices to ensure a resilient and functional network. As the network goes, so goes the entire infrastructure. Network mismanagement can severely affect all servers, applications and services on which a business relies. That's why it's so important that every network operations management task be taken seriously and held to the highest standards. In this article, we look at 10 critically important network management tasks and provide tips on how network teams can properly handle them using best practice processes and tools. 1. Network configuration When networks are properly architected, configuration templates -- sometimes referred to as boilerplates -- are built and updated as needed. The purpose of these templates is twofold. First, they help administrators more quickly configure new devices for deployment. The second benefit is templates help ensure configurations are uniform from one device to the other. Modern methods for managing network configurations include network automation platforms, as well as software-defined networking technologies that centralize all network configurations within the control plane. 2. Network monitoring and alerting An important network management task is to closely watch the operational health of an enterprise network to ensure uptime and optimal performance. The use of protocols and health monitoring services, such as Simple Network Management Protocol, syslog, NetFlow and deep packet inspection, can help monitor and automatically trigger alerts when issues arise. 3. Troubleshooting and root cause analysis An important network management task is to closely watch the operational health of an enterprise network to ensure uptime and optimal performance. When a network failure or performance problem arises, the network admin is responsible for identifying and remediating the problem as quickly as possible. As part of this process, admins should perform a thorough root cause analysis to pinpoint the true cause of the failure and document what was done to eliminate the threat -- or, at least, reduce the event's effect on the organization. Modern tools, such as AIOps platforms, use machine learning to help automate troubleshooting and root cause analysis processes. 4. Change control management When admins need to make network changes to a production network, they must closely control the entire process from start to finish. This includes dictating who can make the changes, what time frame the changes should occur, how the changes should be announced and a peer review of the proposed changes. While network-centric change control management tools are available, most enterprise IT shops opt for a centralized change control platform that all teams can use. These tools are typically part of -- or directly integrated with -- the IT department's service ticketing platform. 5. Firmware bug and vulnerability patching While network device firmware isn't patched nearly as often as server OSes and applications, it happens far more frequently today compared to a few years ago. The reason for frequent patching is due to the sheer number of operation bugs and, more importantly, security vulnerabilities. Admins should put processes in place that enable them to review firmware update notes to verify whether a known bug or vulnerability can significantly affect the business. Based on this research, they should handle firmware patching like any other network change that goes through a thorough change control processes. 6. Configuration backup and secure storage Many legacy network devices still use command-line interfaces for configuration and management purposes. In the event of a catastrophic hardware failure, it's critical to have a text copy of these configurations that can be pasted into spare or replacement equipment. Policies for storing these valuable configurations should include processes for file encryption and limited access to the backup file repository. In modern, cloud-managed network architectures, it's often the service provider's responsibility to maintain and protect configuration backups. However, some cloud network service providers permit customers to copy and store their configurations wherever they choose. In these cases, it's important that enterprises store backups outside the provider's cloud in the event of a major service provider outage. 7. Policy and compliance validation Admins must regularly review all network policies to ensure the network is not only optimized from a performance standpoint, but also from a security, compliance and regulation perspective. Depending on the type of business an organization operates, teams must enforce and regularly review Sarbanes-Oxley Act, Payment Card Industry and HIPAA compliance standards. Network automation tools that also include automated security and compliance verifications can help speed the validation process. 8. Network diagrams As networks grow in complexity, it's more important than ever to maintain detailed and accurate physical and logical network diagrams. While seasoned network engineers may prefer drawing and updating their own manually created diagrams using tools like Microsoft Visio, many have concluded that their networks are too complex -- and change too frequently -- to keep up. Thus, tools that automatically scan and map the network topology are becoming a popular alternative. While these automated diagrams may not be as visually appealing or include all necessary information, admins can at least be assured they are up to date. 9. Network resiliency Mission-critical networks are designed and built with high availability in mind. This includes factors like physical cabling redundancy, dynamic routing protocols and spare equipment maintenance in the event of a production hardware failure. Network resilience tasks also include steps to regularly test and evaluate network resiliency response times in the event of a failure. Another crucial part of verifying network resiliency is to ensure that production hardware and software are properly licensed and are under appropriate levels of support contracts. This includes understanding hardware replacement times, vendor support hours and methods, and detailed steps required to resolve common problems from start to finish. 10. Short- and long-term roadmapping Lastly, network admins should have processes in place to create short- and long-term network architecture roadmaps. These exercises help to understand where the network is today, what it's capable of in the near term and what the catalyst will be that dictates major upgrades in the future. This network management task requires that administrators read up on, study and receive demonstrations on new and emerging network technologies. Doing so helps admins plan next steps and avoid architecting the network into a corner
http://damianfallon.blogspot.com/2020/04/overview-of-network-management-tasks.html
0 notes
Text
Original Post from Talos Security Author:
By Luke DuCharme and Paul Lee.
What Happened?
Cisco Incident Response (CSIRS) recently responded to an incident involving the Watchbog cryptomining botnet. The attackers were able to exploit CVE-2018-1000861 to gain a foothold and install the Watchbog malware on the affected systems.
This Linux-based malware relied heavily on Pastebin for command and control (C2) and operated openly. CSIRS gained an accurate understanding of the attacker’s intentions and abilities on a customer’s network by analyzing the various Pastebins. As the investigation progressed, CSIRS identified and de-obfuscated multiple pastes using artifacts left on compromised hosts.
There were some attempts at obfuscation, such as base64 encoding URLs and Pastebins, but the attack was still relatively simple to uncover – this attacker did not practice particularly strong operational security.
The attackers behind Watchbog claimed to be providing a service by identifying security vulnerabilities and aiding the organization by exploiting said weaknesses before any “real” hackers could do so. During the investigation, Cisco IR found signs of hosts becoming a part of a separate botnet around the time of the Watchbog activity. This raises serious doubts about the “positive” intentions of this adversary. Below is a message left on a compromised system by the adversary:
What does Watchbog do?
The Watchbog botnet mines Monero cryptocurrency for its owners. While researching our variant we came across a post by Alibaba Cloud Security that provides some insights into Watchbog. This post coincided with our findings as we found an installation script that performs the following activities.
First the installation script checks for running processes matching other cryptocurrency miners. If the system was previously configured to mine cryptocurrency, the installation script would terminate their execution using the kill command:
The script then uses the touch command to determine its capability to write to various directories on the filesystem.
It also checks the architecture of the system to determine if it is executing on a 32-bit or 64-bit operating system and then makes three attempts to download and install a ‘kerberods‘ dropper using wget or curl.
Depending on permissions, the kerberods dropper is saved to one of the following directories:
The current working directory
/usr/bin
/usr/libexec
/usr/local/bin
/tmp
/usr/sbin
The script also retrieves the contents of a Pastebin URL containing a Monero wallet ID and mining information. CSIRS verified this as the same wallet ID as the one used by the attacker referenced in the Alibaba cloud post referenced earlier.
Though the Pastebin URL in the previous screenshot is no longer accessible, the next step in the infection process is to download the cryptocurrency miner. We identified a script that ‘kerberods’ likely runs to reach out to GitHub to install the XMR-Stak Monero miner.
The main part of the script checks to see if a process called ‘watchbog’ is running.
If the ‘watchbog’ process is not detected, the ‘testa’ or ‘download’ functions are called to install the version of the miner that’s compatible with the host operating system and architecture and execute it to begin the mining process.
‘Testa’ function
As previously mentioned, the ‘testa’ function may be called to facilitate the infection process. Below is the code associated with this function. This code is responsible for writing the various configuration data used by the mining software. The function declares three variables and assigns base64 encoded data to each of them.
The base64 encoded data is then decoded and written to various files.
The base64 encoded values correspond to the following:
St_64: This variable contains the URL of the Github repository that hosts the XMR-Stak mining client.
hXXps://github[.]com/fireice-uk/xmr-stak/releases/download/2.10.3/xmr-stak-linux-2.10.3-cpu.tar.xz
con_url: This variable contains the Pastebin URL that is used to host the configuration file for the mining client.
hXXps://pastebin[.]com/raw/YJH8sWr
Cpu_url: This variable contains an additional Pastebin URL. During our investigation the Pastebin URL was no longer accessible, but likely contains an additional configuration file to be used by the mining client.
hXXps://pastebin[.]com/raw/irzk5mSh
poo_url:This variable contains an additional Pastebin URL. During our investigation the Pastebin URL was no longer accessible, but likely contains an additional configuration file to be used by the mining client.
hXXps://pastebin[.]com/raw/aJkbTx6Y
The script then starts the Watchbog process and deletes the text file after downloading the encoded Pastebins as a text file and giving it execution permissions. The following screenshot shows the configuration file that is referenced by the con_url variable in the ‘testa’ function.
‘download’ function
The following code is associated with the ‘download’ function referenced by the installation script previously described. Similar to what was described in the ‘testa’ function, it contains three declared variables with base64 encoded assignments.
These base64 encoded strings correspond to the following:
mi_64: This variable contains the Github URL that hosts the XMrig monero mining client.
hXXps://github[.]com/xmrig/xmrig/releases/download/v2.14.1/xmrig-2.14.1-xenial-x64.tar.gz
mi_32: This variable contains a Pixeldrain URL. During our investigation the URL was no longer accessible.
hXXps://pixeldrain[.]com/api/file/ZuVWceWG
der_ke: This variable contains a Pastebin URL. The URL was used to host a file containing the attacker(s) Monero Wallet ID for the miner to use. This Wallet ID is used to facilitate payment to the attacker. All Monero successfully mined by clients under the attacker’s control will transfer the Monero to the Wallet ID specified in this file. The same wallet is included in the Alibaba Cloud post mentioned earlier.
hXXps://pastebin[.]com/raw/hURdMBLd
The download function then writes the contents retrieved from the specified URLs to various file locations. It then determines the architecture of the system and installs the appropriate mining client and executes it to initiate the mining process.
The following screenshot contains the contents of the Monero wallet configuration associated with the der_ke variable in the ‘download’ function described earlier. It specifies the configuration parameters that will be used by the mining client, including the Wallet ID, mining pool URL, and other parameters that can be used to control CPU usage, logging, etc.
Lateral movement via SSH
CSIRS identified that the adversary was using SSH to spread laterally. Although local logs were unavailable, we were able to use network logs to gain an understanding of how the malware was spreading. As we viewed the logs, it was easy to determine Watchbog’s lateral movement mechanism because they were generating a large amount of SSH traffic. This could have been easily detected using internal traffic flow monitoring, such as with StealthWatch Cloud or other netflow-monitoring capability.
The following Bash script was used to facilitate the lateral movement process. It retrieves the contents of the known_hosts file on the infected system and then attempts to SSH into those systems. It also checks for the existence of SSH keys and leverages them to authenticate to the systems in the known_hosts file. If successful, it will retrieve the contents of the Pastebin URL previously described and initiate the infection process.
Lateral movement via Jenkins and Redis servers
In addition to leveraging SSH for lateral movement, the Watchbog adversary also attempted to leverage a Python script that scans for open Jenkins and Redis ports on the host’s subnet. If the script finds any vulnerable servers, it attempts to use the curl or wget commands to retrieve a payload from Pastebin and execute it on the target.
Based on the following string on line 71, the script targets CVE-2018-1000861, a vulnerability in the Staple web framework for versions up to Jenkins 2.138.1 or 2.145 which handles HTTP requests. It can provide attackers with RCE through particularly crafted URLs. A post by Orange Tsai shows how to exploit this vulnerability by using cross reference objects to bypass ACL policy.
Though the pastes accessed in the script were no longer available, we believe the payload was the installation script for the XMR-Stak miner previously described. The following Python script is also downloaded and executed from the XMR-Stak miner script described above in a function called ‘party.’
As can be seen above, the payload variable contains a base64 encoded blob which is then decoded and written to the /tmp directory and executes it. This base64 encoded blob contains a Pastebin URL (hXXps://pastebin[.]com/raw/DzgYb9mu) which was used to host the following Python script. The Python script is used to facilitate the exploitation of the aforementioned vulnerability and initiate the infection process. The following screenshots are associated with this Python script.
Persistence
Watchbog’s main persistence mechanism appears to have been using cron jobs. Below is the ‘system’ function from the ‘kerberods’ installation script which ensures the dropper will call out to Pastebins every hour for new information. The below screenshot shows the way that Watchbog configures the cron jobs responsible for achieving persistence on infected systems.
In a post by Renato Marinho from Morphus Labs, he mentions a very interesting way ‘kerberods’ achieves persistence as well. If it has root privileges, it will download and load a library into the operating system which hooks parts of Glibc to modify Glibc’s behavior. The post also specifies that the hooks allow the miner to run as anyone (including root) and also obfuscates the network connection to the mining pool as well as the Redis/Jenkins server scans.
Covering their tracks
Evidence deletion has been identified in previous Watchbog variants. The Watchbog variant in our incident continued this trend. Evidence deletion was performed in a clear manner with files and logs being deleted or overwritten. The evidence deletion was typically added to the end of a handful of the Pastebin scripts, with the Xmr-stak download and the SSH Lateral Movement scripts being prime examples. The loss of those key pieces of evidence made analysis difficult, but not impossible. We were able to rely upon our clients centralized logging to fill in those holes, and the hosts themselves still had evidence. The most obvious being the malware variants themselves.
Conclusion
Unpatched web applications vulnerable to known CVEs are a major target for attackers. Adversaries can leverage the vulnerability to gain a foothold into the web server and network environment in which the web server is deployed. Once that foothold has been established, the attacker can then connect to their C2, achieve persistent long-term access to the environment and spread laterally — which is exactly what happened in this case. The best way to prevent such activity would be to ensure that all enterprise web applications are up to date. Patching can cause some operational gaps and delays, so it’s also important to have a maintenance window and a test environment to ensure that the new patches do not cause any issues. Identifying cryptomining activity can be done effectively by following security fundamentals. Establish a baseline for internal network traffic and if any significant deviations occur, identify and investigate them. Even if there is an existing theory for the activity. In this case, Watchbog generated a noticeable spike in the organization’s SSH traffic.
Coverage
Intrusion prevention systems such as SNORT® provide an effective tool to detect China Chopper activity due to specific signatures present at the end of each command. In addition to intrusion prevention systems, it is advisable to employ endpoint detection and response tools (EDR) such as Cisco AMP for Endpoints, which gives users the ability to track process invocation and inspect processes. Try AMP for free here.
Additional ways our customers can detect and block these threats are listed below.
Cisco Cloud Web Security (CWS) or Web Security Appliance (WSA) web scanning prevents access to malicious websites and detects malware used in these attacks.
Email Security can block malicious emails sent by threat actors as part of their campaign.
Network Security appliances such as Next-Generation Firewall (NGFW), Next-Generation Intrusion Prevention System (NGIPS), and Meraki MX can detect malicious activity associated with this threat.
AMP Threat Grid helps identify malicious binaries and build protection into all Cisco Security products.
Umbrella, our secure internet gateway (SIG), blocks users from connecting to malicious domains, IPs, and URLs, whether users are on or off the corporate network.
Open Source SNORTⓇ Subscriber Rule Set customers can stay up to date by downloading the latest rule pack available for purchase on Snort.org.
Indicators of Compromise (IOCs)
The following IOCs have been observed associated with Watchbog.
Hashes (SHA256):
b383d0fdfa5036ccfa5d9c2b43cbfd814bce8778978873057b86678e5295fc61 0b0567c9b45ea0a3ea4267001f0760ccdf2b8224fceaf8979d32fcceb2d6fb7a
3A6271A90D0F6CC8A2D31D45D931E8401F13F7377932BA07D871DC42F252B9CA
Domains:
aziplcr72qjhzvin[.]onion[.]to
Misc:
Monero Wallet (Same wallet as the Alibaba Cloud Post)
47k2wdnyyBoMT6N9ho5Y7uQg1J6gPsTboKP6JXfB5msf3jUUvTfEceK5U7KLnWir5VZPKgUVxpkXnJLmijau3VZ8D2zsyL7
#gallery-0-5 { margin: auto; } #gallery-0-5 .gallery-item { float: left; margin-top: 10px; text-align: center; width: 33%; } #gallery-0-5 img { border: 2px solid #cfcfcf; } #gallery-0-5 .gallery-caption { margin-left: 0; } /* see gallery_shortcode() in wp-includes/media.php */
Go to Source Author: Watchbog and the Importance of Patching Original Post from Talos Security Author: By Luke DuCharme and Paul Lee. What Happened? Cisco Incident Response (CSIRS) recently responded to an incident involving the Watchbog…
0 notes
Text
Reduce NetFlow Programming Costs and Complexity
Reduce NetFlow Programming Costs and Complexity Keith Bromley Wed, 07/31/2019 - 08:47
While NetFlow technology has been available for years, many enterprises are reluctant to fully deploy it. This is for good reason. Turning on the NetFlow feature can increase CPU load by 10% or more. In addition, NetFlow is typically programmed manually using a command line interface (CLI). NetFlow also has to be enabled across all of the network switches to get the full benefit. Therefore, the performance degradation and network outage risk associated with this technology has been a barrier to deployment.
This is unfortunate, as NetFlow provides summarized network data that provides many benefits like the following:
The ability to see network bottlenecks
Observe denial of service (DOS) attacks
Determine where to deploy quality of service (QOS) improvements
Manage resource utilization of network components
Read this solution brief to see how Ixia can solve NetFlow deployment problems so that you can quickly and easily harness the power of the NetFlow feature. In addition to offloading (removing) the CPU load issue as well as the programming issue (as Ixia uses an intuitive GUI interface), Ixia also offers extensive additional capabilities to basic NetFlow features. This includes geolocation, browser type, device type and other information. See how you can take advantage of these features to optimize your network management.
Solution Briefs
<!--//--><![CDATA[// ><!-- hbspt.forms.create({ css: '', portalId: '1842880', onFormSubmit: function($form) {formalyzer_call_onclick(23383);}, formId: 'ec96f0cd-5e8c-4dc5-8ba1-32b6fdd468ba', }); //--><!]]> <!--//--><![CDATA[// ><!-- llfrmid=23383 //--><!]]>
Reduce NetFlow Programming Costs Complexity
Visibility – Packet Brokers
Ebooks / Reprints
March 8, 2017
The ABCs of Network Visibility
White Papers
January 10, 2017
Best Practices for Network Monitoring
White Papers
October 3, 2016
Supercharge Your Monitoring Tools
Solution Briefs
October 3, 2016
Application Intelligence Improves Troubleshooting Time and Costs
Related Solutions
Network Visibility
Download
from Ixia https://ift.tt/315STtI via IFTTT
0 notes