#predictive dashboard tools
Explore tagged Tumblr posts
Visit Tumblr Blog
Explore Tumblr blogs with no restrictions, modern design and the best experience.
Last Seen Tumblr Blogs


Fun Fact
Average visit duration of Tumblr.com is 10 mins and 25 secs.
Text
Make Smarter Moves, Not Just Faster Ones: The AI Decision Matrix You Didn’t Know You Needed
Make Smarter Moves, Not Just Faster Ones The AI Decision Matrix You Didn’t Know You Needed Ever felt like you were making business decisions with one eye closed, spinning the Wheel of Fortune, and hoping for the best? Yeah, me too. Let’s be honest: most entrepreneurs spend more time guessing than assessing. But here’s the plot twist, guesswork doesn’t scale. That’s where the AI-powered…
#AI decision matrix#AI predictive metrics#AI strategy for business growth#Business consulting#Business Growth#Business Strategy#data-driven business planning#Entrepreneur#Entrepreneurship#goal-based business dashboards#how to make smarter business decisions with AI#Leadership#Lori Brooks#Motivation#NLP-based decision making#Personal branding#Personal Development#predictive dashboard tools#Productivity#strategic clarity with AI#Technology Equality#Time Management#visual decision-making for entrepreneurs
1 note
·
View note
Text
From Data to Decisions: Empowering Teams with Databricks AI/BI
🚀 Unlock the Power of Data with Databricks AI/BI! 🚀 Imagine a world where your entire team can access data insights in real-time, without needing to be data experts. Databricks AI/BI is making this possible with powerful features like conversational AI
In today’s business world, data is abundant—coming from sources like customer interactions, sales metrics, and supply chain information. Yet many organizations still struggle to transform this data into actionable insights. Teams often face siloed systems, complex analytics processes, and delays that hinder timely, data-driven decisions. Databricks AI/BI was designed with these challenges in…
#AI/BI#artificial intelligence#BI tools#Business Intelligence#Conversational AI#Data Analytics#data democratization#Data Governance#Data Insights#Data Integration#Data Visualization#data-driven decisions#Databricks#finance#Genie AI assistant#healthcare#logistics#low-code dashboards#predictive analytics#self-service analytics
0 notes
Text
Mastering Efficiency: Retail Inventory Management Solutions
Business intelligence (BI) in the retail industry delivers comprehensive data on contact between customers and eCommerce stores. This data can allow merchants to make better business decisions. It can also assist brick-and-mortar stores in understanding client behavior, making merchandise adjustments, and altering prices accordingly. Business intelligence helps merchants be prepared for pricing, stock availability, trends, shipping, and more.

Optimize your retail operations with precision. Explore our advanced inventory management solutions for seamless efficiency and improved profitability.
#Benefits of BI in Retail#Best BI software for Retail Industry#BI for retail industry#BI in Retail Industry#BI solutions for retail#Business analytics in retail industry#Business Intelligence in Retail Industry#Business Intelligence Tools for Retail#Customer Behavior Analysis#Retail Inventory Management#Omnichannel Retail Analytics#Predictive Analytics for Retail#Retail Analytics Solutions#Retail Business Intelligence#Retail Competitive Intelligence#Retail Data Analysis#Retail Dashboard Solutions#Retail Intelligence Software#Retail Performance Metrics#Retail Sales Forecasting#Retail Marketing Analytics#Supply Chain Analytics for Retail
1 note
·
View note
Text
BLACKMAIL — Lee Heeseung (Teaser)

pairing: student!heeseung x femstudent!reader
genre: high school!au, enemies-ish to ???, slice of life, humor with tension
warnings: light blackmail, bullying accusations, mild language, gossip, school angst, sleep-deprivation
📝: hello! this is my first fanfiction here. im a bit anxious because its my first time sharing my stories online... so feel free to share your feedback and reblog if you look forward to it.༉‧₊˚.♡₊˚.༄
release date: ???

Cleaning duty was supposed to be boring.
Sweep a little. Pretend to clean more. Text your friends. Maybe sneak in an energy drink and call it a day.
You definitely weren’t expecting to walk in and find Lee Heeseung already there—standing by the window with the blinds half-drawn like a broody webtoon male lead.
He didn’t look up when you came in. Didn’t say hi. Just… existed. Quietly.
Creepily.
He handed you a broom like he was passing on a cursed artifact. No words, just judgment.
You accepted it and stared at him, squinting suspiciously. “You—what’s your name again?”
He glanced your way. “Heeseung.”
You blinked. “That’s your first name?”
“Yeah.”
“…Okay, cool. Love that for you.”
You sighed and started sweeping near the back desks, doing the bare minimum so you could go home and binge-edit your webcomic updates. Or sleep. Whichever came first.
Except… you got bored. Fast.
So you sat under a desk, pulled out your phone, and opened the Sweet Vengeance dashboard. Just to check comments. Just a quick peek.
You tapped a spam comment—delete.
You tapped another—blocked.
And then, just as you were scrolling through user messages, a shadow loomed over your screen.
You froze.
Heeseung was standing right in front of you, looking down with the expression of someone watching a car crash they predicted 5 seconds earlier.
You nearly chucked your phone across the room.
“W-What are you doing?!” you snapped, flustered.
“Cleaning,” he said flatly.
“I—what—I was just—” You glanced at your screen, still open to the admin panel. You flipped it over, face-down, like it could erase the memory.
But he’d already seen.
“You’re Sweet Vengeance’s author, right?”
You stared at him. Brain buffering.
“…What?”
He tilted his head slightly. “It’s not a hard question.”
“I—no—I’m just a fan—"
“You were deleting comments.”
“ANYONE can delete comments—!”
He raised an eyebrow.
“…Okay, no, that’s a lie, but you can’t prove anything.”
“I saw the dashboard,” he said calmly. “You tapped the moderation tools. Triple-clicked a flagged user. That only shows up for account owners.”
You blinked. “Are you a hacker?”
“No,” he said, way too casually. “Just observant.”
You gawked at him. “This is invasion of privacy!”
“You were in the open.”
“I was under a desk!”
He shrugged.
“You’re not going to tell anyone… are you?” you asked slowly, stomach sinking.
“No.”
“…Seriously?”
“If you do what I ask.”
Your mouth fell open. “Excuse me?”
“I won’t tell anyone,” Heeseung repeated, cool and calm as ever, “if you do a few things for me.”
“You’re blackmailing me?!”
“I’m offering you a mutually beneficial agreement.”

#enhypen#enhypen x reader#lee heesung x reader#heeseung#heeseung fanfic#heeseung angst#heeseung fluff#heeseung scenarios#heeseung x you#heeseung x yn#heeseung soft thoughts#heeseung soft hours
39 notes
·
View notes
Text
The reverse-centaur apocalypse is upon us

I'm coming to DEFCON! On Aug 9, I'm emceeing the EFF POKER TOURNAMENT (noon at the Horseshoe Poker Room), and appearing on the BRICKED AND ABANDONED panel (5PM, LVCC - L1 - HW1–11–01). On Aug 10, I'm giving a keynote called "DISENSHITTIFY OR DIE! How hackers can seize the means of computation and build a new, good internet that is hardened against our asshole bosses' insatiable horniness for enshittification" (noon, LVCC - L1 - HW1–11–01).

In thinking about the relationship between tech and labor, one of the most useful conceptual frameworks is "centaurs" vs "reverse-centaurs":
https://pluralistic.net/2022/04/17/revenge-of-the-chickenized-reverse-centaurs/
A centaur is someone whose work is supercharged by automation: you are a human head atop the tireless body of a machine that lets you get more done than you could ever do on your own.
A reverse-centaur is someone who is harnessed to the machine, reduced to a mere peripheral for a cruelly tireless robotic overlord that directs you to do the work that it can't, at a robotic pace, until your body and mind are smashed.
Bosses love being centaurs. While workplace monitoring is as old as Taylorism – the "scientific management" of the previous century that saw labcoated frauds dictating the fine movements of working people in a kabuki of "efficiency" – the lockdowns saw an explosion of bossware, the digital tools that let bosses monitor employees to a degree and at a scale that far outstrips the capacity of any unassisted human being.
Armed with bossware, your boss becomes a centaur, able to monitor you down to your keystrokes, the movements of your eyes, even the ambient sound around you. It was this technology that transformed "work from home" into "live at work." But bossware doesn't just let your boss spy on you – it lets your boss control you. \
It turns you into a reverse-centaur.
"Data At Work" is a research project from Cracked Labs that dives deep into the use of surveillance and control technology in a variety of workplaces – including workers' own cars and homes:
https://crackedlabs.org/en/data-work
It consists of a series of papers that take deep dives into different vendors' bossware products, exploring how they are advertised, how they are used, and (crucially) how they make workers feel. There are also sections on how these interact with EU labor laws (the project is underwritten by the Austrian Arbeiterkammer), with the occasional aside about how weak US labor laws are.
The latest report in the series comes from Wolfie Christl, digging into Microsoft's "Dynamics 365," a suite of mobile apps designed to exert control over "field workers" – repair technicians, security guards, cleaners, and home help for ill, elderly and disabled people:
https://crackedlabs.org/dl/CrackedLabs_Christl_MobileWork.pdf
It's…not good. Microsoft advises its customers to use its products to track workers' location every "60 to 300 seconds." Workers are given tasks broken down into subtasks, each with its own expected time to completion. Workers are expected to use the app every time they arrive at a site, begin or complete a task or subtask, or start or end a break.
For bosses, all of this turns into a dashboard that shows how each worker is performing from instant to instant, whether they are meeting time targets, and whether they are spending more time on a task than the client's billing rate will pay for. Each work order has a clock showing elapsed seconds since it was issued.
For workers, the system generates new schedules with new work orders all day long, refreshing your work schedule as frequently as twice per hour. Bosses can flag workers as available for jobs that fall outside their territories and/or working hours, and the system will assign workers to jobs that require them to work in their off hours and travel long distances to do so.
Each task and subtask has a target time based on "AI" predictions. These are classic examples of Goodhart's Law: "any metric eventually becomes a target." The average time that workers take becomes the maximum time that a worker is allowed to take. Some jobs are easy, and can be completed in less time than assigned. When this happens, the average time to do a job shrinks, and the time allotted for normal (or difficult) jobs contracts.
Bosses get stack-ranks of workers showing which workers closed the most tickets, worked the fastest, spent the least time idle between jobs, and, of course, whether the client gave them five stars. Workers know it, creating an impossible bind: to do the job well, in a friendly fashion, the worker has to take time to talk with the client, understand their needs, and do the job. Anything less will generate unfavorable reports from clients. But doing this will blow through time quotas, which produces bad reports from the bossware. Heads you lose, tails the boss wins.
Predictably, Microsoft has shoveled "AI" into every corner of this product. Bosses don't just get charts showing them which workers are "underperforming" – they also get summaries of all the narrative aspects of the workers' reports (e.g. "My client was in severe pain so I took extra time to make her comfortable before leaving"), filled with the usual hallucinations and other botshit.
No boss could exert this kind of fine-grained, soul-destroying control over any workforce, much less a workforce that is out in the field all day, without Microsoft's automation tools. Armed with Dynamics 365, a boss becomes a true centaur, capable of superhuman feats of labor abuse.
And when workers are subjected to Dynamics 365, they become true reverse-centaurs, driven by "digital whips" to work at a pace that outstrips the long-term capacity of their minds and bodies to bear it. The enthnographic parts of the report veer between chilling and heartbreaking.
Microsoft strenuously objects to this characterization, insisting that their tool (which they advise bosses to use to check on workers' location every 60-300 seconds) is not a "surveillance" tool, it's a "coordination" tool. They say that all the AI in the tool is "Responsible AI," which is doubtless a great comfort to workers.
In Microsoft's (mild) defense, they are not unique. Other reports in the series show how retail workers and hotel housekeepers are subjected to "despot on demand" services provided by Oracle:
https://crackedlabs.org/en/data-work/publications/retail-hospitality
Call centers, are even worse. After all, most of this stuff started with call centers:
https://crackedlabs.org/en/data-work/publications/callcenter
I've written about Arise, a predatory "work from home" company that targets Black women to pay the company to work for it (they also have to pay if they quit!). Of course, they can be fired at will:
https://pluralistic.net/2021/07/29/impunity-corrodes/#arise-ye-prisoners
There's also a report about Celonis, a giant German company no one has ever heard of, which gathers a truly nightmarish quantity of information about white-collar workers' activities, subjecting them to AI phrenology to judge their "emotional quality" as well as other metrics:
https://crackedlabs.org/en/data-work/publications/processmining-algomanage
As Celonis shows, this stuff is coming for all of us. I've dubbed this process "the shitty technology adoption curve": the terrible things we do to prisoners, asylum seekers and people in mental institutions today gets repackaged tomorrow for students, parolees, Uber drivers and blue-collar workers. Then it works its way up the privilege gradient, until we're all being turned into reverse-centaurs under the "digital whip" of a centaur boss:
https://pluralistic.net/2020/11/25/the-peoples-amazon/#clippys-revenge
In mediating between asshole bosses and the workers they destroy, these bossware technologies do more than automate: they also insulate. Thanks to bossware, your boss doesn't have to look you in the eye (or come within range of your fists) to check in on you every 60 seconds and tell you that you've taken 11 seconds too long on a task. I recently learned a useful term for this: an "accountability sink," as described by Dan Davies in his new book, The Unaccountability Machine, which is high on my (very long) list of books to read:
https://profilebooks.com/work/the-unaccountability-machine/
Support me this summer on the Clarion Write-A-Thon and help raise money for the Clarion Science Fiction and Fantasy Writers' Workshop!
If you'd like an essay-formatted version of this post to read or share, here's a link to it on pluralistic.net, my surveillance-free, ad-free, tracker-free blog:
https://pluralistic.net/2024/08/02/despotism-on-demand/#virtual-whips
Image: Cryteria (modified) https://commons.wikimedia.org/wiki/File:HAL9000.svg
CC BY 3.0 https://creativecommons.org/licenses/by/3.0/deed.en
#pluralistic#bossware#surveillance#microsoft#gig work#reverse centaurs#labor#Wolfie Christl#cracked labs#data at work#AlgorithmWatch#Arbeiterkammer#austria#call centers#retail#dystopianism#torment nexus#shitty technology adoption curve
94 notes
·
View notes
Text
Data Analysis: Turning Information into Insight
In nowadays’s digital age, statistics has come to be a vital asset for businesses, researchers, governments, and people alike. However, raw facts on its personal holds little value till it's far interpreted and understood. This is wherein records evaluation comes into play. Data analysis is the systematic manner of inspecting, cleansing, remodeling, and modeling facts with the objective of coming across beneficial information, drawing conclusions, and helping selection-making.
What Is Data Analysis In Research

What is Data Analysis?
At its middle, records analysis includes extracting meaningful insights from datasets. These datasets can variety from small and based spreadsheets to large and unstructured facts lakes. The primary aim is to make sense of data to reply questions, resolve issues, or become aware of traits and styles that are not without delay apparent.
Data evaluation is used in truely every enterprise—from healthcare and finance to marketing and education. It enables groups to make proof-based choices, improve operational efficiency, and advantage aggressive advantages.
Types of Data Analysis
There are several kinds of information evaluation, every serving a completely unique purpose:
1. Descriptive Analysis
Descriptive analysis answers the question: “What happened?” It summarizes raw facts into digestible codecs like averages, probabilities, or counts. For instance, a store might analyze last month’s sales to decide which merchandise achieved satisfactory.
2. Diagnostic Analysis
This form of evaluation explores the reasons behind beyond outcomes. It answers: “Why did it occur?” For example, if a agency sees a surprising drop in internet site visitors, diagnostic evaluation can assist pinpoint whether or not it changed into because of a technical problem, adjustments in search engine marketing rating, or competitor movements.
3. Predictive Analysis
Predictive analysis makes use of historical information to forecast destiny consequences. It solutions: “What is probable to occur?” This includes statistical models and system getting to know algorithms to pick out styles and expect destiny trends, such as customer churn or product demand.
4. Prescriptive Analysis
Prescriptive analysis provides recommendations primarily based on facts. It solutions: “What have to we do?” This is the maximum advanced type of analysis and often combines insights from predictive analysis with optimization and simulation techniques to manual selection-making.
The Data Analysis Process
The technique of information analysis commonly follows those steps:
1. Define the Objective
Before diving into statistics, it’s essential to without a doubt recognize the question or trouble at hand. A well-defined goal guides the entire analysis and ensures that efforts are aligned with the preferred outcome.
2. Collect Data
Data can come from numerous sources which includes databases, surveys, sensors, APIs, or social media. It’s important to make certain that the records is relevant, timely, and of sufficient high-quality.
3. Clean and Prepare Data
Raw information is regularly messy—it may comprise missing values, duplicates, inconsistencies, or mistakes. Data cleansing involves addressing these problems. Preparation may include formatting, normalization, or growing new variables.
Four. Analyze the Data
Tools like Excel, SQL, Python, R, or specialized software consisting of Tableau, Power BI, and SAS are typically used.
5. Interpret Results
Analysis isn't pretty much numbers; it’s about meaning. Interpreting effects involves drawing conclusions, explaining findings, and linking insights lower back to the authentic goal.
6. Communicate Findings
Insights have to be communicated effectively to stakeholders. Visualization tools including charts, graphs, dashboards, and reports play a vital position in telling the story behind the statistics.
7. Make Decisions and Take Action
The last aim of statistics analysis is to tell selections. Whether it’s optimizing a advertising marketing campaign, improving customer support, or refining a product, actionable insights flip data into real-global effects.
Tools and Technologies for Data Analysis
A big selection of gear is available for facts analysis, each suited to distinct tasks and talent levels:
Excel: Great for small datasets and short analysis. Offers capabilities, pivot tables, and charts.
Python: Powerful for complicated facts manipulation and modeling. Popular libraries consist of Pandas, NumPy, Matplotlib, and Scikit-learn.
R: A statistical programming language extensively used for statistical analysis and statistics visualization.
SQL: Essential for querying and handling information saved in relational databases.
Tableau & Power BI: User-friendly enterprise intelligence equipment that flip facts into interactive visualizations and dashboards.
Healthcare: Analyzing affected person statistics to enhance treatment plans, predict outbreaks, and control resources.
Finance: Detecting fraud, coping with threat, and guiding investment techniques.
Retail: Personalizing advertising campaigns, managing inventory, and optimizing pricing.
Sports: Enhancing performance through participant records and game analysis.
Public Policy: Informing choices on schooling, transportation, and financial improvement.
Challenges in Data Analysis
Data Quality: Incomplete, old, or incorrect information can lead to deceptive conclusions.
Data Privacy: Handling sensitive records requires strict adherence to privacy guidelines like GDPR.
Skill Gaps: There's a developing demand for skilled information analysts who can interpret complicated facts sets.
Integration: Combining facts from disparate resources may be technically hard.
Bias and Misinterpretation: Poorly designed analysis can introduce bias or lead to wrong assumptions.
The Future of Data Analysis
As facts keeps to grow exponentially, the sector of facts analysis is evolving rapidly. Emerging developments include:
Artificial Intelligence (AI) & Machine Learning: Automating evaluation and producing predictive fashions at scale.
Real-Time Analytics: Enabling decisions based totally on live data streams for faster reaction.
Data Democratization: Making records handy and understandable to everybody in an business enterprise
2 notes
·
View notes
Text
The Automation Revolution: How Embedded Analytics is Leading the Way

Embedded analytics tools have emerged as game-changers, seamlessly integrating data-driven insights into business applications and enabling automation across various industries. By providing real-time analytics within existing workflows, these tools empower organizations to make informed decisions without switching between multiple platforms.
The Role of Embedded Analytics in Automation
Embedded analytics refers to the integration of analytical capabilities directly into business applications, eliminating the need for separate business intelligence (BI) tools. This integration enhances automation by:
Reducing Manual Data Analysis: Automated dashboards and real-time reporting eliminate the need for manual data extraction and processing.
Improving Decision-Making: AI-powered analytics provide predictive insights, helping businesses anticipate trends and make proactive decisions.
Enhancing Operational Efficiency: Automated alerts and anomaly detection streamline workflow management, reducing bottlenecks and inefficiencies.
Increasing User Accessibility: Non-technical users can easily access and interpret data within familiar applications, enabling data-driven culture across organizations.
Industry-Wide Impact of Embedded Analytics
1. Manufacturing: Predictive Maintenance & Process Optimization
By analyzing real-time sensor data, predictive maintenance reduces downtime, enhances production efficiency, and minimizes repair costs.
2. Healthcare: Enhancing Patient Outcomes & Resource Management
Healthcare providers use embedded analytics to track patient records, optimize treatment plans, and manage hospital resources effectively.
3. Retail: Personalized Customer Experiences & Inventory Optimization
Retailers integrate embedded analytics into e-commerce platforms to analyze customer preferences, optimize pricing, and manage inventory.
4. Finance: Fraud Detection & Risk Management
Financial institutions use embedded analytics to detect fraudulent activities, assess credit risks, and automate compliance monitoring.
5. Logistics: Supply Chain Optimization & Route Planning
Supply chain managers use embedded analytics to track shipments, optimize delivery routes, and manage inventory levels.
6. Education: Student Performance Analysis & Learning Personalization
Educational institutions utilize embedded analytics to track student performance, identify learning gaps, and personalize educational experiences.
The Future of Embedded Analytics in Automation
As AI and machine learning continue to evolve, embedded analytics will play an even greater role in automation. Future advancements may include:
Self-Service BI: Empowering users with more intuitive, AI-driven analytics tools that require minimal technical expertise.
Hyperautomation: Combining embedded analytics with robotic process automation (RPA) for end-to-end business process automation.
Advanced Predictive & Prescriptive Analytics: Leveraging AI for more accurate forecasting and decision-making support.
Greater Integration with IoT & Edge Computing: Enhancing real-time analytics capabilities for industries reliant on IoT sensors and connected devices.
Conclusion
By integrating analytics within existing workflows, businesses can improve efficiency, reduce operational costs, and enhance customer experiences. As technology continues to advance, the synergy between embedded analytics and automation will drive innovation and reshape the future of various industries.
To know more: data collection and insights
data analytics services
2 notes
·
View notes
Text
Business Analytics vs. Data Science: Understanding the Key Differences

In today's data-driven world, terms like "business analytics" and "data science" are often used interchangeably. However, while they share a common goal of extracting insights from data, they are distinct fields with different focuses and methodologies. Let's break down the key differences to help you understand which path might be right for you.
Business Analytics: Focusing on the Present and Past
Business analytics primarily focuses on analyzing historical data to understand past performance and inform current business decisions. It aims to answer questions like:
What happened?
Why did it happen?
What is happening now?
Key characteristics of business analytics:
Descriptive and Diagnostic: It uses techniques like reporting, dashboards, and data visualization to summarize and explain past trends.
Structured Data: It often works with structured data from databases and spreadsheets.
Business Domain Expertise: A strong understanding of the specific business domain is crucial.
Tools: Business analysts typically use tools like Excel, SQL, Tableau, and Power BI.
Focus: Optimizing current business operations and improving efficiency.
Data Science: Predicting the Future and Building Models
Data science, on the other hand, focuses on building predictive models and developing algorithms to forecast future outcomes. It aims to answer questions like:
What will happen?
How can we make it happen?
Key characteristics of data science:
Predictive and Prescriptive: It uses machine learning, statistical modeling, and AI to predict future trends and prescribe optimal actions.
Unstructured and Structured Data: It can handle both structured and unstructured data from various sources.
Technical Proficiency: Strong programming skills (Python, R) and a deep understanding of machine learning algorithms are essential.
Tools: Data scientists use programming languages, machine learning libraries, and big data technologies.
Focus: Developing innovative solutions, building AI-powered products, and driving long-term strategic initiatives.
Key Differences Summarized:

Which Path is Right for You?
Choose Business Analytics if:
You are interested in analyzing past data to improve current business operations.
You have a strong understanding of a specific business domain.
You prefer working with structured data and using visualization tools.
Choose Data Science if:
You are passionate about building predictive models and developing AI-powered solutions.
You have a strong interest in programming and machine learning.
You enjoy working with both structured and unstructured data.
Xaltius Academy's Data Science & AI Course:
If you're leaning towards data science and want to delve into machine learning and AI, Xaltius Academy's Data Science & AI course is an excellent choice. This program equips you with the necessary skills and knowledge to become a proficient data scientist, covering essential topics like:
Python programming
Machine learning algorithms
Data visualization
And much more!
By understanding the distinct roles of business analytics and data science, you can make an informed decision about your career path and leverage the power of data to drive success.
2 notes
·
View notes
Text
Entyx AI-Powered Ads on Twitch: Streaming Marketing

Entyx AI Takes Over Twitch Ads
Launching an ad campaign on Twitch or elsewhere sounds exciting—until the reality kicks in. You pick streamers, negotiate deals, and design creatives, only to see zero feedback and engagement. No clicks, no conversions, only silly comments—basically just a wasted budget at the end of the day. But what if we say AI could change all that?
In this article, we will discuss how AI ad evolution makes streaming a powerful opportunity for advertisements. Entyx AI in marketing predicts trends and turns ordinary campaigns into intelligent, high-performing campaigns. Here’s how it works!
AI Learns from Viewer Behavior
Imagine yourself being a marketer who has to launch an ad campaign on Twitch. You are carefully choosing streamers, negotiating the conditions of integration, designing creative banners, and finally launching. Worst-case scenario: the week has passed and you see no results: your ads are very blatant, viewers do not click on your banners during live streams, there's no personalization, chat users literally ignore promos and the budget is being wasted with not even a hint on a high ROI.
Now picture this, your best-case scenario: you discover AI-powered marketing, and here starts the happy marketer’s life! AI gives you access to the channel activity overview of each streamer you like, you can calculate the real price of their ads, and choose the most suitable streamers aligned with your target audience and business goals for promoting your goods, AI-powered ads engage the audience with personalization and leave it mesmerized, AI listens to the chat audience and enables you to adapt ads on the fly. Conversions, engagement, and ROI are increasing. This is a new generation of Twitch marketing.
AI predictive analytics can show which content will drive engagement by analyzing past Twitch campaigns. This data is available in 360-degree dashboards. AI provides marketers not only with accurate numbers on a campaign’s performance but also behavioral insights! Sentiment Tracking analyses the tone and sentiment of influencers when mentioning your brand or specific keywords. This tool identifies whether the sentiment is positive, negative, or neutral, helping you understand how influencers represent your brand and its impact on audience perception. This way, you can easily identify the most high-converting campaigns and audience reactions to similar products.
With the help of AI, you can save time on audience segmentation. The AI tool enables you to see reactions to your products in chat during a particular streamer’s live stream in real-time and afterward compare it with other audiences’ reactions to the same product. Or during games, you can get insights that for example the audience watching Valorant is more receptive to gaming peripheral ads than those watching Just Chatting. With AI behavioral insights you can determine which streamers from your list fit better for concrete ad integrations. Moreover, you can change your ad banners on the streamer’s page by yourself during live streams without distracting the streamer to keep it always fresh and best-converting. But understanding your audience's behavior is just the tip of the iceberg—AI also enables real-time ad adaptation!
AI-Powered Ad Adaptation in Real Time
Let’s say, streamer Alex is in the middle of an intense cybersports tournament, his team wins a round, and surely the chat bursts with happy comments. And at this euphoric moment, AI triggers a perfectly timed ad saying: “Victory starts with the best gaming mouse, -20% off to each fan right now!”. This is not a regular ad—it’s a conversion machine that would get all the attention because it appears at the right moment and at the right time when everyone is feeling happiness (read: more likely to spend money).
How does this happen? The advertiser’s team manages the ad campaign and tracks audience behavior in real-time, getting access to adjust their ads instantly on the page on the streamer, all within an AI-driven Marketing Platform. They see all numbers of views, clicks, engagement tracking, and even the tone the streamer speaks about the product. And in the right moment, they place those CTA banners to get the most sales. This is all possible with Entyx AI real-time optimization.
AI dynamic ads in real-time have multiple advantages besides the ones mentioned above:
AI algorithms calculate how long the brand logos are in a frame.
If a streamer wins a tournament, advertisers can place an ad saying: “Your moment of victory - with a new gamer seat!” and AI personalized marketing will show it on the page immediately.
If there’s a vivid discussion in chat about a specific product of a brand, AI can signal to the advertiser to integrate relevant ads or promo codes to drive more sales.
If in the chat the audience uses a keyword - it will also be a signal of the best moment to monetize the traffic in any way the advertiser plans.
As a result, instead of boring, same-type advertising, viewers get the perks of AI machine learning technology—ad relevance and adaptive content that look natural, improve CTR, engage the audience at the same time, and exclude irrelevant ads.
As you already know, AI analyzes not only visual content—it listens and understands what the audience says, what streamers say, and how all of them react. Let’s talk more about it.
AI-Driven Voice and Chat Analysis: A New Level of Context Awareness
A company sells energy drinks and launches a campaign on Twitch. How to understand if it’s relevant and get audience insights into the product? Entyx AI audio recognition can analyze the streamer’s voice. Also, Entyx AI can track keywords in the chat.

If someone in the chat drops a comment like “I’m tired”, AI can instantly track “tired” as a keyword to launch a relevant ad, saying: “Try a new energy drink to rock your night”. Our AI tool scans video audio to detect mentions of specific keywords and phrases. It provides statistics on frequency, context, and audience reactions, offering deeper insights into content perception and effectiveness.
If viewers like to discuss night marathons, AI chat monitoring also signals what context is better to display on banners and how to tailor ads to the context. AI listens, reads, understands, and reacts. A streamer praises a gaming headset? AI signals advertisers to set on a streamer’s page a promo code banner in real-time. This isn’t just tracking—it’s AI-powered engagement.
Voice recognition and sentiment analysis display on dashboards streamers’ attitudes to the products they promote when mentioning your brand or specific keywords. This tool identifies whether the sentiment is positive, negative, or neutral, helping you understand how influencers represent your brand and its impact on audience perception.
An advertiser can immediately decide whether to save the brand’s reputation or cut it for promotional content on socials. If AI has already been changing Twitch ads, what shall we expect in the future?
The Future of AI in Twitch Advertising
Imagine vocalizing that you want something, and AI instantly tailors an ad to your preference. For example, it allows you to choose the color of your custom-made gamepad during the live stream.
Let’s fantasize more about the marketing evolution:
Voice commands in advertising. Viewers will be able to say “I want to try this!” and AI will register their interest and target ads will be customized.
AR-ads. Try a virtual gamer’s headset in real-time.
Full personalization. AI will analyze your mood (based on your tone), gaming history, and recent chat activity to display an ad that feels hyper-personalized—almost like it’s reading your mind.
This way, Twitch advertisements will become dynamic, fully interactive, immersive, and irresistible. How does Twitch ad innovation change the market?
AI will make ads natural and highly efficient. Viewers will not feel ads like being ads anymore.
The accuracy of forecasting the ROI of ad campaigns will significantly increase.
Final Thought
AI advertising will never replace marketers but will surely make Twitch marketing smarter, more effective, and more profitable. Such AI-driven Marketing Platforms like Entyx help advertisers maximize the results of their campaigns on Twitch. Entyx enables easy campaign optimization in real-time and ad personalization following the audience’s needs.
Advertisers who have already integrated AI tools into their daily lives, profit from increased engagement levels and high conversions. AI is seamlessly improving Twitch advertising, and Entyx is leading the charge. Try yourself how an AI-driven platform can adapt ads in real-time and eavesdrop on what the audience is saying. Check it out! See you in the next article!
2 notes
·
View notes
Text
Why Tableau is Essential in Data Science: Transforming Raw Data into Insights

Data science is all about turning raw data into valuable insights. But numbers and statistics alone don’t tell the full story—they need to be visualized to make sense. That’s where Tableau comes in.
Tableau is a powerful tool that helps data scientists, analysts, and businesses see and understand data better. It simplifies complex datasets, making them interactive and easy to interpret. But with so many tools available, why is Tableau a must-have for data science? Let’s explore.
1. The Importance of Data Visualization in Data Science
Imagine you’re working with millions of data points from customer purchases, social media interactions, or financial transactions. Analyzing raw numbers manually would be overwhelming.
That’s why visualization is crucial in data science:
Identifies trends and patterns – Instead of sifting through spreadsheets, you can quickly spot trends in a visual format.
Makes complex data understandable – Graphs, heatmaps, and dashboards simplify the interpretation of large datasets.
Enhances decision-making – Stakeholders can easily grasp insights and make data-driven decisions faster.
Saves time and effort – Instead of writing lengthy reports, an interactive dashboard tells the story in seconds.
Without tools like Tableau, data science would be limited to experts who can code and run statistical models. With Tableau, insights become accessible to everyone—from data scientists to business executives.
2. Why Tableau Stands Out in Data Science
A. User-Friendly and Requires No Coding
One of the biggest advantages of Tableau is its drag-and-drop interface. Unlike Python or R, which require programming skills, Tableau allows users to create visualizations without writing a single line of code.
Even if you’re a beginner, you can:
✅ Upload data from multiple sources
✅ Create interactive dashboards in minutes
✅ Share insights with teams easily
This no-code approach makes Tableau ideal for both technical and non-technical professionals in data science.
B. Handles Large Datasets Efficiently
Data scientists often work with massive datasets—whether it’s financial transactions, customer behavior, or healthcare records. Traditional tools like Excel struggle with large volumes of data.
Tableau, on the other hand:
Can process millions of rows without slowing down
Optimizes performance using advanced data engine technology
Supports real-time data streaming for up-to-date analysis
This makes it a go-to tool for businesses that need fast, data-driven insights.
C. Connects with Multiple Data Sources
A major challenge in data science is bringing together data from different platforms. Tableau seamlessly integrates with a variety of sources, including:
Databases: MySQL, PostgreSQL, Microsoft SQL Server
Cloud platforms: AWS, Google BigQuery, Snowflake
Spreadsheets and APIs: Excel, Google Sheets, web-based data sources
This flexibility allows data scientists to combine datasets from multiple sources without needing complex SQL queries or scripts.
D. Real-Time Data Analysis
Industries like finance, healthcare, and e-commerce rely on real-time data to make quick decisions. Tableau’s live data connection allows users to:
Track stock market trends as they happen
Monitor website traffic and customer interactions in real time
Detect fraudulent transactions instantly
Instead of waiting for reports to be generated manually, Tableau delivers insights as events unfold.
E. Advanced Analytics Without Complexity
While Tableau is known for its visualizations, it also supports advanced analytics. You can:
Forecast trends based on historical data
Perform clustering and segmentation to identify patterns
Integrate with Python and R for machine learning and predictive modeling
This means data scientists can combine deep analytics with intuitive visualization, making Tableau a versatile tool.
3. How Tableau Helps Data Scientists in Real Life
Tableau has been adopted by the majority of industries to make data science more impactful and accessible. This is applied in the following real-life scenarios:
A. Analytics for Health Care
Tableau is deployed by hospitals and research institutions for the following purposes:
Monitor patient recovery rates and predict outbreaks of diseases
Analyze hospital occupancy and resource allocation
Identify trends in patient demographics and treatment results
B. Finance and Banking
Banks and investment firms rely on Tableau for the following purposes:
✅ Detect fraud by analyzing transaction patterns
✅ Track stock market fluctuations and make informed investment decisions
✅ Assess credit risk and loan performance
C. Marketing and Customer Insights
Companies use Tableau to:
✅ Track customer buying behavior and personalize recommendations
✅ Analyze social media engagement and campaign effectiveness
✅ Optimize ad spend by identifying high-performing channels
D. Retail and Supply Chain Management
Retailers leverage Tableau to:
✅ Forecast product demand and adjust inventory levels
✅ Identify regional sales trends and adjust marketing strategies
✅ Optimize supply chain logistics and reduce delivery delays
These applications show why Tableau is a must-have for data-driven decision-making.
4. Tableau vs. Other Data Visualization Tools
There are many visualization tools available, but Tableau consistently ranks as one of the best. Here’s why:
Tableau vs. Excel – Excel struggles with big data and lacks interactivity; Tableau handles large datasets effortlessly.
Tableau vs. Power BI – Power BI is great for Microsoft users, but Tableau offers more flexibility across different data sources.
Tableau vs. Python (Matplotlib, Seaborn) – Python libraries require coding skills, while Tableau simplifies visualization for all users.
This makes Tableau the go-to tool for both beginners and experienced professionals in data science.
5. Conclusion
Tableau has become an essential tool in data science because it simplifies data visualization, handles large datasets, and integrates seamlessly with various data sources. It enables professionals to analyze, interpret, and present data interactively, making insights accessible to everyone—from data scientists to business leaders.
If you’re looking to build a strong foundation in data science, learning Tableau is a smart career move. Many data science courses now include Tableau as a key skill, as companies increasingly demand professionals who can transform raw data into meaningful insights.
In a world where data is the driving force behind decision-making, Tableau ensures that the insights you uncover are not just accurate—but also clear, impactful, and easy to act upon.
#data science course#top data science course online#top data science institute online#artificial intelligence course#deepseek#tableau
3 notes
·
View notes
Text
GIS In Our Daily Lives
The involvement of Geographic Information Systems (GIS) in our daily lives is pervasive, influencing and enhancing various aspects across different sectors. The integration of GIS into everyday activities has become integral for decision-making, planning, and optimizing resources. GIS helps city planners and transportation experts to provide them with information like maps, satellite pictures, population statistics, and infrastructure data. GIS helps them make better decisions when designing cities and transportation systems that are sustainable and good for the environment.
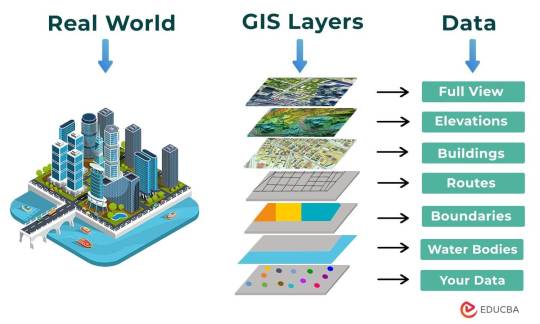
The following points elucidate the notable involvement of GIS in our daily lives:
Navigation and Location Services: GIS provides monitoring functions through the visual display of spatial data and precise geographical positioning of monitored vehicles, whereas GPS provides accurate, clear, and precise information on the position and navigation of a monitored or tracked vehicle in real-time and at the exact location.GIS is at the core of navigation applications and location-based services on smartphones. It enables accurate mapping, real-time navigation, and geolocation services, assisting individuals in finding locations, planning routes, and navigating unfamiliar areas.

E-Commerce and Delivery Services: GIS software is a powerful tool for supply chain network planning. It helps determine the optimal location for distribution centers, warehouses, or other supply facilities. GIS is utilized in logistics and delivery services for optimizing routes, tracking shipments, and ensuring timely deliveries. E-commerce platforms leverage GIS to enhance the efficiency of their supply chain and last-mile delivery processes.

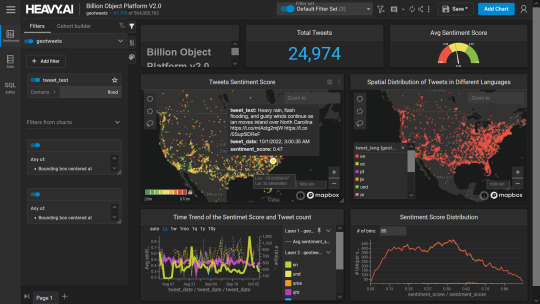
Weather Forecasting and Disaster Management: Many states are using GIS dashboard to monitor the rainfall across the state, on a real-time basis, from the data shared by rain sensors installed at various locationsGIS plays a crucial role in weather forecasting and disaster management. It assists meteorologists in analyzing spatial data, predicting weather patterns, and facilitating timely responses to natural disasters by mapping affected areas and coordinating emergency services.

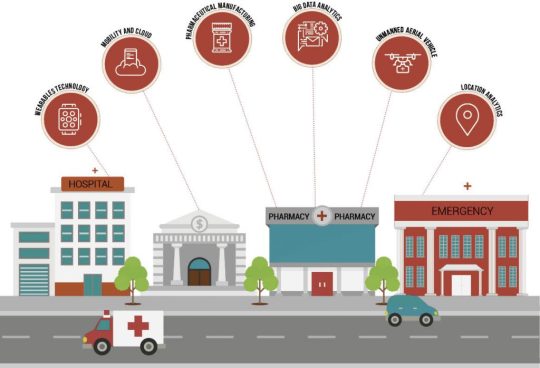
Healthcare Planning and Disease Monitoring: Geographic Information Systems enable the visualization and monitoring of infectious diseases. Additionally GIS records and displays the necessary information that health care needs of the community as well as the available resources and materials. GIS supports public health initiatives by mapping the spread of diseases, analyzing healthcare resource distribution, and assisting in the planning of vaccination campaigns. It aids in identifying high-risk areas and optimizing healthcare service delivery.
Social Media and Geo-tagging: GIS also helps in geotagging and other location related information in posts, it’s tools can map and visualize the spatial distribution of social media activity. This analysis can reveal trends, hotspots, and patterns in user engagement across different geographic areas. Many social media platforms incorporate GIS for geo-tagging, allowing users to share their location and experiences. This feature enhances social connectivity and facilitates the sharing of location-specific information.
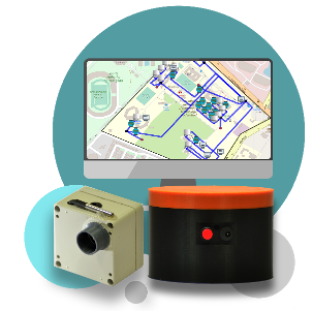
Smart City Initiatives: The Geographic Information System (GIS) offers advanced and user-friendly capabilities for Smart City projects and allows to capture, store and manipulate, analyze and visualize spatially referenced data. It is used for spatial analysis and modeling. It is the cornerstone of smart city planning, enabling the integration of data for efficient urban management. It supports initiatives related to traffic management, waste disposal, energy consumption, and overall infrastructure development.

Education and Research: GIS is increasingly utilized in education and research for visualizing and analyzing spatial data. It enables students and researchers to explore geographic relationships, conduct field studies, and enhance their understanding of various subjects.

Agricultural Management and Precision Farming: Farmers leverage GIS to optimize agricultural practices by analyzing soil conditions, crop health, and weather patterns. Precision farming techniques, facilitated by GIS, contribute to increased crop yields and sustainable farming practices.

Real Estate and Property Management: In the real estate sector, GIS aids in property mapping, land valuation, and site selection. It provides real estate professionals with valuable insights into spatial relationships, market trends, and optimal development opportunities.

Tourism and Recreation: GIS enhances the tourism industry by providing interactive maps, route planning, and location-based information. It assists tourists in exploring destinations, finding attractions, and navigating efficiently.

The broad and varied involvement of GIS in our daily lives underscores its significance as a technology that not only facilitates geographic data analysis but also contributes to the efficiency, safety, and interconnectedness of modern society. As GIS applications continue to evolve, their impact on daily activities is expected to further expand and refine.
#gis#architectdesign#architecture#city#education#geographic information system(gis)#geographical indication
13 notes
·
View notes
Text
How To Target Your Most Profitable Customers With Retail Business Intelligence

The retail industry is highly competitive, with businesses constantly vying for customer attention and loyalty. To stay ahead of the competition, retailers need to make informed and data-driven decisions. This is where Retail Business Intelligence (BI) comes into play. By harnessing the power of data analysis and advanced analytics, Retail BI enables retailers to identify and target their most profitable customers, optimize marketing strategies, and drive business growth.
#Best BI software for Retail Industry#Retail Business Intelligence#Retail Analytics Solutions#Retail Data Analysis#Retail Performance Metrics#Retail Intelligence Software#Inventory Management Analytics#Customer Behavior Analysis#Predictive Analytics for Retail#Omnichannel Retail Analytics#Business Intelligence Tools for Retail#Retail Dashboard Solutions#Supply Chain Analytics for Retail#Retail Sales Forecasting#Retail Marketing Analytics#Customer Segmentation in Retail#Retail Competitive Intelligence
0 notes
Text
About Hydrowverse
HydrowVerse, founded by Thomas David Tency and Dr. Sachin Chaudhari at IIIT Hyderabad, is dedicated to revolutionizing water resource management with innovative, non-intrusive technology. Our research-based startup provides comprehensive water intelligence solutions, focusing on seamless and efficient monitoring of tanks, borewells, water meters, and rivers without direct contact. We empower individuals and organizations with insights to manage water sustainably, inviting you to join our journey towards smarter water management.
Mission
Optimize water infrastructure operations while transforming it into a smarter, more efficient system. Enhance water management education to foster knowledge and innovation.
Vision
Our vision is to establish ourselves as a prominent brand in the field of water intelligence, providing comprehensive and end-to-end solutions for all facets of water management. We are committed to integrating Internet of Things (IoT) and artificial intelligence (AI) technologies to develop innovative monitoring and management tools. Additionally, we will offer educational services that empower stakeholders at all levels to make informed decisions regarding water resources.
HydrowVerse innovates water management with Starr, an IoT-enabled device that accurately estimates water levels in overhead and underground tanks up to 5 meters deep. Starr ensures safety and reliability by avoiding sensor contact with water. Real-time updates help organizations track water levels, prevent overflows, and manage resources effectively. Built-in tank leakage detection enables proactive maintenance to minimize water loss. Starr enhances WaterAid’s water storage and distribution efforts, leading to smarter, data-driven management for a sustainable future. Together, we ensure every drop is measured and conserved.

Our real-time dashboard is meticulously designed to provide a comprehensive overview of water resource management by integrating data from all connected devices into a user-friendly interface. This centralized platform presents key metrics and performance indicators, enabling users to monitor water usage, identify anomalies, and discern trends at a glance.
In addition to real-time data visualization, our dashboard incorporates predictive maintenance tools that analyze historical data to forecast potential issues before they escalate. This proactive approach facilitates timely interventions, minimizing downtime and associated maintenance costs.
Furthermore, the dashboard encompasses water pressure estimation capabilities, offering critical insights into system performance and ensuring optimal water distribution.
Collectively, these features empower users to make informed decisions, optimize operational efficiency, and safeguard the integrity of their water infrastructure.
Our solutions are easily adopted, seamlessly integrating with organizations of all sizes. They’re cost-effective, reducing water loss and operational costs. Real-time updates allow users to monitor water resources and address issues promptly. Our technology is scalable, growing with your needs and maintaining optimal efficiency as your infrastructure expands.
#smart meters#water tech#hydrowverse#Thomas David tency#Retrofit#Non intrusive tech#analog water meters#AI#ML#Water intelligence#leakage detection#Water Monitoring
2 notes
·
View notes
Text
Why Portfolio Managers Need Tech Platforms to Stay Competitive
Embracing technology allows portfolio managers to streamline operations and leverage data-driven insights for superior investment outcomes. By adopting advanced platforms, managers can efficiently navigate the intricacies of modern finance, ensuring they not only keep pace with industry changes but also position themselves as leaders in innovation and client satisfaction.
The competitive edge gained through technology adoption is undeniable. Platforms offering real-time data integration and powerful analytical tools enable managers to make informed decisions swiftly, reducing the risk of human error and enhancing the overall portfolio performance. Moreover, the ability to automate routine tasks frees up valuable time, allowing managers to focus on strategic growth and client relationships.
As client expectations continue to rise, the ability to deliver tailored solutions and transparent communications becomes increasingly crucial. Technology-driven platforms facilitate these demands by providing customizable reports and interactive dashboards, ensuring clients are kept informed and engaged. Such capabilities not only build trust but also foster long-term loyalty, which is essential for sustained success in the financial sector.
In summary, the shift towards tech-enhanced portfolio management is not merely a trend but a transformative evolution that is reshaping the industry. By leveraging these advanced tools, portfolio managers can harness the power of innovation to navigate the complexities of the financial world and achieve unparalleled success in meeting both current and future challenges.

Managing Complexity with Precision
Modern investment portfolios often encompass diverse asset classes, derivatives, and sophisticated financial instruments. Traditional spreadsheets are inadequate for handling this complexity, often leading to costly errors.
Advanced asset and investment management platforms provide real-time data integration, detailed analytics, and intuitive visualization tools. These capabilities enable portfolio managers to make precise, informed decisions and minimize risk effectively.
Meeting Growing Regulatory Demands
Regulatory frameworks in the financial sector are becoming more stringent. Ensuring compliance manually can be time-intensive and prone to errors. Tech platforms simplify compliance by automating reporting, maintaining audit trails, and ensuring adherence to regulatory standards.
This automation not only reduces administrative burdens but also mitigates the risk of non-compliance, protecting both financial stability and reputation.
Enhancing Client Engagement and Retention
Client expectations have transformed in the digital age. They now demand personalized service, real-time updates, and comprehensive performance reports. Delivering on these expectations requires advanced tools.
Tech platforms enable portfolio managers to provide dynamic dashboards, customizable reports, and proactive communication. These features foster trust, enhance client satisfaction, and contribute to long-term client retention.

Driving Data-Driven Decision Making
The era of big data has ushered in a wealth of information, from market trends to predictive analytics. However, deriving actionable insights from this data requires advanced tools.
Portfolio management software equipped with AI and machine learning algorithms helps identify trends, forecast risks, and optimize portfolio strategies. This capability is invaluable in building a competitive edge.
Boosting Operational Efficiency
Manual processes are not only slow but also prone to inefficiencies and bottlenecks. In portfolio management, even minor delays can lead to missed opportunities or higher costs.
Automation through technology platforms reduces time spent on routine tasks such as trade execution, rebalancing, and reporting. This allows managers to focus on strategic decisions that enhance portfolio performance and profitability.
Preparing for the Future
As the financial sector embraces digital transformation, portfolio managers must future-proof their operations. Tech platforms offer scalability, adaptability, and innovation to meet emerging challenges and opportunities.
By adopting the right technology today, portfolio managers can ensure they remain at the forefront of tomorrow’s industry.
Genesis: A Revolutionary Tech Platform for Portfolio Managers

While the benefits of tech platforms are evident, not all solutions are created equal. This is where Genesis stands out as a leader.
Genesis is an advanced, cloud-based asset management platform designed to address the unique needs of modern portfolio managers. Its features include:
Real-Time Data Integration: Provides a unified view of portfolios by connecting multiple data sources.
Scalable Infrastructure: Accommodates growth and adapts to changing market conditions.
Regulatory Compliance Automation: Reduces complexity with built-in compliance tools.
User-Friendly Interface: Simplifies operations for both managers and clients.
AI-Powered Insights: Delivers actionable analytics for better decision-making.
Discover how Genesis can transform your portfolio management strategy. Learn more about its unique capabilities on our Asset Management page or explore its applications in Wealth Management.
Conclusion
The need for technology in portfolio management has never been greater. From managing complexity and ensuring compliance to enhancing client engagement and driving efficiency, tech platforms are indispensable.
With its innovative features and unparalleled flexibility, Genesis provides portfolio managers with the tools needed to thrive in an increasingly competitive market. Future-proof your operations today with Genesis and redefine what’s possible in portfolio management.
Call Us: +91 9650900223
Visit Our Website: www.novelpatterns.com
Mail Us: [email protected]
#cart#fintech#novel patterns#account aggregator#bfsi#myconcall#credit underwriting#finance#wealth management#genesis#Assest Management#Bank Statement#Bank Statement Analyser#Bank Statement Analyzer#SAAS#portfolio management#Funds#stock management#mutual funds
2 notes
·
View notes
Text
Revolutionizing B2B Sales: Advanced Outbound Lead Generation Strategies for the Digital Era
The Changing Landscape of Business Development
In today's hyper-connected world, traditional sales approaches are becoming obsolete. Successful businesses are reimagining outbound lead generation as a strategic, data-driven process.
Core Principles of Modern Outbound Lead Generation
Transformative Approach
Intelligence-driven targeting
Precision communication
Value-centric engagement
Relationship-first methodology
Strategic Frameworks for Success
Intelligent Prospect Identification
Advanced market segmentation
Predictive buyer persona development
Deep competitive intelligence
Behavioral pattern analysis
Precision Targeting Techniques
Account-based marketing strategies
Micro-targeted communication
Contextual engagement models
Personalization at scale
Technology: The Competitive Differentiator
Cutting-Edge Tools
AI-powered lead scoring
Machine learning algorithms
Sophisticated CRM integrations
Automated outreach platforms
Real-time analytics dashboards
Communication Mastery
Engagement Strategies
Hyper-personalized messaging
Value proposition alignment
Pain point addressing
Storytelling in communication
Minimal friction approach
Sales Enablement Techniques
Content-Driven Approach
Thought leadership development
Educational content strategies
Trust-building resources
Industry insights sharing
Psychological Engagement
Emotional intelligence in sales
Trust acceleration techniques
Authentic relationship building
Consultative selling mindset
Performance Measurement
Critical Metrics
Conversion rate optimization
Lead quality scoring
Customer acquisition cost
Sales cycle acceleration
Pipeline velocity
Advanced Technological Integration
Predictive analytics
Natural language processing
Conversational intelligence
Automated follow-up systems
Cross-platform tracking
Overcoming Common Challenges
Breaking through noise
Avoiding generic approaches
Managing rejection
Maintaining consistent engagement
Continuous learning and adaptation
Future-Proofing Sales Strategies
Emerging Trends
AI-augmented selling
Hyper-personalization
Predictive engagement models
Integrated multi-channel approaches
Conclusion
Successful outbound lead generation is an art and science of strategic, technology-enabled, human-centric approach.
Innovate. Connect. Grow.
2 notes
·
View notes
Text
Maximizing Ecommerce Success: A Comprehensive Guide to Key Performance Indicators (KPIs)

Introduction
In the dynamic landscape of online retail, performance metrics are the compass guiding businesses toward success. Key Performance Indicators (KPIs) serve as crucial milestones, directing ecommerce entrepreneurs to navigate the complex realm of sales, marketing, and customer service. In this comprehensive guide, we at RMRKBL Marketing delve into the intricate world of KPIs, offering profound insights to empower your business decisions and drive unparalleled growth.
Unveiling the Essence of Performance Indicators
A performance indicator, a beacon in the data-driven journey, is a quantifiable measurement aligning with specific goals. Picture an online retailer aspiring to boost site traffic by 50% in the next year – a noble ambition. Key indicators could include daily unique visitors, traffic sources (paid advertising, SEO, brand advertising), or the holy grail of customer lifetime value.
Decoding Key Performance Indicators
Amidst a plethora of potential metrics, the crux lies in identifying key performance indicators (KPIs) – impactful data points succinctly reflecting progress toward defined goals. In this pursuit, Shopify's robust reporting and analytics emerge as invaluable tools, boasting over 60 pre-built dashboards to illuminate trends and catalyze informed decision-making.
The Significance of KPIs
Why are KPIs as vital as strategy and goal setting? They transcend mere statistics, offering actionable insights that propel strategic decision-making. Without KPIs, businesses risk navigating uncharted waters, relying on intuition rather than data-driven precision. Harnessing KPIs fosters a deeper understanding of your business and clientele, fostering informed strategies for online sales growth.
Classifying Key Performance Indicators
KPIs, versatile in nature, span qualitative, quantitative, predictive, and historical dimensions, permeating various business operations. In the ecommerce domain, KPIs elegantly align with five core categories: Sales, Marketing, Customer Service, Manufacturing, and Project Management.
Sales: A Symphony of Success
In the realm of sales, mastering KPIs is akin to orchestrating a symphony of success. Ecommerce retailers can fine-tune their performance through vigilant tracking of crucial metrics such as total sales, average order
size, gross profit, average margin, and more. Each metric unveils a facet of your business, from understanding customer behavior through conversion rates and shopping cart abandonment rates to strategic insights on product affinity and competitive pricing.
Unlocking Sales KPIs
1. Total Sales
Ecommerce success hinges on understanding sales patterns. Monitor sales on an hourly, daily, weekly, monthly, quarterly, and yearly basis to discern trends and capitalize on peak periods.
2. Average Order Size
Delve into customer spending habits with the average order size, a pivotal KPI reflecting the typical expenditure per order. This insight informs pricing strategies and product bundling opportunities.
3. Gross Profit
Measure business efficiency by calculating gross profit – the difference between total sales and the cost of goods sold. A nuanced understanding ensures profitability and strategic decision-making.
4. Conversion Rate
Efficiency in converting visitors to customers is paramount. The conversion rate, expressed as a percentage, illuminates the success of your ecommerce site in turning visitors into buyers.
5. Customer Lifetime Value (CLV)
The heartbeat of sustainable growth lies in the customer lifetime value. Nurture long-term relationships by understanding how much a customer contributes over their engagement with your brand.
6. Revenue per Visitor (RPV)
Evaluate the effectiveness of your site in converting visitors into revenue. Low RPV prompts a deep dive into analytics, optimizing the user experience to drive more online sales.
7. Customer Acquisition Cost (CAC)
Strategically invest in customer acquisition by deciphering the cost of acquiring new customers. Analyze marketing spend breakdown to ensure efficient customer acquisition.
8. Inventory Levels
Maintain optimal stock levels by closely monitoring inventory metrics. Insights into stock turnover, product velocity, and sitting stock guide inventory management strategies.
9. Competitive Pricing
Benchmark against competitors by scrutinizing pricing strategies. An agile approach to pricing ensures your business remains competitive and attuned to market dynamics.
10. Product Affinity
Uncover cross-promotion opportunities through product affinity analysis. Identify products frequently purchased together, fueling targeted marketing strategies.
11. Product Relationship
Strategically plan cross-selling tactics by understanding which products are viewed consecutively. Leverage this KPI to enhance product recommendations and elevate user experience.
12. Churn Rate
Customer retention is paramount. The churn rate reveals how swiftly customers are departing. Swift action can mitigate losses and foster sustained loyalty.
13. Cost per Click (CPC)
For paid advertising success, track the cost incurred for each click. Optimize ad campaigns by aligning CPC with conversion rates, ensuring a balanced marketing budget.
Marketing Mastery: Unleashing Potency Through KPIs
Marketing KPIs wield immense power in sculpting the success story of your ecommerce venture. From driving website traffic to deciphering customer behavior, these metrics guide strategic marketing endeavors.
Navigating Marketing KPIs
1. Website Traffic
Website traffic serves as the heartbeat of ecommerce success. Monitor the total number of visits to your site, interpreting trends and refining marketing strategies accordingly.
2. New Visitors vs. Returning Visitors
Distinguish between first-time visitors and returning patrons. This insight aids in assessing the efficacy of digital marketing campaigns and tailoring strategies for diverse audiences.
3. Time on Site
Evaluate user engagement by analyzing the time visitors spend on your website. A deeper engagement with blog content and landing pages signals brand affinity.
4. Bounce Rate
High bounce rates demand attention. Investigate the reasons behind visitors exiting after viewing a single page, optimizing user experience and content relevance.
5. Page Views per Visit
Navigate user journeys by understanding the average number of pages viewed during each visit. Balance engagement with ease of navigation to enhance the user experience.
6. Average Session Duration
Dive into user behavior with the average session duration. Longer durations indicate profound interactions with your site, particularly with blog content and landing pages.
7. Traffic Source
Decipher the origins of website traffic through the traffic source KPI. Channel-specific insights guide focused marketing efforts, whether from organic search, paid ads, or social media.
8. Mobile Site Traffic
Optimize for mobile success by monitoring the influx of users accessing your store via mobile devices. A mobile-friendly site ensures a seamless experience for a diverse audience.
9. Newsletter Subscribers
Harness the potential of email marketing by tracking newsletter subscribers. Analyze demographics to tailor content and maximize reach, ensuring alignment with target audiences.
10. Email Open Rate
Elevate email marketing effectiveness by scrutinizing the percentage of subscribers opening your emails. Test subject lines and maintain list hygiene for optimal engagement.
11. Email Click-Through Rate (CTR)
Drive traffic to your site with a high email click-through rate. This KPI measures the percentage of subscribers clicking on links, a pivotal factor in conversion success.
12. Social Followers and Fans
Measure brand loyalty and awareness through social media metrics. The number of followers and fans on platforms like Facebook, Instagram, and Twitter signifies audience engagement.
13. Return on Ad Spend (ROAS)
Evaluate ad campaign efficacy by gauging the revenue earned for every dollar spent on advertising. ROAS serves as a compass, steering advertising strategies toward profitability.
14. Cost per Click (CPC)
Unveil the cost incurred for each click on paid ads. Efficiently manage marketing budgets by aligning CPC with conversion rates, ensuring optimal returns on investment.
15. Social Media Engagement
Quantify brand engagement with social media followers through the social media engagement KPI. Active interaction signals a vibrant community and potent brand-consumer connections.
16. Clicks
Track the total number of clicks across various platforms – website, social media, email, and ads. A holistic perspective aids in refining content and optimizing engagement strategies.
17. Average Click-Through Rate (CTR)
Measure user engagement with the average click-through rate, revealing the percentage of users clicking on links. Optimize content placement and messaging for heightened effectiveness.
18. Average Position
Ascend the search engine ranks with insights from the average position KPI. Understand your site's SEO and paid search performance, striving for the coveted top position.
19. Pay-Per-Click (PPC) Traffic Volume
Evaluate the success of PPC campaigns by tracking traffic volume. Strategic adjustments based on PPC insights ensure targeted traffic influx to your site.
20. Blog Traffic
Uncover the impact of blog content by isolating blog traffic metrics. Compare blog traffic against overall site traffic for a nuanced understanding of content effectiveness.
21. Number and Quality of Product Reviews
Harness the power of social proof with product reviews. Track quantity and content to leverage customer feedback for SEO, brand credibility, and business refinement.
22. Banner or Display Advertising CTRs
Optimize banner and display ad performance by scrutinizing click-through rates. Insights into copy, imagery, and offer effectiveness guide strategic adjustments for enhanced engagement.
23. Affiliate Performance Rates
Leverage affiliate marketing with insights into performance rates. Identify successful channels, refining strategies to maximize the impact of affiliate partnerships.
Elevating Customer Service through KPI Excellence
Customer service KPIs stand as sentinels, guarding the gateway to customer satisfaction. Scrutinize these metrics to ensure your support teams exceed expectations and cultivate lasting customer relationships.
Pioneering Customer Service KPIs
1. Customer Satisfaction Score (CSAT)
Quantify customer satisfaction through the CSAT metric. Harness customer feedback to refine service strategies and foster a positive brand perception.
2. Net Promoter Score (NPS)
Measure customer loyalty with the Net Promoter Score. Identify brand advocates and detractors, directing efforts toward building a robust community of brand enthusiasts.
3. First Response Time
Efficient customer service hinges on swift responses. Monitor the time taken for the first response to gauge support team efficacy and ensure timely issue resolution.
4. Ticket Resolution Time
Expedite issue resolution by scrutinizing ticket resolution times. Streamline support processes based on these insights to enhance customer satisfaction.
5. Customer Retention Rate
A flourishing business thrives on customer retention. The retention rate KPI illuminates the success of your efforts in cultivating lasting relationships with clients.
6. Customer Complaint Resolution
Transform challenges into opportunities by mastering customer complaint resolution. Evaluate resolution times and customer feedback to fortify your support ecosystem.
7. Service Level Agreement (SLA) Adherence
Set and surpass customer expectations with SLA adherence. Track the percentage of support requests meeting agreed-upon response and resolution times.
8. Customer Effort Score (CES)
Simplify customer interactions with the Customer Effort Score. Minimize friction in customer journeys, fostering seamless and enjoyable experiences.
9. Contact Volume
Analyze contact volume to understand support team workload. Proactive adjustments to staffing and resources ensure consistent service excellence.
10. Customer Service Channel Performance
Decipher the effectiveness of various customer service channels – live chat, email, phone. Optimize resource allocation based on channel performance to maximize customer satisfaction.
11. Agent Performance
Empower support teams through insights into agent performance. Identify top performers and areas for improvement, ensuring a high standard of service across the board.
Conclusion: Mastering the Art of KPIs for Ecommerce Triumph
In the intricate tapestry of ecommerce success, KPIs serve as the warp and weft, weaving a narrative of progress and prosperity. Unleash the potential of your online venture by embracing the nuanced insights offered by sales, marketing, and customer service KPIs. Propel your business forward, navigate challenges, and sculpt a legacy of unparalleled success in the competitive realm of online retail.
FAQs
Why are KPIs crucial for ecommerce success?
KPIs, or Key Performance Indicators, provide quantifiable insights into the performance of various aspects of your ecommerce business. They guide strategic decision-making, enhance customer experiences, and drive overall success by aligning actions with specific goals.
How can I use KPIs to improve my online sales?
Analyzing sales KPIs such as total sales, average order size, conversion rate, and customer lifetime value empowers you to optimize pricing strategies, understand customer behavior, and implement targeted marketing efforts for increased online sales.
What role do marketing KPIs play in ecommerce?
Marketing KPIs, including website traffic, engagement metrics, and return on ad spend, offer actionable insights into the effectiveness of your marketing efforts. These metrics help refine strategies, boost brand awareness, and drive targeted traffic to your ecommerce site.
How do customer service KPIs contribute to business growth?
Customer service KPIs, such as customer satisfaction scores, first response time, and ticket resolution time, play a pivotal role in fostering positive customer relationships. Meeting and exceeding customer expectations leads to increased loyalty, positive word-of-mouth, and sustained business growth.
Can KPIs really help in inventory management?
Absolutely. Sales KPIs related to inventory levels, product affinity, and competitive pricing provide crucial insights into stock turnover, product popularity, and market competitiveness. Effectively managing inventory based on these KPIs ensures optimal stock levels and minimizes wastage.
Are there specific KPIs for evaluating the success of PPC campaigns?
Yes, monitoring KPIs such as pay-per-click (PPC) traffic volume, cost per click (CPC), and return on ad spend (ROAS) provides a comprehensive view of your PPC campaign performance. These metrics help optimize ad budgets, refine targeting, and maximize the impact of your advertising efforts.
Can KPIs help me understand the effectiveness of my social media marketing?
Certainly. Social media KPIs like social followers, engagement metrics, and click-through rates provide insights into the impact of your social media efforts. Understanding these metrics enables you to refine content strategies, build brand loyalty, and expand your social media presence.
How often should I review and update my KPIs?
Regular reviews are crucial to adapt to changing market dynamics. Consider monthly reviews for short-term KPIs and quarterly or annually for long-term goals. Adjust KPIs based on business priorities, industry trends, and the evolving needs of your ecommerce venture.
#digital marketing#e-commerce#localbusiness#marketing#seo#seo agency#seo company#local#seo expert#kpi#kpi metrics
9 notes
·
View notes