#robust statistical methods
Explore tagged Tumblr posts
Visit Tumblr Blog
Explore Tumblr blogs with no restrictions, modern design and the best experience.
Last Seen Tumblr Blogs


Fun Fact
China blocked Tumblr because of pornography and censorship problems in 2013.
Text
If you read about the anatomy of sponges they are so much simpler and... "single-celled adjacent" than comb jellies. It's like obvious they're older. I mean obviously simpler=/=older but it's the way that they're simpler which makes them seem older. Anyway. IIRC the main bit of research which suggests comb jellies are more basal is computational phylogenetics, which... look, biology isn't lucky enough to have regular sound change and a comparably robust comparative method like linguistics, and computational phylogenetics is much more underdeveloped in linguistics, etc. etc. etc. But my intuition is very much "if your statistical algorithm says one thing and comparative analysis overwhelmingly points in the other direction, trust the comparative analysis." But, look, I don't know. Maybe my intuitions aren't tuned to biology, or maybe there's other evidence that comb jellies are more basal, idk.
57 notes
·
View notes
Note
because you mentioned research, do you have any advice or methods of doing efficient research? I enjoy research too but it always takes me such a long time to filter out the information I actually need that I often lose my momentum ;__;
I'm not sure if I'm the best resource for this; I'm so dogged that once I start, it's hard for me to stop. The more tangled or difficult a research question, the more engaging I find it. In addition to loving cats, part of why I have cats is because they are very routine-oriented, and they'll pull me out of my hyperfocus for meals and sleep if I become too caught in what I'm researching; otherwise I don't notice I'm hungry or exhausted. It's not uncommon for me to focus so intensely that I'll look up and suddenly realize I've been researching something for 8+ hours.
But, in general, while it depends on what you're researching, I recommend having an expansive toolkit of resources. Google is fine, but it's only one index of many. I also use other databases and indexes like JSTOR, ResearchGate, SSRN, and Google Scholar (which is helpful for navigating Proquest, too, since Proquest's search function is incompetent). I also use DuckDuckGo, which is infinitely better for privacy than Google and which doesn't filter your searches or tailor them based on your location and search history, so you receive more robust results and significantly fewer ads (this has a tradeoff, which is that sometimes the searches are less precise).
Sometimes, I use Perplexity, but I do not recommend using Perplexity unless you are willing to thoroughly review the sources linked in its results because, like any generative AI tool, it relies on statistical probability to synthesize a representation of the information. In other words, it's not a tool for precision, and you should never rely on generated summaries, but it can help pluck and isolate resources that search indexes aren't dredging for you.
I also rely on print resources, and I enjoy collecting physical books. For books, I use Amazon to search for titles, but also Bookshop.org, e-Bay, Thriftbooks, AbeBooks, Common Crow Books, Paperback Swap, Biblio, and university presses (my favorite being the University of Hawaii Press, especially its On Sale page, and the Harvard East Asian Monographs series from Harvard University Press). This is how I both find titles that may seem interesting (by searching keywords and seeing what comes up) and also how I shop around for affordable and used versions of the books I would like to purchase. (If you don't want to buy books, local and online libraries and the Internet Archive are great resources.)
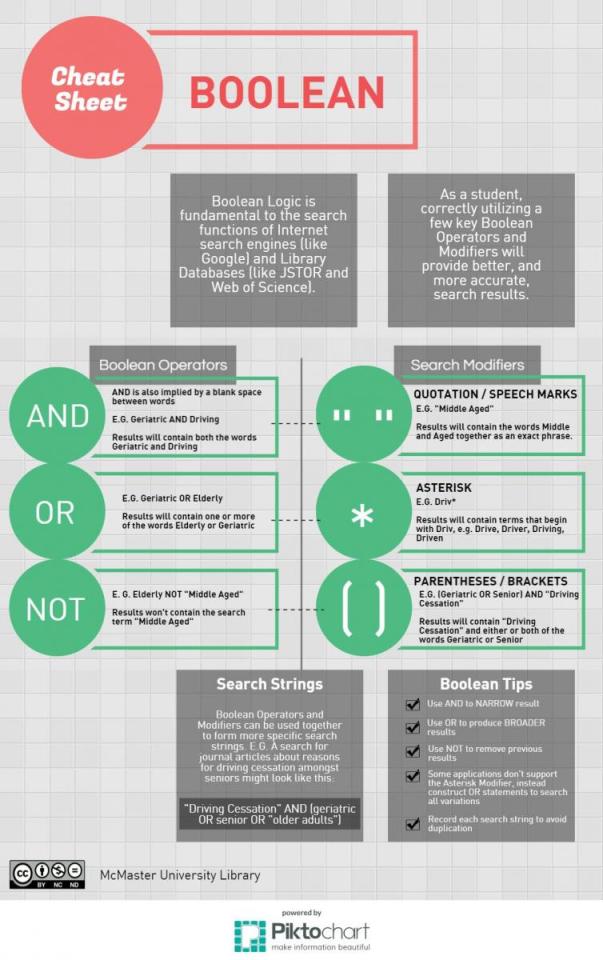
Most relevantly, and I assume most people might already know this, but I can't emphasize its importance enough: use Boolean logic. If you are not using operators and modifiers in your search strings, you are going to have immense difficulty filtering any relevant information from indexes.
8 notes
·
View notes
Text

In the search for life on exoplanets, finding nothing is something too
What if humanity's search for life on other planets returns no hits? A team of researchers led by Dr. Daniel Angerhausen, a Physicist in Professor Sascha Quanz's Exoplanets and Habitability Group at ETH Zurich and a SETI Institute affiliate, tackled this question by considering what could be learned about life in the universe if future surveys detect no signs of life on other planets. The study, which has just been published in The Astronomical Journal and was carried out within the framework of the Swiss National Centre of Competence in Research, PlanetS, relies on a Bayesian statistical analysis to establish the minimum number of exoplanets that should be observed to obtain meaningful answers about the frequency of potentially inhabited worlds.
Accounting for uncertainty
The study concludes that if scientists were to examine 40 to 80 exoplanets and find a "perfect" no-detection outcome, they could confidently conclude that fewer than 10 to 20 percent of similar planets harbour life. In the Milky Way, this 10 percent would correspond to about 10 billion potentially inhabited planets. This type of finding would enable researchers to put a meaningful upper limit on the prevalence of life in the universe, an estimate that has, so far, remained out of reach.
There is, however, a relevant catch in that ‘perfect’ null result: Every observation comes with a certain level of uncertainty, so it's important to understand how this affects the robustness of the conclusions that may be drawn from the data. Uncertainties in individual exoplanet observations take different forms: Interpretation uncertainty is linked to false negatives, which may correspond to missing a biosignature and mislabeling a world as uninhabited, whereas so-called sample uncertainty introduces biases in the observed samples. For example, if unrepresentative planets are included even though they fail to have certain agreed-upon requirements for the presence of life.
Asking the right questions
"It's not just about how many planets we observe – it's about asking the right questions and how confident we can be in seeing or not seeing what we're searching for," says Angerhausen. "If we're not careful and are overconfident in our abilities to identify life, even a large survey could lead to misleading results."
Such considerations are highly relevant to upcoming missions such as the international Large Interferometer for Exoplanets (LIFE) mission led by ETH Zurich. The goal of LIFE is to probe dozens of exoplanets similar in mass, radius, and temperature to Earth by studying their atmospheres for signs of water, oxygen, and even more complex biosignatures. According to Angerhausen and collaborators, the good news is that the planned number of observations will be large enough to draw significant conclusions about the prevalence of life in Earth's galactic neighbourhood.
Still, the study stresses that even advanced instruments require careful accounting and quantification of uncertainties and biases to ensure that outcomes are statistically meaningful. To address sample uncertainty, for instance, the authors point out that specific and measurable questions such as, "Which fraction of rocky planets in a solar system's habitable zone show clear signs of water vapor, oxygen, and methane?" are preferable to the far more ambiguous, "How many planets have life?"
The influence of previous knowledge
Angerhausen and colleagues also studied how assumed previous knowledge – called a prior in Bayesian statistics – about given observation variables will affect the results of future surveys. For this purpose, they compared the outcomes of the Bayesian framework with those given by a different method, known as the Frequentist approach, which does not feature priors. For the kind of sample size targeted by missions like LIFE, the influence of chosen priors on the results of the Bayesian analysis is found to be limited and, in this scenario, the two frameworks yield comparable results.
"In applied science, Bayesian and Frequentist statistics are sometimes interpreted as two competing schools of thought. As a statistician, I like to treat them as alternative and complementary ways to understand the world and interpret probabilities," says co-author Emily Garvin, who's currently a PhD student in Quanz' group. Garvin focussed on the Frequentist analysis that helped to corroborate the team's results and to verify their approach and assumptions. "Slight variations in a survey's scientific goals may require different statistical methods to provide a reliable and precise answer," notes Garvin. "We wanted to show how distinct approaches provide a complementary understanding of the same dataset, and in this way present a roadmap for adopting different frameworks."
Finding signs of life could change everything
This work shows why it's so important to formulate the right research questions, to choose the appropriate methodology and to implement careful sampling designs for a reliable statistical interpretation of a study's outcome. "A single positive detection would change everything," says Angerhausen, "but even if we don't find life, we'll be able to quantify how rare – or common – planets with detectable biosignatures really might be."
IMAGE: The first Earth-size planet orbiting a star in the “habitable zone” — the range of distance from a star where liquid water might pool on the surface of an orbiting planet. Credit NASA Ames/SETI Institute/JPL-Caltech
4 notes
·
View notes
Text
Archaeoacoustics and 'Songs of the Caves'

Archaeoacoustics is a sub-field of archaeology and acoustics which studies the relationship between people and sound throughout history. It is an interdisciplinary field with methodological contributions from acoustics, archaeology, and computer simulation, and is broadly related to topics within cultural anthropology such as experimental archaeology and ethnomusicology. Since many cultures have sonic components, applying acoustical methods to the study of archaeological sites and artifacts may reveal new information on the civilizations examined.
The importance of sound in ritual practice is well attested by historical and anthropological evidence. Voices and instruments (pipes, drums) will also have played a key role for prehistoric societies, and a number of studies have sought to demonstrate that by measuring the acoustical properties of archaeological spaces and open-air locations. One of the principal difficulties, however, is to establish a robust methodology. Every space or location will have an acoustic signature, but that does not imply that vocal or musical performance was an essential part of ritual practice; nor that those places were specially designed or selected for their acoustical properties.
Palaeolithic painted caves have occupied a special place in this debate since studies in the 1980s suggested that the placement of paintings and murals within the caves might have been guided by the acoustics; that they might be directly correlated with resonance. In 2013, Durham University (Durham, England) archaeologist Chris Scarre joined a team of acousticians, archaeologists and musicians led by Professor Rupert Till (Huddersfield University) in a systematic on-site analysis of acoustic properties and prehistoric motifs in five Upper Palaeolithic painted caves in northern Spain: La Garma, El Castillo, La Pasiega, Las Chimeneas and Tito Bustillo. The Arts and Humanities Research Council funded project was supported by Spanish colleagues Manuel Rojo-Guerra and Roberto Ontañon, with permission from the Gobierno de Cantabria and Gobierno Del Principado de Asturias.
Their methodology in recording the acoustics of these caves was to use a swept-sine (also called a chirp) source signal in conjunction with a set of microphones, adjusting the position of the set-up to provide an overview of the acoustics of specific sections of the caves. In each location that was measured, the position of imagery on the cave walls was also recorded. The fieldwork generated a large body of data that was used to generate acoustic maps of the five caves that could be compared with the distribution of the imagery (paintings or engravings, representational images of animals, or abstract symbols). A Principal Components Analysis (a mathematical method used to reduce a large data set into a smaller one while maintaining most of its variation information) provided an averaged set of acoustical characteristics. This showed that the variance of the acoustic data can be explained by two main components, associated with (a) temporal decay of energy (rate at which it fades to silence) in the cave space and (b) the existence or absence of resonance. Other factors, such as the distance of motifs from the original cave entrances (some of them now blocked) were also recorded.
Statistical analysis concluded that motifs in general, and lines and dots in particular, are statistically more likely to be found in places where reverberation is moderate and where the low frequency acoustic response has evidence of resonant behavior. The results suggest that the location of Palaeolithic motifs might indeed be associated with acoustic features, and that an appreciation of sound could have influenced behavior among Palaeolithic societies using these caves. The study also demonstrated the application of a systematic methodology of recording and analysis to the archaeoacoustics of prehistoric spaces.
11 notes
·
View notes
Text
Unlock the Power of Data Analysis with STAT Data Modeling Software - LabDeck's Stat Studio
In today's data-driven world, having the right tools to analyze and interpret vast amounts of data is essential for researchers, data scientists, and analysts. LabDeck’s Stat Studio stands out as a premier STAT Data Modeling Software, designed to meet the diverse needs of professionals who work with complex datasets. This robust software offers an intuitive interface combined with powerful analytical features, enabling users to perform advanced statistical modeling with ease.
Why Choose Stat Studio for Your Data Analysis Needs?
Stat Studio is more than just another statistical software; it's an all-in-one solution that helps you unlock deeper insights from your data. Here's why it's a top choice for anyone looking to elevate their data modeling capabilities:
1. Advanced Regression Analysis
One of Stat Studio's most powerful features is its regression analysis toolset. Whether you are performing basic linear regression or more complex methods, Stat Studio gives you the flexibility to choose the right model for your data. Key statistical measures, such as Mean Squared Error (MSE) and R-squared values, are automatically calculated and displayed, providing instant insight into your model's performance. This makes it easy to interpret relationships between variables, ensuring accurate and reliable results.
2. Comprehensive Data Handling
Stat Studio excels in data handling by supporting a wide range of file formats and data sources. With its flexible import options, users can seamlessly integrate and analyze datasets from various origins. Whether your data comes from spreadsheets, databases, or other statistical software, Stat Studio ensures that you can work with it efficiently.
3. Customizable Visualizations
Data visualization is an integral part of any analysis, and Stat Studio’s advanced plotting capabilities make it simple to create professional-grade charts and graphs. Users can easily generate scatter plots, line graphs, bar charts, and more, with a full range of customizable options like marker styles, line types, and color schemes. Additionally, the software allows you to overlay regression lines and add trend lines, giving your visualizations deeper analytical value.
4. Tailored Analysis and Presentation
Customization doesn’t end with visuals. Stat Studio offers extensive options to tailor every aspect of your analysis to meet specific presentation or publication requirements. You can adjust parameters for data scaling, clean your datasets, and fine-tune the presentation of your results to suit your audience, whether you are presenting to a boardroom or preparing for publication.
Advanced Features for Complex Analyses
For users who require more than just basic analysis, Stat Studio offers an array of advanced features. A dedicated “Tests” tab hints at the software’s ability to run a wide variety of statistical tests, including hypothesis testing, ANOVA, and more. These features make Stat Studio a versatile tool for users in fields like academia, market research, healthcare, and beyond.
Additionally, the software includes tools for data cleaning and scaling, which are essential for preparing large and complex datasets for accurate analysis. These pre-processing steps ensure that your data is ready for in-depth statistical modeling, leading to more reliable and meaningful results.
Conclusion: Empower Your Data with LabDeck's Stat Studio
LabDeck’s Stat Studio offers a complete package for anyone looking to perform STAT Data Modeling software. With its combination of advanced analysis features, flexible data handling, and customizable visualization options, Stat Studio is a powerful tool for both novice and experienced statisticians alike. Whether you're conducting regression analysis, creating intricate data visualizations, or preparing your data for publication, Stat Studio provides the precision, efficiency, and versatility you need to succeed.
To learn more about how Stat Studio can revolutionize your data analysis process, visit the official page here.
Embrace the power of Stat Studio and take your data modeling to new heights!
2 notes
·
View notes
Text
Mastering Panel Data Analysis in STATA: A Comprehensive Guide
In the realm of statistical analysis, STATA stands out as a powerful tool for unraveling complex datasets and deriving meaningful insights. One area where STATA excels is in panel data analysis, a technique frequently employed in econometrics and social sciences to explore trends over time and across different entities. If you've ever found yourself pondering the request, "write my STATA homework," rest assured that this comprehensive guide will not only tackle a challenging question related to STATA but will also provide a detailed answer, showcasing the prowess of the xtreg command. We'll navigate the intricacies of estimating the impact of a policy change on GDP per capita, incorporating fixed effects, time effects, and a covariate named "Investment." Whether you're a student seeking homework assistance or a researcher eager to unlock the full potential of STATA, this guide is tailored for you. Let's embark on a journey to master panel data analysis in STATA together.
Understanding the Challenge The question at hand revolves around conducting a panel data analysis using STATA, with a dataset encompassing three key variables: "Country," "Year," and "GDP_Per_Capita." The task involves estimating the impact of a policy change on GDP per capita, considering fixed effects for each country, time effects, and controlling for the potential influence of the covariate "Investment."
Constructing the Regression Model To tackle this challenge, we turn to the versatile xtreg command in STATA. Let's break down the command and understand each component:
stata // Load your dataset use "your_dataset.dta", clear
// Specify the regression model with fixed effects for countries and time effects xtreg GDP_Per_Capita Investment i.Country##i.Year, fe Loading the Dataset: The use command loads the dataset into STATA, replacing any existing data. Replace "your_dataset.dta" with the actual name of your dataset.
Dependent Variable: GDP_Per_Capita is the variable we want to analyze, representing the outcome of interest.
Control Variable: Investment is included to control for its potential influence on the dependent variable.
Fixed Effects and Time Effects: The i.Country##i.Year part of the command includes fixed effects for both countries and time effects. The double hash (##) indicates the inclusion of interaction terms between countries and years.
Estimation Method: The fe option specifies fixed effects estimation.
Rationale Behind the Model Fixed Effects: Including fixed effects for countries helps control for unobserved heterogeneity at the country level. Fixed effects for years account for time-invariant factors that might affect the dependent variable.
Interaction Terms: The interaction terms between countries and years allow for capturing time-varying effects that may differ across countries. This is crucial when dealing with panel data, where entities (countries, in this case) evolve over time.
Control Variable: Including "Investment" as a control variable ensures that we account for its potential impact on the dependent variable, isolating the effect of the policy change.
Practical Implications This regression model provides a robust framework for assessing the impact of a policy change on GDP per capita while considering various factors. The inclusion of fixed effects and time effects enhances the model's ability to isolate the specific effects of interest and control for confounding variables.
Conclusion Mastering panel data analysis in STATA requires a combination of understanding the theoretical underpinnings and practical application of the software. By addressing a complex question related to STATA and providing a detailed answer, we've explored the nuances of constructing a regression model for panel data analysis.
Whether you're a student grappling with econometric assignments or a researcher seeking to extract valuable insights from your data, the xtreg command in STATA proves to be a valuable ally. So, the next time you find yourself thinking, "write my STATA homework," remember that STATA's capabilities extend far beyond the surface, empowering you to unravel the intricacies of your datasets and draw meaningful conclusions. Happy analyzing! #STATA #DataAnalysis #Econometrics #WriteMySTATAHomework

12 notes
·
View notes
Text
The Ultimate Guide to ESG Investing: Strategies and Benefits
Socio-economic and environmental challenges can disrupt ecological, social, legal, and financial balance. Consequently, investors are increasingly adopting ESG investing strategies to enhance portfolio management and stock selection with a focus on sustainability. This guide delves into the key ESG investing strategies and their advantages for stakeholders.
What is ESG Investing?
ESG investing involves evaluating a company's environmental, social, and governance practices as part of due diligence. This approach helps investors gauge a company's alignment with humanitarian and sustainable development goals. Given the complex nature of various regional frameworks, enterprises and investors rely on ESG data and solutions to facilitate compliance auditing through advanced, scalable technologies.
Detailed ESG reports empower fund managers, financial advisors, government officials, institutions, and business leaders to benchmark and enhance a company's sustainability performance. Frameworks like the Global Reporting Initiative (GRI) utilize globally recognized criteria for this purpose.
However, ESG scoring methods, statistical techniques, and reporting formats vary significantly across consultants. Some use interactive graphical interfaces for company screening, while others produce detailed reports compatible with various data analysis and visualization tools.
ESG Investing and Compliance Strategies for Stakeholders
ESG Strategies for Investors
Investors should leverage the best tools and compliance monitoring systems to identify potentially unethical or socially harmful corporate activities. They can develop customized reporting views to avoid problematic companies and prioritize those that excel in ESG investing.
High-net-worth individuals (HNWIs) often invest in sustainability-focused exchange-traded funds that exclude sectors like weapon manufacturing, petroleum, and controversial industries. Others may perform peer analysis and benchmarking to compare businesses and verify their ESG ratings.
Today, investors fund initiatives in renewable energy, inclusive education, circular economy practices, and low-carbon businesses. With the rise of ESG databases and compliance auditing methods, optimizing ESG investing strategies has become more manageable.
Business Improvement Strategies
Companies aiming to attract ESG-centric investment should adopt strategies that enhance their sustainability compliance. Tracking ESG ratings with various technologies, participating in corporate social responsibility campaigns, and improving social impact through local development projects are vital steps.
Additional strategies include reducing resource consumption, using recyclable packaging, fostering a diverse workplace, and implementing robust cybersecurity measures to protect consumer data.
Encouraging ESG Adoption through Government Actions
Governments play a crucial role in educating investors and businesses about sustainability compliance based on international ESG frameworks. Balancing regional needs with long-term sustainability goals is essential for addressing multi-stakeholder interests.
For instance, while agriculture is vital for trade and food security, it can contribute to greenhouse gas emissions and resource consumption. Governments should promote green technologies to mitigate carbon risks and ensure efficient resource use.
Regulators can use ESG data and insights to offer tax incentives to compliant businesses and address discrepancies between sustainable development frameworks and regulations. These strategies can help attract foreign investments by highlighting the advantages of ESG-compliant companies.
Benefits of ESG Investing Strategies
Enhancing Supply Chain Resilience
The lack of standardization and governance can expose supply chains to various risks. ESG strategies help businesses and investors identify and address these challenges. Governance metrics in ESG audits can reveal unethical practices or high emissions among suppliers.
By utilizing ESG reports, organizations can choose more responsible suppliers, thereby enhancing supply chain resilience and finding sustainable companies with strong compliance records.
Increasing Stakeholder Trust in the Brand
Consumers and impact investors prefer companies that prioritize eco-friendly practices and inclusivity. Aligning operational standards with these expectations can boost brand awareness and trust.
Investors should guide companies in developing ESG-focused business intelligence and using valid sustainability metrics in marketing materials. This approach simplifies ESG reporting and ensures compliance with regulatory standards.
Optimizing Operations and Resource Planning
Unsafe or discriminatory workplaces can deter talented professionals. A company's social metrics are crucial for ESG investing enthusiasts who value a responsible work environment.
Integrating green technologies and maintaining strong governance practices improve operational efficiency, resource management, and overall profitability.
Conclusion
Global brands face increased scrutiny due to unethical practices, poor workplace conditions, and negative environmental impacts. However, investors can steer companies towards appreciating the benefits of ESG principles, strategies, and sustainability audits to future-proof their operations.
As the global focus shifts towards responsible consumption, production, and growth, ESG investing will continue to gain traction and drive positive change.
5 notes
·
View notes
Text
Decoding Time Series Analysis: Navigating Complex Numerical Challenges in Statistics Without the Fuss of Equations
Time Series Analysis stands as a robust and indispensable tool within the realm of statistics, providing us with the means to unveil intricate patterns and trends concealed within temporal data. In the course of this enlightening blog post, we shall embark on a comprehensive exploration of two demanding numerical questions at the graduate level. Our objective is to delve into the intricacies of dissecting time series data, all while steering clear of any daunting equations. So, fasten your analytical seatbelts as we journey through the rich landscape of these real-world problems, armed with the knowledge that will undoubtedly help with statistics assignment using R. Let's collectively hone our statistical acumen and confront these challenges head-on!
Question 1:
Consider a time series dataset representing the monthly sales of a product over the last three years. The sales data is as follows:
Year 1:
Month 1: 120 units
Month 2: 150 units
Month 3: 180 units
...
Month 12: 200 units
Year 2:
Month 13: 220 units
Month 14: 250 units
Month 15: 280 units
...
Month 24: 300 units
Year 3:
Month 25: 320 units
Month 26: 350 units
Month 27: 380 units
...
Month 36: 400 units
a) Calculate the moving average for a window size of 3 months for the entire time series.
b) Identify any seasonality patterns in the data and explain how they may impact sales forecasting.
c) Use a suitable decomposition method to break down the time series into its trend, seasonal, and residual components.
Answer:
a) Moving Average Calculation:
For Month 3, Moving Average = (120 + 150 + 180) / 3 = 150 units
For Month 4, Moving Average = (150 + 180 + 200) / 3 = 176.67 units
Continue this calculation for the entire time series.
b) Seasonality Patterns:
Seasonality can be observed by comparing the average sales for each month across the three years.
For example, if the average sales for January is consistently lower than other months, it indicates a seasonality pattern.
c) Decomposition:
Use a method such as additive or multiplicative decomposition to separate the time series into trend, seasonal, and residual components.
The trend component represents the overall direction of sales.
The seasonal component captures recurring patterns.
The residual component accounts for random fluctuations.
Question 2:
You are provided with a monthly time series dataset representing the stock prices of a company over the last five years. The stock prices are as follows:
Year 1: $50, $55, $60, $52, $48, ..., $58
Year 2: $60, $65, $70, $62, $58, ..., $68
Year 3: $70, $75, $80, $72, $68, ..., $78
Year 4: $80, $85, $90, $82, $78, ..., $88
Year 5: $90, $95, $100, $92, $88, ..., $98
a) Calculate the percentage change in stock prices from one year to the next.
b) Apply a suitable smoothing technique (e.g., exponential smoothing) to forecast the stock prices for the next three months.
c) Assess the stationarity of the time series and suggest any transformations needed for better forecasting.
Answer:
a) Percentage Change Calculation:
For Year 2, Percentage Change = [(Stock Price in Year 2 - Stock Price in Year 1) / Stock Price in Year 1] * 100
Repeat this calculation for the subsequent years.
b) Exponential Smoothing:
Use the exponential smoothing formula to forecast the stock prices for the next three months.
c) Stationarity Assessment:
Use statistical tests or visual inspection to assess stationarity.
If non-stationarity is detected, consider transformations such as differencing to achieve stationarity for better forecasting.
Conclusion:
As we conclude our exploration of these graduate-level time series analysis questions, we've unraveled the complexities of analyzing sales and stock price data. From moving averages to decomposition and from percentage change to exponential smoothing, these exercises showcase the versatility and power of time series analysis in extracting meaningful insights from temporal datasets. Armed with these skills, statisticians and data analysts can make informed predictions and contribute to sound decision-making in various fields. So, next time you encounter a time series conundrum, approach it with confidence and the analytical prowess gained from mastering these challenging questions.
#R Assignment Help#statistics assignment help#online assignment help#Education#university#academic success
7 notes
·
View notes
Text
Pinball Machine: Cloud-Connected Retro Sandbox Gameplay

Pinball Machines
Google cloud frequently take for granted how simple it is to link apps with a wide range of robust cloud services in today’s cloud-centric world. Nonetheless, integration remains difficult in a great number of legacy systems and other restricted situations.
When creating Backlogged Pinball, a unique pinball game that created as a demonstration for integrating cloud services in unusual locations, they took on this difficulty head-on. A real pinball machine called Backlogged Pinball can be connected to the cloud for a number of purposes, such as updating leaderboards and tracking information about finished and ongoing games.
In order to concentrate on game coding and cloud integration, built it on the foundation of a commercially available programmable pinball machine. The computer’s software environment was constrained, though, as it was using a sandboxed version of the.NET Framework 3.5, which was initially made available 17 years ago. In practice, this meant that were unable to install tools like gcloud to facilitate communication with the cloud and utilize any of the current Google cloud SDKs that were available for C#.
There’s a catch
It knew wanted to use the cloud for logging of game events and results, databases for high scores and game statistics, and a custom service to modify the game experience on the fly. However, creating software for such a limited setting came with a number of difficulties that you may be familiar with:
Limited library support: There are plenty of excellent libraries available to assist you in connecting to cloud services if you have complete control over your stack. However, there are instances when you are unable to choose where your software runs. Finding appropriate libraries to connect Google cloud pinball machine to the desired cloud services proved to be challenging.
For instance, they were aware that in order to power a real-time display of every event occurring in the game, needed to add entries into a Firestore database. Although Firestore has excellent SDKs, they were unable to handle anything prior to the 8.-year-old.NET Framework 4.6.2. Google could have been able to use a TCP connection to access a conventional relational database, but didn’t want to be restricted in Google cloud options for cloud services and tools. Building a real-time web application with MySQL instead of Firestore, which is built from the ground up to push data to the browser in real-time, is obviously far less viable.
Difficult deployment process: You may wish to add new features and cloud integrations, but updating your on-device software may be challenging due to various constraints. Google cloud had to use a USB stick to manually install every version of game while it was being developed because third-party developers. Testing, deploying, and shipping new versions of your code is slowed down by this type of restriction, which is never good. In a contemporary, adaptable cloud platform, adding new features is far simpler.
In essence, discovered that utilizing contemporary cloud services in an unpredictable legacy setting was difficult.
Flipper-ing the script
Initially, it seemed impossible to incorporate all of the services desired into the code that would operate on the pinball machine. However, what if there was an alternative? What if it gave the pinball machine a single simple integration and transformed it into a service? They might then arrange the outcomes in a contemporary cloud environment and have it send a message each time something occurred in the game.
Google cloud concluded that Pub/Sub would be a great approach to accomplish this. It offered a simple method of transferring data to the cloud via a single interface. It was really a simple HTTP POST with any message format desired.Image credit to Google cloud
It created a unique Pub/Sub messaging mechanism to accomplish this. To manage authentication and message delivery via the REST API, created a lightweight Pub/Sub framework just for the pinball machine. This made it incredibly simple to submit events anytime a player struck a target, fired a ball, or even pressed a flipper button. Visit GitHub to view a condensed version of that code!
Google cloud team processed these events in real time on the cloud side by using numerous Cloud Run subscribers. Additionally, stored data and powered visualizations using Firestore.
Jackpot! Benefits of the cloud
There were many benefits of pushing integration complexity into the cloud:
One interface: Authentication alone might be a blog entry in and of itself, so creating own Pub/Sub client was no easy feat. But when it was finished, it was finished! After it was operational, Google could concentrate on employing whichever contemporary client libraries and tools desired to process every event in the cloud.
Real-time updates: At Google Cloud Next, assisted users in creating custom Cloud Run services that can process pinball machine, send messages back to the machine, and receive them. You could theoretically alter the game while a friend was playing it because it took less than a minute to build and deploy these services!
Rich insights from data: In the end, they had a detailed record of every event that took place throughout a game. Playtest-based scoring adjustments and development-related troubleshooting were greatly aided by this.
Leaping ahead
The next version of Backlogged Pinball is already in the works, and it will include features hadn’t initially thought of. For instance, its’re including AI-driven Gameplay and player-style-based recommendations. Instead of struggling with dependencies on a historical system, nearly all of the work will be done in a contemporary cloud environment because of this adaptable cloud-based design.
Furthermore, any limited environment can benefit from the lessonsz learnt from this project. You can overcome the constraints of your environment and realize the full potential of the cloud by utilizing Pub/Sub messaging and embracing a cloud-first mindset, regardless matter whether it’s an embedded system, an Internet of Things device, or an outdated server running older software.
Read more on Govindhtech.com
#PinballMachine#Cloudcomputing#Gameplay#Sandbox#pinball#game#SDKs#RetroSandbox#News#Technews#Technology#Technologynews#Technologytrends#govindhtech
1 note
·
View note
Text
Top Challenges in the Market Research Industry

Market research serves as the backbone of informed decision-making in businesses, guiding strategies, product development, and customer engagement. However, like any industry, market research is not without its challenges. In this article, we explore some of the top challenges faced by professionals in the market research industry and strategies to overcome them.
Data Quality and Reliability: Ensuring the quality and reliability of data is paramount in market research. Issues such as incomplete responses, biased samples, and data inaccuracies can compromise the integrity of research findings. To address this challenge, researchers must employ robust data collection methods, implement validation checks, and utilize statistical techniques to identify and mitigate biases.
Sample Representation: Obtaining a representative sample that accurately reflects the target population can be challenging, especially in niche markets or industries. Biases in sampling methods, such as non-response bias or sampling frame errors, can lead to skewed results. Researchers must employ diverse sampling techniques, such as stratified sampling or quota sampling, to ensure adequate representation across demographic groups and minimize sampling biases.
Data Privacy and Compliance: With the increasing focus on data privacy regulations such as GDPR and CCPA, market researchers face challenges in collecting and handling sensitive consumer data. Ensuring compliance with data protection laws, obtaining informed consent from respondents, and implementing robust data security measures are essential to safeguarding consumer privacy and maintaining ethical research practices.
Technology Integration and Adaptation: The rapid evolution of technology presents both opportunities and challenges for market researchers. Adopting new research methodologies, leveraging advanced analytics tools, and harnessing emerging technologies such as artificial intelligence and machine learning require continuous learning and adaptation. Researchers must stay abreast of technological advancements and invest in training to harness the full potential of technology in market research.
Response Rate Decline: Declining response rates in surveys and research studies pose a significant challenge for market researchers. Factors such as survey fatigue, spam filters, and increasing competition for respondents' attention contribute to lower response rates. To combat this challenge, researchers must design engaging surveys, personalize communications, and incentivize participation to encourage higher response rates.
Big Data Management and Analysis: The proliferation of big data sources presents both opportunities and challenges for market researchers. Managing large volumes of data, integrating disparate data sources, and extracting actionable insights from complex datasets require advanced analytics capabilities and specialized expertise. Market researchers must leverage data visualization tools, predictive analytics, and data mining techniques to derive meaningful insights from big data and inform strategic decision-making.
Adapting to Market Dynamics: The dynamic nature of markets, consumer preferences, and industry trends poses a constant challenge for market researchers. Staying ahead of market shifts, identifying emerging opportunities, and predicting future trends require agility and foresight. Researchers must continuously monitor market dynamics, conduct regular market assessments, and employ agile research methodologies to adapt to changing market conditions and stay competitive.
In conclusion, while market research offers invaluable insights for businesses, it is not without its challenges. By addressing key challenges such as data quality, sample representation, technology integration, and response rate decline, market researchers can overcome obstacles and harness the power of data-driven decision-making to drive business success in an increasingly competitive landscape. Embracing innovation, adopting best practices, and fostering a culture of continuous learning is essential for navigating the evolving landscape of the market research industry.
To know more about Read our latest Blog: https://rise2research.com/blogs/top-challenges-in-the-market-research-industry/
Also Read:
online market research services
data collection and insights
survey programming services
healthcare market research
2 notes
·
View notes
Text
Basic Structure of a Scientific Paper to Write.

The fundamental structure of a scientific paper is encapsulated by the acronym IMRAD, which stands for Introduction, Methods, Results, and Discussion. This structure is integral to original research articles and facilitates clear and organized presentation of research findings. Each component of IMRAD serves a distinct purpose:
Introduction: Presents the research question and its significance.
Methods: Describes the procedures and techniques used to conduct the study.
Results: Summarizes the data and findings of the research.
Discussion: Interprets the findings, linking them back to the research question and broader context.
In addition to IMRAD, scientific papers typically include a title page, abstract, keywords, tables, graphs, figures, acknowledgments, and references. Each element contributes to the overall clarity and accessibility of the research.
Types of Papers

Scientific journals publish various types of papers, each serving a specific purpose and judged by distinct criteria. Understanding these types can help authors select the most appropriate format for their work, thus maximizing the impact and acceptance chances of their manuscript. The main types of papers include:
Original Article: Reports new research findings based on original research. This is the most critical paper type, often subdivided into Major Papers and Original Reports.
Case Report: Describes unique cases that provide new insights or highlight unusual clinical conditions.
Technical Note: Details specific techniques, procedures, or new equipment relevant to a medical field.
Pictorial Essay: Focuses on the educational value of high-quality images, often used in teaching.
Review: Summarizes recent developments on a specific topic without introducing new data.
Commentary: Offers personal perspectives on current issues or controversial topics.
Editorial: Provides short reviews or critiques of articles published in the same journal issue.
Letter to the Editor: Allows for short communications on various subjects, including comments on previously published articles.
Preparing the Manuscript
Authors must tailor their manuscripts to the type of paper they are writing, following specific guidelines and structures. For example:
Original Articles should follow the IMRAD structure with a detailed methods section and robust statistical analysis.
Case Reports often have a simpler structure with a focus on the unique aspects of the case and their implications.
Technical Notes and Pictorial Essays emphasize methods and visual elements, respectively, with concise text sections.
Reviews and Commentaries should be well-organized with comprehensive coverage of the relevant literature and clear presentation of viewpoints.
Enhancing Chances of Acceptance
To enhance the chances of manuscript acceptance, authors should:
Adhere to the journal’s specific guidelines outlined in the “Instructions to Authors” or “Guide for Authors.”
Ensure their manuscript is well-structured, clear, and concise.
Select the most appropriate type of paper for their research.
Include all necessary components, such as a structured abstract, relevant keywords, and thorough references.
Conclusion
Familiarity with the basic structure and types of scientific papers, as well as adherence to journal guidelines, is crucial for authors aiming to publish their work successfully. By choosing the appropriate format and meticulously preparing their manuscripts, authors can effectively communicate their research and increase their chances of acceptance in reputable journals. This structured approach not only maximizes the material’s impact but also contributes to the advancement of scientific knowledge in the medical field.
Investing in your academic future with Dissertation Writing Help For Students means choosing a dedicated professional who understands the complexities of dissertation writing and is committed to your success. With a comprehensive range of services, personalized attention, and a proven track record of helping students achieve their academic goals, I am here to support you at every stage of your dissertation journey.
Feel free to reach out to me at [email protected] to commence a collaborative endeavor towards scholarly excellence. Whether you seek guidance in crafting a compelling research proposal, require comprehensive editing to refine your dissertation, or need support in conducting a thorough literature review, I am here to facilitate your journey towards academic success. and discuss how I can assist you in realizing your academic aspirations.
#academics#education#grad school#gradblr#phd#phd life#phd research#phd student#phdblr#study#study with me#study motivation#studyspo#study blog#studyblr#study aesthetic#studying#student life#university#university student#uni life#writers on tumblr#writing#my writing#writeblr#writers and poets#writerscommunity#scientific research#thesis#dissertation
1 note
·
View note
Text


Field-level inference: Unlocking the full potential of galaxy maps to explore new physics
Galaxies are not islands in the cosmos. While globally the universe expands—driven by the mysterious "dark energy"—locally, galaxies cluster through gravitational interactions, forming the cosmic web held together by dark matter's gravity. For cosmologists, galaxies are test particles to study gravity, dark matter and dark energy.
For the first time, MPA researchers and alumni have now used a novel method that fully exploits all information in galaxy maps and applied it to simulated but realistic datasets. Their study demonstrates that this new method will provide a much more stringent test of the cosmological standard model, and has the potential to shed new light on gravity and the dark universe.
From tiny fluctuations in the primordial universe, the vast cosmic web emerged: galaxies and galaxy clusters form at the peaks of (over)dense regions, connected by cosmic filaments with empty voids in between. Today, millions of galaxies sit across the cosmic web. Large galaxy surveys map those galaxies to trace the underlying spatial matter distribution and track their growth or temporal evolution.
Observing and analyzing millions of galaxies turns out to be a daunting task. Hence, standard analyses first compress the three-dimensional galaxy distribution into measurements of the spatial correlation between pairs and triplets of galaxies, technically known as the two- and three-point correlation functions (see TOP IMAGE).
These restricted statistics, however, potentially leave out a lot of information in galaxy maps, especially information encoded on smaller spatial scales. In addition, they do not tell us where in the maps to look further, should some surprising result turn up in these statistics. How much more information can be extracted?
A recent study published in Physical Review Letters by MPA researchers and alumni, led by Dr. Minh Nguyen, provides compelling evidence for significant information beyond the reach of two- and three-point functions.
For the study, the team have developed and validated a rigorous probabilistic framework, LEFTfield, to model the clustering of galaxies. How the LEFTfield framework leverages the Effective Field Theory of Large-Scale Structure (EFTofLSS) to produce robust and accurate predictions of the observed galaxy field with high efficiency was the topic of another MPA research highlight.
LEFTfield foward–models the evolution of primordial fluctuations into large-scale structure and galaxy clustering, preserving the entire information in the three-dimensional distribution of galaxies. Further, the LEFTfield forward model is differentiable, allowing for field-level inference (FLI) of both parameters in the cosmological model and the primordial fluctuations from which all structure in the universe emerged.
In the study, the team set up an apples-to-apples comparison between FLI and the standard two-point plus three-point ("2+3-pt") inference. Both inference pipelines adopt the same LEFTfield forward model, and use the observed maps on strictly the same scales, as illustrated by the centre image.
Analyzing the same catalogs of dark-matter halos from the same set of N-body simulations, the team found that FLI improves constraints on the amplitude of structure growth by a factor of 3–5, even with conservative scale cuts in both analyses.
The improvement implies that even without aggressively pushing down to very small scales—where we expect EFTofLSS or even N-body simulations to fail—much more information can still be extracted from galaxy clustering simply by opening up another dimension: getting rid of the compression of the input data.
The lower image compares the constraints on the amplitude of structure growth from the FLI and "2+3-pt" analyses. The parameter σ8 quantifies the typical amplitude of structure in the initial ("linear") density field on a certain scale.
Essentially, galaxy clustering constraints on σ8 probe the growth of structure from the early universe (where we have precise measurements thanks to the cosmic microwave background) to late times. For this reason, this is a parameter that is generally modified in non-standard cosmological models, for example, if gravity is not correctly described by General Relativity, or if dark matter is not cold.
A factor of 5 improvement in parameter constraints effectively "increases" the survey volume by more than an order of magnitude, which is a huge improvement given the time-consuming and expensive process of mapping out the galaxy distribution over a large volume. Moreover, FLI in principle guarantees optimal extraction of cosmological information: there is no data compression, hence no information loss.
While this study used dark matter halos in simulations, the conclusions also hold for significantly more realistic simulated galaxies, which were the subject of a parallel study by the Beyond-2pt Collaboration that includes two researchers from the MPA team, the FLI approach based on the LEFTfield framework again returns unbiased and improved constraint on growth of structure.
Beyond improved parameter constraints, FLI also offers numerous ways to find out where evidence for physics beyond the standard model of cosmology might come from, should such evidence appear.
Since we have samples of universes that are compatible with the data, we can look for those regions most strongly deviant from the standard model, and investigate what is unusual about them. We can also employ independent datasets, for example, by correlating the inferred matter density with gravitational lensing maps, which are an entirely different probe of structure.
The team now set their eyes on applying the novel FLI approach and LEFTfield framework to real data from galaxy surveys. To connect FLI to observations, a better understanding, hence more studies, of how observational systematics impact the model predictions at the field level will be required. A flexible-yet-efficient forward-modeling framework like LEFTfield will be the key for such studies, and for unlocking the full potential of FLI from galaxy maps.
TOP IMAGE: Summary statistics like the two- and three-point correlation functions compress the galaxy field into spatial correlations between pairs and triplets of galaxies (left panel). Field-level statistics bypass the compression step to access the entire information in the galaxy field. Credit: MPA
CENTRE IMAGE: The comparison between FLI and 2+3-point inference adopts the same forward model, LEFTfield, for both inference schemes. The key difference is FLI analyzes the entire galaxy field while 2+3-point inference analyzes only the 2+3-point summaries of the (same) galaxy field. Credit: MPA
LOWER IMAGE: Constraints on the amplitude of growth of structure σ8 are improved by up to a factor of 5 when analyzing the whole galaxy field compared to just the 2- and 3-point correlation functions. Credit: MPA
3 notes
·
View notes
Text
Visual Effects Trends to Watch Out for in 2024

2024 is anticipated to be a highly exciting year for visual effects. In 2023 we saw a rapid shift in the VFX industry with the expected boom of Artificial Intelligence. Today, AI and other new tools and technologies make a huge impact, including in the filmmaking processes like the screenplay, visual concept, VFX creation, editing, and sound. Artificial Intelligence will be employed almost everywhere. This will be an exciting change that will make storytelling tools to start becoming more accessible to all, while also fostering a more competitive and healthy environment for content creators across the board. Naturally, this will make it easier for artists to produce visually stunning content and shall provide wider access to technology, whether it is for writing filmmaking
Umpteen candidates. Infinite opportunities
The last year’s trend shift completely changed the horoscope of the visual effects sector. Studies show that the number of candidates enrolling for Animation and VFX courses has recently doubled effectively proving the popularity it gained among the general public. And, the reason being the scope of studying VFX has broadened worldwide never as before. Every VFX artist dream of working in premium studios like Disney, DNEG, Warner Bros etc or individually start their own business. Just like the boom in visual effects industry there is a similar boom happening in the film industry as well. The average amount of movies being released every year easily surpasses the former years. As most of the movies make use of VFX shots for the better theatrical experience, VFX industry effortlessly benefitted from this trend paving way for more opportunities for VFX artists.
Industry Statistics
India's visual effects and animation sector was estimated to be worth 107 billion Indian rupees in 2022, even after the pandemic's negative impact caused a decline in market value the year before. With revenue of over 50 billion Indian rupees, the VFX segment contributed the most to the overall market size. India's growing prosperity fuels the country's appetite for entertainment. Like other nations in the Asia-Pacific area, India's population is getting wealthier and its economy is expanding. The nation's media and entertainment sector has expanded as a result of rising income and improved connectivity.
Visual effects (VFX) and animation are widely growing media categories. A change towards more convenient and customized digital encounters occurred with the spread of the internet and its revolutionary technologies. These changes made more room for India's animation and visual effects industries to expand, and in 2022, the sector grew by almost 29%. In India, the media sector is dominated by animation and visual effects (VFX), which is expected to increase at a robust rate of 35 percent CAGR between 2022 and 2023.
The most recent developments in technology are establishing new avenues for creativity. As tools and techniques advance with time, VFX artists are experimenting and exploring new artistic possibilities. Traditional pipelines are being challenged by these innovative strategies, and 2024 will be a fascinating year for revaluating how the technology will interact with audience. In order to maximize ambition and minimize risk, VFX studios will be more involved and integrated, leveraging their knowledge of emerging technology and methods of operation.
The speed at which technological innovations are occurring is truly astounding. It is anticipated that in 2024, real-time technologies like Unreal Engine will continue to be adopted for virtual production applications and other uses. Although there are certain difficulties in this field, the opportunities and possible gains for studios are quite alluring. The widespread acceptance of these tactics has been greatly aided by the instruments' accessibility, and this envision is sure to be continued into 2024.
How to get into VFX industry?
The fact that you’re reading this blog and you’ve read it this far is itself a sign that you’re already into the step one of this process. Yes, step one is reading and studying intensively about VFX industry; Knowing the latest trends, range of opportunities, field that matches your taste and everything related which you can do research in. No matter whatever field you choose, having a thorough knowledge about what you’re getting yourself into is mandatory. The second step is opting a suitable program suited to your taste and interests. To pursue a career in VFX, select a that is well-reputated and has nice studio set-up. If you’re interested in only one of the genres of visual effects sector, taking a full-time 3 year degree programme won’t be a good idea. Whether you did 3 year degree program or certificate/diploma course, the opportunities will knock at your door if you’ve a top-noch bunch of works/showreels that showcase your talent and hardwork. Basically, it’s not the education certificate that matters but its the quality of your showreels that decides your future.
However, enrolling in a suitable VFX course at a respectable institution is the simplest approach to get into the VFX and animation industries. This will have a profound impact on how you pursue employment in the sector as well as how your future is shaped.
Salary of a VFX Artist in India
You can offer yourself a solid foundation by enrolling in a reputable VFX and animation course in India. As to the April 2020 update, a VFX artist’s average monthly remuneration is INR 37.5k. As you advance to the position of assistant technical director or assistant animator/creative director, you can expect to generate more income accordingly. In India, the average monthly salary for a VFX artist is presently around INR 15-25k. It is possible to take on freelance work in addition to your full-time employment if you have at least four to five years of expertise in the business. You can make up to INR 45k to 60k a month working as a freelancer, depending on your expertise, reputation, and caliber of work. Expert animators and visual effects artists also bill by the hour. Anyhow, let’s patiently sit back and watch what 2024 has in store for the VFX industry.
2 notes
·
View notes
Text
Top Measuring Instruments Supplier in India

A Legacy of Excellence
Kristeel’s journey began in 1973 with a simple yet powerful goal — to provide top-notch Precision Measuring instruments, engineering gauges, and tools. But their story doesn’t stop there. Over the years, they’ve expanded their horizons into manufacturing photochemical machined parts, press parts, wave solder pallets, SMT stencils, and textile machinery. Today, Kristeel calls Mumbai home and operates advanced manufacturing facilities in Mumbai, Bangalore, and Silvassa.
Crafting Precision:
What sets Kristeel apart is their unwavering dedication to precision. They’ve achieved this through investments in cutting-edge technology. At their manufacturing setups, you’ll find top-of-the-line plant and equipment imported from the USA, Italy, and Germany. This investment not only ensures accuracy but also results in cost savings.
Quality as a Way of Life:
Kristeel’s commitment to international quality standards is what keeps them at the top of their game. They aim for ‘zero’ defects and follow Total Quality Management (TQM) methods, leaving no room for error. To maintain quality at every stage, they employ a stringent Statistical Process Control System (SPCS).
International Recognition:
Kristeel’s dedication to quality has earned them recognition from the European Economic Community (EEC). Their precision measuring rules meet Class-I and II standards. Additionally, they proudly hold ISO 9001 certification from the TUV group in Süd Deutschland, Germany, and are actively implementing 6 Sigma Management practices.
Research & Development:
Kristeel’s journey is marked by their relentless pursuit of excellence through robust research and development. They continually enhance quality control, inspection processes, and machinery to remain the preferred choice in India and globally.
Supporting ‘Make in India’:
In line with the ‘Make in India’ initiative, Kristeel is setting up research and development units for textile machining and Vernier caliper tools within India, promoting domestic manufacturing.
Technology and Innovations:
Kristeel believes in staying at the forefront by investing in the latest technology and machinery upgrades. They’ve partnered with international leaders in their respective fields from Japan, the USA, Singapore, Italy, and more.
Global Reach, Local Connection:
Kristeel’s growth is a result of its sustainable development and inclusive growth approach. Their extensive network spans over 3600 customer touchpoints, including authorized dealerships, instrument and tool outlets, and dealer-appointed outlets across the country.
Conclusion
In conclusion, Kristeel’s journey as a Leading measuring instrument and precision tool manufacturer is characterized by their unwavering commitment to quality, dedication to innovation, and adoption of technological advancements. With a legacy of almost five decades, Kristeel continues to shape the industry, support domestic manufacturing, and contribute to India’s ‘Make in India’ initiative. Their impressive track record, international certifications, and extensive distribution network make Kristeel a trusted source for precision engineering. Whether you’re a professional in the industry or an enthusiast, Kristeel has something to offer for everyone who values precision and quality.
2 notes
·
View notes
Text
The Role of Business Intelligence in ERP Software
Enterprise Resource Planning (ERP) software providers like STERP (Shanti Technology), an excellent ERP software company in Madhya Pradesh, understand the value of Business Intelligence (BI) within this context. STERP, a leading provider of manufacturing ERP software in Indore, recognises the potential of business intelligence (BI) to turn collected data into a competitive advantage.

Business intelligence (BI) in the context of enterprise resource planning (ERP) refers to the processes involved in collecting, preparing, and analysing data from a wide variety of ERP subsystems. This suite of state-of-the-art methods and technologies produces insightful reports that may be used for strategic planning, performance monitoring, and operational optimisation.
STERP, a leading ERP software company in Madhya Pradesh and one of the top ERP solution providers in Indore understands the significance of a robust BI system for monitoring key performance indicators (KPIs), tracking trends, identifying patterns, and uncovering hidden opportunities and risks. Data analytics can be put to use in businesses for potential gains in productivity, cost savings, customer satisfaction, and innovation.
STERP, one of the most distinguished ERP software companies in Madhya Pradesh, promises cutting-edge BI tools in all of its ERP packages. By providing intuitive dashboards, customizable reports, and real-time analytics, STERP provides its customers with a bird's eye view of their operations. Let's explore the role that business intelligence plays in enterprise resource planning systems.
Data Integration and Consolidation for Informed Decision-Making:
Integrated and consolidated data is crucial for businesses like STERP, one of the most reliable ERP software providers in Madhya Pradesh, to make well-informed decisions. As an industry leader in manufacturing ERP software in Indore, STERP is well aware of the need of combining and integrating data from several sources.
The term "consolidation" refers to the process of collecting and harmonizing data from several locations. In its capacity as one of the leading ERP software firms in Madhya Pradesh and ERP solution providers in Indore, STERP facilitates the consolidation of data from disparate sources into a single repository. Data centralization ensures that all firm decision-makers and executives are using the same, reliable information.
Reporting and Analytics for Performance Monitoring:
In order to generate reports, it is necessary to construct and present organised data in an understandable and unambiguous way. STERP's ERP software makes it simple for businesses to tailor reports to their specific requirements, allowing for deeper analysis of sales, inventory, production, and finances.
By evaluating data and providing reports, STERP, a well-known manufacturing ERP software provider in Indore, aids numerous firms in gaining insight into their processes. Real-time dashboards and visualisations allow executives to identify bottlenecks, allocate resources effectively, streamline processes, and make educated strategic decisions.
Predictive Analytics and Forecasting for Strategic Planning:
Strategic decision-making at STERP, a distinct ERP software company in Madhya Pradesh, is significantly influenced by analytics and forecasting. As one of the most distinguished ERP solution providers in Indore, STERP recognises the significance of analytics and forecasting in directing business growth and strategy.
Utilising historical information, statistical algorithms, and machine learning techniques, predictive analytics allows for precise forecasting and prediction. In order to stay ahead of the competition, businesses can use predictive analytics to forecast demand, identify risks, determine the most efficient use of resources, and make other proactive decisions.
Self-Service BI and Empowering End Users:
Being one of the trusted ERP solution providers in Indore and a top manufacturing ERP software company in Indore, STERP appreciates the importance of self-service BI in empowering end users to make better, more efficient decisions.
Self-service BI allows end users to access and update data without involving IT or data analysts. To make data exploration, report preparation, and insight production accessible to users of all skill levels, STERP offers intuitive interfaces and clear tools. Users are empowered to make decisions at the moment based on accurate data without relying on IT, thanks to self-service BI.

Final Thoughts:
Business intelligence (BI) is crucial in ERP. Companies like STERP (Shanti Technology), a distinct ERP software company in Madhya Pradesh, appreciate the value of BI since it helps them to leverage data for strategic decision-making and planning. When businesses are able to consolidate and integrate their data, they are able to view the big picture of their operations, and the reporting and analytics functions give them insight into KPIs. In addition, businesses can use forecasting and predictive analytics to anticipate future trends, mitigate risks, and seize opportunities. Self-service BI provides end users with straightforward tools to access and analyse data on their own, fostering a culture of data-driven decision-making and increasing productivity.
#Manufacturing ERP software in Indore#ERP Software Company in Madhya Pradesh#ERP solution providers in Indore#ERP software Companies in Madhya Pradesh#manufacturer#ERP system#cloud ERP#ERP solutions#marketing#ERP software#engineering ERP#business#process
6 notes
·
View notes
Text
Quantitative Risk Management
By. Jacinda T. Thomas, Masters of Science in Wealth Management { An American in Switzerland }
#jacindathomas #wealthmanagement
Today we dive into the world of Quantitative Risk Management. Let's see how interesting this can be.
While reading the first paragraph I immediately thought: insurance company. Although it discusses that Quantitative Risk Management is used for Project Management.
I wonder if more of my reading will reveal this.
Quantitative Risk Analysis in Project Management
Quantitative risk analysis in project management is the process of altering the effect of risk on the project into arithmetical terms. This arithmetic information is often used to control the cost and time contingencies of the project. The purpose of project risk management is to recognize and minimalize the effect that risks have on a project. The challenge with risk management is that risks are indefinite events.
In the management of projects, organizations try to lessen their revelation to these indefinite events through risk management. This is typically done through a proper management process which consists of the following steps: design risk management, recognize risks, achieve quantitative risk analysis, design risk rejoinders, and control risks.
Quantitative Risk Analysis vs Qualitative Risk Analysis
Quantitative risk analysis is objective. It uses provable data to examine the effects of risk in terms of cost overflows, scope slinks, resource depletion, and schedule interruptions. Qualitative risk analysis, on the other hand, tends to be subjective. It focuses on identifying risks to measure both the probability of a specific risk event happening during the project life span and the effect it will have on the whole schedule should it occur. The objective being to determine sternness. Outcomes are then documented in a risk assessment matrix to communicate unresolved risks to shareholders. Eventually, the drive is the same: the difference is that it takes a more logical, data-intensive method.
Quantitative risk analysis relies on precise statistical data to create actionable perceptions. Instead, they used a more subjective, qualitative approach to risk management, which had one key benefit: it was faster and laid-back to apply. Unlike quantitative analysis of risk, which relies on robust risk models, a high capacity of data, and in some cases, expert software, qualitative risk analysis can be achieved at any phase of the project.
Nonetheless, quantitative risk analysis is fundamental, both in its accuracy and as a way of steering further analysis on existent risks. This comprises: quantifying probable consequences, clearing up any persistent ambiguity neighboring the outcomes of your original qualitative analysis, setting attainable aims in terms of schedule and cost, and Evaluating the possibility of fruitfully accomplishing these objectives. High-risk businesses in particular- mining, construction, oil and gas, anything that shows a very real hazard to the wellbeing of frontline workforces on a day-to-day basis- rely deeply on quantitative risk analysis. Luckily, as technology advances, so too has the way we achieve quantitative risk analysis. New gears are accessible to aid improve the legitimacy of your risk analysis and comprehend the stages required to moderate possible problems.
Quantitative Risk Analysis Techniques/ Methods
You will be required to comprehend and acquaint yourself with this quantitative analysis of risk techniques for the PMP certification EXAM. The following are some of the techniques:
Sensitivity analysis: A quantitative risk analysis and exhibiting technique used to aid determine which risks have the most probable effect on the project. It scrutinizes the level to which the ambiguity of each project element affects the objective being scrutinized when all other indefinite elements are held at baseline standards. The typical presentation of outcomes is in the form of a tornado diagram.
Expected Monetary Value (EMV) analysis: An arithmetical method that computes the average consequence when the future includes scenarios that may or may not happen. A common use of this technique is within decision tree analysis.
Decision tree analysis: A schematization and calculation method for gauging the consequences of a chain of multiple choices in the presence of ambiguity.
Simulation: A simulation uses a project model that interprets the reservations quantified at a detailed level into their probable effect on objectives that are articulated at the level of the total project. Project simulations use computer models and evaluations of risk, usually articulated as a possibility distribution of possible costs or durations at an exhaustive work level, and are normally performed by using Monte Carlo analysis.
Empirical Methods (benchmarking): these techniques use historical projects to determine factors that drive risk. These factors are then applied to a prospective project to determine the contingency-based characteristics that are shared with the historical projects; these methods include:
Regression
Factor rating
Quantitative Risk Analysis Examples
Here are two examples of how to determine the EMV of a risk.
Example 1:
Assume you have bought an off-the-rack software, though you have risk linked to customization. There is a 60% chance that you will have to do only a little customization, which would bring the total cost to $ 120,000. And there is a 40% chance that you will have to do a lot of customization, which would bring the total cost to $160,000. To calculate the expected value, add the values of each alternative.
EMV= probability x cost = (60% x $120,000) + (40% x 160,000)
=$20,000 + $ 40,000
EMV= $60,000.
Example 2:
A company may have a risk probability that may result in the laying of workers. In this case, there is a 50% chance that you will keep the staff which would bring the total cost to $100,000. On the other hand, there is a 50% chance that you will lose staff which would bring the total cost to $200,000. Calculate the EMV.
EMV= Probability x cost = (50% x $100,000) + (50% x $200,000)
= $20,000 + $40,000
EMV= $60,000
Quantitative Risk Analysis Benefits & Limitations
Some of the advantages of quantitative risk analysis are: to determine the likelihood of accomplishing a particular project objective. Quantify the risk revelation of the project, and determine the scope of cost and schedule possibility that may be required. Risk is organized by their financial effect, possessions by their financial value. The outcomes can be articulated in detailed management terminology. The safety level is better determined grounded on the three basics: accessibility, veracity, and privacy. A cost analysis can be executed for choosing the best-suited procedures. Data precision progresses as the organization increases the experience.
On the other hand, Quantitative risk analysis has limitations: the approaches of calculation are complex and without an automatic tool the progression can be really difficult to compute. There are no values and generally accepted information for executing this method. The values of risk effects are founded on the subjective sentiments of the people involved. The process handles a long time. The outcomes are offered only in monetary values and are hard to comprehend by persons without experience. In general, the process is very complex.
Conclusion
If the outcomes of quantitative risk analysis are well comprehended and the right procedures are executed, the organization will not only vanish from the market but also advance and more easily gain the targeted outcomes. Risk identification should be done with greater maintenance, and all risks must be recognized and treated cautiously. The estimation and calculation of probable threats, susceptibilities, and possible harm are very important. After this valuation is done, essential controls should be applied in terms of cost efficiency and level of risk reduced by the execution. To recognize the most suitable controls a cost analysis has to be done. Its outcomes aid managers implement the most effective controls that bring the greatest profit to the organization

A random gif that popped up. I guess Angelina is kinda over this Quantitative Risk Analysis, sorry boo, we gotta keep learning more, let's see if investopedia has something to say. We'll also see if we can find a video or two to make this less boring Angie :).
youtube
Now, here's a university series on Quantitative Risk Analysis?
2 notes
·
View notes