#the oceanographers for instance
Explore tagged Tumblr posts
Visit Tumblr Blog
Explore Tumblr blogs with no restrictions, modern design and the best experience.
Last Seen Tumblr Blogs


Fun Fact
Post activity is at the highest at 4:00 pm EDT; notes peak at 10:00 pm EDT.
Text
I love radians as much as the next gal, particularly because of how they make the e^iπ-1 thing work out (it's because e is a circle in the complex plane) but I do think it's a little wild that most programs default to them over degrees the thing that most people who aren't mathematicians use because you gotta get at least to Taylor serieses before getting why radians are so sexy.
#Less that particular equation and more how beautifully the taylor series works out to give that#But at any rate I do think if I put sin(30) into a search engine it should give me .5#Actually tbh it's more because you can use small angel approximations but those fall out of the taylor series too#When I say mathematicians I mean people doing serious calc in their work so also physicists and chemists#Plus probably other specializations I'm forgetting or am unaware of#All sorts of variations on those two certainly#the oceanographers for instance#My point is that radians are the superior angle unit for calculus based work#But it's a wash with degrees at best when it comes to geometry#and IMO people are doing geometry more than they're doing calculus#Radians are also basically useless when they aren't presented as fractions of π#Which can't be said about degrees#Anyone who tells you that they have a better grasp of fractions of π than of 90 is lying#Even if they are the sort of person who uses them enough to prefer the humble radian
3 notes
·
View notes
Text
Thanks to Jaws’ pulse-pounding theme, sharks are synonymous with a spine-chilling sound. In reality, they silently swim and scarf down prey without making a peep—until now, that is. These fish have just broken their silence. A team of researchers recently recorded sharks of one species making short, high-frequency clicks when the animals were handled underwater. The study results, published this week in Royal Society Open Science, represent the first known occurrence of a shark actively producing sound. The sounds were first observed by marine biologist Carolin Nieder, lead author of the new study, while she was working on her Ph.D. at the University of Auckland in New Zealand. Her project was focused on the hearing capabilities of several sharks, including the rig shark, a small species that is native to the coastal waters around New Zealand. But something odd happened when Nieder handled the rig sharks between tests: they would start to crackle. “At first we had no idea what it was because sharks were not supposed to make any sounds,” says Nieder, who is now at the Woods Hole Oceanographic Institution. “I remember coming home and just thinking more and more about how weird those sounds were.” More than 1,000 fish species are known to produce sounds, usually by vibrating their swim bladder, a gas-filled organ that helps the animals stay buoyant and can also act as an amplifier. But rigs and other sharks lack a swim bladder. To determine if the rigs were actually generating the crackling sounds, Nieder and her colleagues placed 10 juveniles, one at a time, into tanks that were outfitted with sound recorders. The researchers held each rig for 20 seconds and analyzed the resulting audio recordings. Each of these sharks produced high-frequency clicks, which lasted only a fraction of a second. The researchers recorded significantly more clicks in the first 10 seconds of the handling session than they did in the last 10 seconds, suggesting the sounds represented the rigs’ response to being startled by their handlers, Nieder says.
There's recordings at the link!
17 notes
·
View notes
Text

NASA, French SWOT Satellite Offers Big View of Small Ocean Features
The international mission collects two-dimensional views of smaller waves and currents that are bringing into focus the ocean’s role in supporting life on Earth.
Small things matter, at least when it comes to ocean features like waves and eddies. A recent NASA-led analysis using data from the SWOT (Surface Water and Ocean Topography) satellite found that ocean features as small as a mile across potentially have a larger impact on the movement of nutrients and heat in marine ecosystems than previously thought.
Too small to see well with previous satellites but too large to see in their entirety with ship-based instruments, these relatively small ocean features fall into a category known as the submesoscale. The SWOT satellite, a joint effort between NASA and the French space agency CNES (Centre National d’Études Spatiales), can observe these features and is demonstrating just how important they are, driving much of the vertical transport of things like nutrients, carbon, energy, and heat within the ocean. They also influence the exchange of gases and energy between the ocean and atmosphere.
“The role that submesoscale features play in ocean dynamics is what makes them important,” said Matthew Archer, an oceanographer at NASA’s Jet Propulsion Laboratory in Southern California. Some of these features are called out in the animation below, which was created using SWOT sea surface height data.
“Vertical currents move heat between the atmosphere and ocean, and in submesoscale eddies, can actually bring up heat from the deep ocean to the surface, warming the atmosphere,” added Archer, who is a coauthor on the submesoscale analysis published in April in the journal Nature. Vertical circulation can also bring up nutrients from the deep sea, supplying marine food webs in surface waters like a steady stream of food trucks supplying festivalgoers.
“Not only can we see the surface of the ocean at 10 times the resolution of before, we can also infer how water and materials are moving at depth,” said Nadya Vinogradova Shiffer, SWOT program scientist at NASA Headquarters in Washington.
Fundamental Force
Researchers have known about these smaller eddies, or circular currents, and waves for decades. From space, Apollo astronauts first spotted sunlight glinting off small-scale eddies about 50 years ago. And through the years, satellites have captured images of submesoscale ocean features, providing limited information such as their presence and size. Ship-based sensors or instruments dropped into the ocean have yielded a more detailed view of submesoscale features, but only for relatively small areas of the ocean and for short periods of time.
The SWOT satellite measures the height of water on nearly all of Earth’s surface, including the ocean and freshwater bodies, at least once every 21 days. The satellite gives researchers a multidimensional view of water levels, which they can use to calculate, for instance, the slope of a wave or eddy. This in turn yields information on the amount of pressure, or force, being applied to the water in the feature. From there, researchers can figure out how fast a current is moving, what’s driving it and —combined with other types of information — how much energy, heat, or nutrients those currents are transporting.
“Force is the fundamental quantity driving fluid motion,” said study coauthor Jinbo Wang, an oceanographer at Texas A&M University in College Station. Once that quantity is known, a researcher can better understand how the ocean interacts with the atmosphere, as well as how changes in one affect the other.
Prime Numbers
Not only was SWOT able to spot a submesoscale eddy in an offshoot of the Kuroshio Current — a major current in the western Pacific Ocean that flows past the southeast coast of Japan — but researchers were also able to estimate the speed of the vertical circulation within that eddy. When SWOT observed the feature, the vertical circulation was likely 20 to 45 feet (6 to 14 meters) per day.
This is a comparatively small amount for vertical transport. However, the ability to make those calculations for eddies around the world, made possible by SWOT, will improve researchers’ understanding of how much energy, heat, and nutrients move between surface waters and the deep sea.
Researchers can do similar calculations for such submesoscale features as an internal solitary wave — a wave driven by forces like the tide sloshing over an underwater plateau. The SWOT satellite spotted an internal wave in the Andaman Sea, located in the northeastern part of the Indian Ocean off Myanmar. Archer and colleagues calculated that the energy contained in that solitary wave was at least twice the amount of energy in a typical internal tide in that region.
This kind of information from SWOT helps researchers refine their models of ocean circulation. A lot of ocean models were trained to show large features, like eddies hundreds of miles across, said Lee Fu, SWOT project scientist at JPL and a study coauthor. “Now they have to learn to model these smaller scale features. That’s what SWOT data is helping with.”
Researchers have already started to incorporate SWOT ocean data into some models, including NASA’s ECCO (Estimating the Circulation and Climate of the Ocean). It may take some time until SWOT data is fully a part of models like ECCO. But once it is, the information will help researchers better understand how the ocean ecosystem will react to a changing world.
More About SWOT
The SWOT satellite was jointly developed by NASA and CNES, with contributions from the Canadian Space Agency (CSA) and the UK Space Agency. Managed for NASA by Caltech in Pasadena, California, JPL leads the U.S. component of the project. For the flight system payload, NASA provided the Ka-band radar interferometer (KaRIn) instrument, a GPS science receiver, a laser retroreflector, a two-beam microwave radiometer, and NASA instrument operations. The Doppler Orbitography and Radioposition Integrated by Satellite system, the dual frequency Poseidon altimeter (developed by Thales Alenia Space), the KaRIn radio-frequency subsystem (together with Thales Alenia Space and with support from the UK Space Agency), the satellite platform, and ground operations were provided by CNES. The KaRIn high-power transmitter assembly was provided by CSA.
IMAGE: Sunlight reflects off the ocean surface near Norfolk, Virginia, in this 1991 space shuttle image, highlighting swirling patterns created by features such as internal waves, which are produced when the tide moves over underwater features. Data from the international SWOT mission is revealing the role of smaller-scale waves and eddies. Credit: NASA
youtube
4 notes
·
View notes
Text
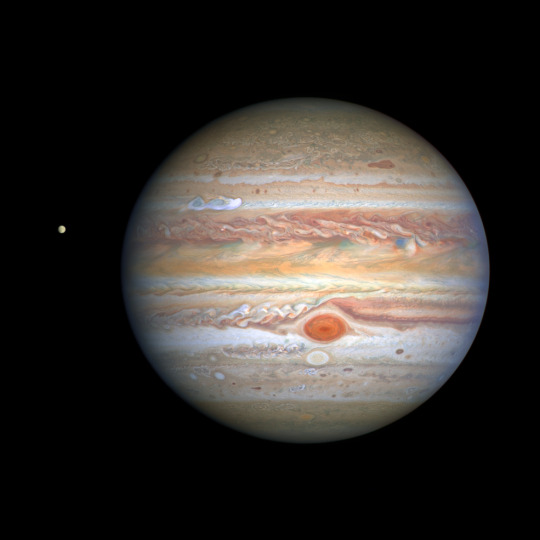
A carbon-lite atmosphere could be a sign of water and life on other terrestrial planets, MIT study finds
A low carbon abundance in planetary atmospheres, which the James Webb Space Telescope can detect, could be a signature of habitability.
Jennifer Chu | MIT News

Scientists at MIT, the University of Birmingham, and elsewhere say that astronomers’ best chance of finding liquid water, and even life on other planets, is to look for the absence, rather than the presence, of a chemical feature in their atmospheres.
The researchers propose that if a terrestrial planet has substantially less carbon dioxide in its atmosphere compared to other planets in the same system, it could be a sign of liquid water — and possibly life — on that planet’s surface.
What’s more, this new signature is within the sights of NASA’s James Webb Space Telescope (JWST). While scientists have proposed other signs of habitability, those features are challenging if not impossible to measure with current technologies. The team says this new signature, of relatively depleted carbon dioxide, is the only sign of habitability that is detectable now.
“The Holy Grail in exoplanet science is to look for habitable worlds, and the presence of life, but all the features that have been talked about so far have been beyond the reach of the newest observatories,” says Julien de Wit, assistant professor of planetary sciences at MIT. “Now we have a way to find out if there’s liquid water on another planet. And it’s something we can get to in the next few years.”
The team’s findings appear today in Nature Astronomy. De Wit co-led the study with Amaury Triaud of the University of Birmingham in the UK. Their MIT co-authors include Benjamin Rackham, Prajwal Niraula, Ana Glidden Oliver Jagoutz, Matej Peč, Janusz Petkowski, and Sara Seager, along with Frieder Klein at the Woods Hole Oceanographic Institution (WHOI), Martin Turbet of Ècole Polytechnique in France, and Franck Selsis of the Laboratoire d’astrophysique de Bordeaux.
Beyond a glimmer
Astronomers have so far detected more than 5,200 worlds beyond our solar system. With current telescopes, astronomers can directly measure a planet’s distance to its star and the time it takes it to complete an orbit. Those measurements can help scientists infer whether a planet is within a habitable zone. But there’s been no way to directly confirm whether a planet is indeed habitable, meaning that liquid water exists on its surface.
Across our own solar system, scientists can detect the presence of liquid oceans by observing “glints” — flashes of sunlight that reflect off liquid surfaces. These glints, or specular reflections, have been observed, for instance, on Saturn’s largest moon, Titan, which helped to confirm the moon’s large lakes.
Detecting a similar glimmer in far-off planets, however, is out of reach with current technologies. But de Wit and his colleagues realized there’s another habitable feature close to home that could be detectable in distant worlds.
“An idea came to us, by looking at what’s going on with the terrestrial planets in our own system,” Triaud says.
Venus, Earth, and Mars share similarities, in that all three are rocky and inhabit a relatively temperate region with respect to the sun. Earth is the only planet among the trio that currently hosts liquid water. And the team noted another obvious distinction: Earth has significantly less carbon dioxide in its atmosphere.
“We assume that these planets were created in a similar fashion, and if we see one planet with much less carbon now, it must have gone somewhere,” Triaud says. “The only process that could remove that much carbon from an atmosphere is a strong water cycle involving oceans of liquid water.”
Indeed, the Earth’s oceans have played a major and sustained role in absorbing carbon dioxide. Over hundreds of millions of years, the oceans have taken up a huge amount of carbon dioxide, nearly equal to the amount that persists in Venus’ atmosphere today. This planetary-scale effect has left Earth’s atmosphere significantly depleted of carbon dioxide compared to its planetary neighbors.
“On Earth, much of the atmospheric carbon dioxide has been sequestered in seawater and solid rock over geological timescales, which has helped to regulate climate and habitability for billions of years,” says study co-author Frieder Klein.
The team reasoned that if a similar depletion of carbon dioxide were detected in a far-off planet, relative to its neighbors, this would be a reliable signal of liquid oceans and life on its surface.
“After reviewing extensively the literature of many fields from biology, to chemistry, and even carbon sequestration in the context of climate change, we believe that indeed if we detect carbon depletion, it has a good chance of being a strong sign of liquid water and/or life,” de Wit says.
Keep reading.
Make sure to follow us on Tumblr!
14 notes
·
View notes
Text
Dealing with the limitations of our noisy world
New Post has been published on https://thedigitalinsider.com/dealing-with-the-limitations-of-our-noisy-world/
Dealing with the limitations of our noisy world

Tamara Broderick first set foot on MIT’s campus when she was a high school student, as a participant in the inaugural Women’s Technology Program. The monthlong summer academic experience gives young women a hands-on introduction to engineering and computer science.
What is the probability that she would return to MIT years later, this time as a faculty member?
That’s a question Broderick could probably answer quantitatively using Bayesian inference, a statistical approach to probability that tries to quantify uncertainty by continuously updating one’s assumptions as new data are obtained.
In her lab at MIT, the newly tenured associate professor in the Department of Electrical Engineering and Computer Science (EECS) uses Bayesian inference to quantify uncertainty and measure the robustness of data analysis techniques.
“I’ve always been really interested in understanding not just ‘What do we know from data analysis,’ but ‘How well do we know it?’” says Broderick, who is also a member of the Laboratory for Information and Decision Systems and the Institute for Data, Systems, and Society. “The reality is that we live in a noisy world, and we can’t always get exactly the data that we want. How do we learn from data but at the same time recognize that there are limitations and deal appropriately with them?”
Broadly, her focus is on helping people understand the confines of the statistical tools available to them and, sometimes, working with them to craft better tools for a particular situation.
For instance, her group recently collaborated with oceanographers to develop a machine-learning model that can make more accurate predictions about ocean currents. In another project, she and others worked with degenerative disease specialists on a tool that helps severely motor-impaired individuals utilize a computer’s graphical user interface by manipulating a single switch.
A common thread woven through her work is an emphasis on collaboration.
“Working in data analysis, you get to hang out in everybody’s backyard, so to speak. You really can’t get bored because you can always be learning about some other field and thinking about how we can apply machine learning there,” she says.
Hanging out in many academic “backyards” is especially appealing to Broderick, who struggled even from a young age to narrow down her interests.
A math mindset
Growing up in a suburb of Cleveland, Ohio, Broderick had an interest in math for as long as she can remember. She recalls being fascinated by the idea of what would happen if you kept adding a number to itself, starting with 1+1=2 and then 2+2=4.
“I was maybe 5 years old, so I didn’t know what ‘powers of two’ were or anything like that. I was just really into math,” she says.
Her father recognized her interest in the subject and enrolled her in a Johns Hopkins program called the Center for Talented Youth, which gave Broderick the opportunity to take three-week summer classes on a range of subjects, from astronomy to number theory to computer science.
Later, in high school, she conducted astrophysics research with a postdoc at Case Western University. In the summer of 2002, she spent four weeks at MIT as a member of the first class of the Women’s Technology Program.
She especially enjoyed the freedom offered by the program, and its focus on using intuition and ingenuity to achieve high-level goals. For instance, the cohort was tasked with building a device with LEGOs that they could use to biopsy a grape suspended in Jell-O.
The program showed her how much creativity is involved in engineering and computer science, and piqued her interest in pursuing an academic career.
“But when I got into college at Princeton, I could not decide — math, physics, computer science — they all seemed super-cool. I wanted to do all of it,” she says.
She settled on pursuing an undergraduate math degree but took all the physics and computer science courses she could cram into her schedule.
Digging into data analysis
After receiving a Marshall Scholarship, Broderick spent two years at Cambridge University in the United Kingdom, earning a master of advanced study in mathematics and a master of philosophy in physics.
In the UK, she took a number of statistics and data analysis classes, including her first class on Bayesian data analysis in the field of machine learning.
It was a transformative experience, she recalls.
“During my time in the U.K., I realized that I really like solving real-world problems that matter to people, and Bayesian inference was being used in some of the most important problems out there,” she says.
Back in the U.S., Broderick headed to the University of California at Berkeley, where she joined the lab of Professor Michael I. Jordan as a grad student. She earned a PhD in statistics with a focus on Bayesian data analysis.
She decided to pursue a career in academia and was drawn to MIT by the collaborative nature of the EECS department and by how passionate and friendly her would-be colleagues were.
Her first impressions panned out, and Broderick says she has found a community at MIT that helps her be creative and explore hard, impactful problems with wide-ranging applications.
“I’ve been lucky to work with a really amazing set of students and postdocs in my lab — brilliant and hard-working people whose hearts are in the right place,” she says.
One of her team’s recent projects involves a collaboration with an economist who studies the use of microcredit, or the lending of small amounts of money at very low interest rates, in impoverished areas.
The goal of microcredit programs is to raise people out of poverty. Economists run randomized control trials of villages in a region that receive or don’t receive microcredit. They want to generalize the study results, predicting the expected outcome if one applies microcredit to other villages outside of their study.
But Broderick and her collaborators have found that results of some microcredit studies can be very brittle. Removing one or a few data points from the dataset can completely change the results. One issue is that researchers often use empirical averages, where a few very high or low data points can skew the results.
Using machine learning, she and her collaborators developed a method that can determine how many data points must be dropped to change the substantive conclusion of the study. With their tool, a scientist can see how brittle the results are.
“Sometimes dropping a very small fraction of data can change the major results of a data analysis, and then we might worry how far those conclusions generalize to new scenarios. Are there ways we can flag that for people? That is what we are getting at with this work,” she explains.
At the same time, she is continuing to collaborate with researchers in a range of fields, such as genetics, to understand the pros and cons of different machine-learning techniques and other data analysis tools.
Happy trails
Exploration is what drives Broderick as a researcher, and it also fuels one of her passions outside the lab. She and her husband enjoy collecting patches they earn by hiking all the trails in a park or trail system.
“I think my hobby really combines my interests of being outdoors and spreadsheets,” she says. “With these hiking patches, you have to explore everything and then you see areas you wouldn’t normally see. It is adventurous, in that way.”
They’ve discovered some amazing hikes they would never have known about, but also embarked on more than a few “total disaster hikes,” she says. But each hike, whether a hidden gem or an overgrown mess, offers its own rewards.
And just like in her research, curiosity, open-mindedness, and a passion for problem-solving have never led her astray.
#amazing#Analysis#applications#approach#Artificial Intelligence#Astronomy#Astrophysics#Building#career#change#classes#collaborate#Collaboration#collaborative#college#Community#computer#Computer Science#Computer science and technology#courses#craft#creativity#curiosity#data#data analysis#deal#Disease#Electrical Engineering&Computer Science (eecs)#emphasis#engineering
2 notes
·
View notes
Text


The sight of chubby baby cheeks is often enough to transform even the most committed curmudgeon into a babbling softie.
Sentences become shorter, sounds are exaggerated, and the overall pattern of speech is more singsong and musical.
Researchers have dubbed this “motherese,” or, more formally, “infant-directed speech.”
“We’re not changing the words that we’re saying, we’re changing the way that we’re saying them,” says Laela Sayigh, a marine biologist at the Woods Hole Oceanographic Institution and Hampshire College in Massachusetts.
Only a handful of other species have been shown to change their calls when addressing young, including zebra finches, rhesus macaques, and squirrel monkeys.
Now, Sayigh’s new study, based on three decades of data in Florida, reveals common bottlenose dolphins use motherese — one of the first times it’s been documented in a species other than humans.
It's a major discovery, agrees Rindy Anderson, a behavioral ecologist at Florida Atlantic University who was not involved with the research.
The study, published today in the Proceedings of the National Academy of Sciences, "suggests that using these modifications when communicating with young assists them in learning how to produce these calls themselves,” she says.
Talk to me
Learning language is hard. Yet infants, incredibly, sop up the verbal soup around them and learn how to construct sentences with the appropriate structure.
How? The answer has to do with how we intuitively talk to babies.
Making our sentences shorter strips away unnecessary words. Emphasizing sounds makes words clearer. And — importantly — we increase the pitch of our speech.
Studies have shown these vocal characteristics grab and hold the attention of children far better than normal adult-directed speech.
And when parents are coached on how to use motherese, their child babbles more and has a bigger vocabulary as a toddler.
Language scientists make an important distinction between motherese and what is commonly referred to as baby talk.
The latter, they say, consists of largely made-up words with inconsistent and incorrect grammar and syntax:
It’s the difference between telling a baby, “Look at that DOGGY!” and “Wook at dat widdle puppy-wuppy!”
That’s why the list of species that use the more accurate motherese has so far been limited.
“Vocal learning is actually very rare. Out of the millions of species that use sound to communicate, there’s just a few groups that must learn their vocal communication systems,” Anderson says.
Signature sounds

When Sayigh began working with a pod of wild bottlenose dolphins in Florida’s Sarasota Bay in the late 1980s, she observed that these marine mammals shared many characteristics with humans.
For instance, mothers and their offspring live within intricate social groups held together by a complex language of songs and whistles.
Over time, the biologist began to wonder whether females use motherese to communicate with their calves.
Bottlenose mothers nurse their young for two years, and the animals generally stay with her until they’re between three to six years old, learning how to hunt, navigate, and stay safe in the ocean.
Father dolphins generally aren’t involved in rearing their young.
Dolphin communication is profoundly different from how humans talk.
The most common dolphin vocalization is their signature whistle, a sound unique to each dolphin that serves as the cetacean equivalent of a “Hello, My Name is…” sticker.
Dolphins, however, don’t use another animal’s signature whistle to direct communication.
Instead, they repeat their own signature whistle and listen for another dolphin to respond with their own.
It’s analogous to your mother standing on your front porch and yelling her own name to summon her kids, says Kelly Jaakkola, a cognitive psychologist and marine mammal biologist at the nonprofit Dolphin Research Center in Grassy Key, Florida.
As part of their ongoing research, the Sarasota Dolphin Research Program performs regular veterinary exams on the wild dolphins, which have gotten used to the scientists’ presence.
During these exams, Sayigh and colleagues would sometimes attach a small recording device called a hydrophone to a mother dolphin’s forehead with a fist-size suction cup that the researchers later removed.
By analyzing recordings of 19 different female dolphins over 34 years, Sayigh found that the signature whistles of dolphin mothers had a greater range of frequencies — the high pitches were higher and the lows were lower — when their calves were nearby.
The high-pitched sounds are out of the range of human hearing.
Endless questions
To Jaakkola, who wasn’t part of the study, this work was “a fantastic first step.”
“The data here are beautiful,” she says. “The trick comes in possible interpretations of what’s happening.”
The work only looks at dolphin communication in one specific context, which means scientists can’t say definitively that the dolphins are speaking to their calves in motherese, Jaakkola says.
For instance, the results could be due to vocal changes in caused by lactation, or some other unknown variable.
However, in a 2017 study, researchers noticed an identical change in mother dolphins’ signature whistles while examining the effects of human-made noise, which lends support to the authors’ conclusions that the dolphins change their pitch as needed.
For Sayigh, the questions are endless — and fascinating.
“I just can't even articulate what an amazing project it is. I could spend three lifetimes there,” she says.

#dolphins#infant-directed speech#motherese#bottlenose dolphins#Proceedings of the National Academy of Sciences#baby talk#Sarasota Bay#Florida#signature whistle#Dolphin Research Center#Sarasota Dolphin Research Program#hydrophone#National Geographic#Nat Geo#aquatic mammals
6 notes
·
View notes
Text
The Quran, the holy book of Islam, is revered by Muslims as the word of God. It is not only a religious text but also contains numerous scientific references that have been seen by many as miracles. These scientific miracles are believed to be evidence of the divine nature of the Quran and its ability to provide knowledge that was ahead of its time. Here are some examples of scientific miracles found in the Quran:
Embryology: The Quran contains detailed descriptions of human embryonic development, which were not known at the time it was revealed. It accurately describes stages such as fertilization, implantation, and formation of bones and muscles.
Creation from Water: The Quran mentions that all living things are created from water, which aligns with modern scientific understanding that water is essential for life.
Mountains as Stabilizers: The Quran refers to mountains as stabilizers on Earth's surface, preventing it from shaking or swaying excessively. This concept correlates with modern geological understanding that mountains play a crucial role in maintaining tectonic stability.
Celestial Orbits: The Quran mentions the movement and orbiting of celestial bodies like the sun and moon. This aligns with our current knowledge about their orbital paths around other celestial objects.
Oceanography: The Quran describes the distinct properties of saltwater and freshwater and states that they do not mix completely when they meet - something that was only discovered much later through advancements in oceanographic research.
These examples highlight some instances where scientific information mentioned in the Quran has been seen by many as miraculous due to its alignment with modern scientific discoveries.
#miracles of the quran#scientific miracles in the quran#quranic verses#verses of the quran#holy quran#islam#qur'anic verse#quran#scientific accuracy of the quran#quran and modern science#miracles in the quran#scientific facts in the quran#quran and scientific discoveries#quran and embryology#astronomy in the quran#geology in the quran#biology in the quran#physics in the quran#miracles of creation in the quran#Spotify
6 notes
·
View notes
Text
USVs vs. ROVs vs. UAVs: Understanding the Differences and Applications

As technological advancements continue to transform research and industry, understanding the unique roles of Unmanned Surface Vehicles (USVs), Remotely Operated Vehicles (ROVs), and Unmanned Aerial Vehicles (UAVs) becomes increasingly important. Each of these platforms serves specialised functions across diverse environments—sea, underwater, and air.
USVs operate on the water’s surface, providing real-time data for oceanographic research, maritime surveillance, and environmental monitoring. These vessels are ideal for long-duration missions and can be equipped with various sensors. In contrast, ROVs are deployed underwater to explore deep-sea environments. They are vital in marine biology, offshore infrastructure inspection, and underwater archaeology. UAVs, commonly known as drones, offer a bird’s-eye view and are widely used for land surveying, agriculture, disaster management, and aerial photography.
Also Read: The Evolving Significance of Unmanned Surface Vehicles (USVs) in Defense
While each system has its own strengths, they can be integrated for comprehensive data collection. For instance, combining UAVs and USVs enhances coastal mapping accuracy, while ROVs add value to underwater studies. Learn more about how ROVs help scientists study underwater caverns and sinkholes.When it comes to marine exploration and ocean surface monitoring, choose innovation you can trust from the best Unmanned Surface Vehicle manufacturer in San Jose, California.
0 notes
Text
Imaging technique removes the effect of water in underwater scenes
New Post has been published on https://sunalei.org/news/imaging-technique-removes-the-effect-of-water-in-underwater-scenes/
Imaging technique removes the effect of water in underwater scenes

The ocean is teeming with life. But unless you get up close, much of the marine world can easily remain unseen. That’s because water itself can act as an effective cloak: Light that shines through the ocean can bend, scatter, and quickly fade as it travels through the dense medium of water and reflects off the persistent haze of ocean particles. This makes it extremely challenging to capture the true color of objects in the ocean without imaging them at close range.
Now a team from MIT and the Woods Hole Oceanographic Institution (WHOI) has developed an image-analysis tool that cuts through the ocean’s optical effects and generates images of underwater environments that look as if the water had been drained away, revealing an ocean scene’s true colors. The team paired the color-correcting tool with a computational model that converts images of a scene into a three-dimensional underwater “world,” that can then be explored virtually.
The researchers have dubbed the new tool “SeaSplat,” in reference to both its underwater application and a method known as 3D gaussian splatting (3DGS), which takes images of a scene and stitches them together to generate a complete, three-dimensional representation that can be viewed in detail, from any perspective.
“With SeaSplat, it can model explicitly what the water is doing, and as a result it can in some ways remove the water, and produces better 3D models of an underwater scene,” says MIT graduate student Daniel Yang.
The researchers applied SeaSplat to images of the sea floor taken by divers and underwater vehicles, in various locations including the U.S. Virgin Islands. The method generated 3D “worlds” from the images that were truer and more vivid and varied in color, compared to previous methods.
The team says SeaSplat could help marine biologists monitor the health of certain ocean communities. For instance, as an underwater robot explores and takes pictures of a coral reef, SeaSplat would simultaneously process the images and render a true-color, 3D representation, that scientists could then virtually “fly” through, at their own pace and path, to inspect the underwater scene, for instance for signs of coral bleaching.
“Bleaching looks white from close up, but could appear blue and hazy from far away, and you might not be able to detect it,” says Yogesh Girdhar, an associate scientist at WHOI. “Coral bleaching, and different coral species, could be easier to detect with SeaSplat imagery, to get the true colors in the ocean.”
Girdhar and Yang will present a paper detailing SeaSplat at the IEEE International Conference on Robotics and Automation (ICRA). Their study co-author is John Leonard, professor of mechanical engineering at MIT.
Aquatic optics
In the ocean, the color and clarity of objects is distorted by the effects of light traveling through water. In recent years, researchers have developed color-correcting tools that aim to reproduce the true colors in the ocean. These efforts involved adapting tools that were developed originally for environments out of water, for instance to reveal the true color of features in foggy conditions. One recent work accurately reproduces true colors in the ocean, with an algorithm named “Sea-Thru,” though this method requires a huge amount of computational power, which makes its use in producing 3D scene models challenging.
In parallel, others have made advances in 3D gaussian splatting, with tools that seamlessly stitch images of a scene together, and intelligently fill in any gaps to create a whole, 3D version of the scene. These 3D worlds enable “novel view synthesis,” meaning that someone can view the generated 3D scene, not just from the perspective of the original images, but from any angle and distance.
But 3DGS has only successfully been applied to environments out of water. Efforts to adapt 3D reconstruction to underwater imagery have been hampered, mainly by two optical underwater effects: backscatter and attenuation. Backscatter occurs when light reflects off of tiny particles in the ocean, creating a veil-like haze. Attenuation is the phenomenon by which light of certain wavelengths attenuates, or fades with distance. In the ocean, for instance, red objects appear to fade more than blue objects when viewed from farther away.
Out of water, the color of objects appears more or less the same regardless of the angle or distance from which they are viewed. In water, however, color can quickly change and fade depending on one’s perspective. When 3DGS methods attempt to stitch underwater images into a cohesive 3D whole, they are unable to resolve objects due to aquatic backscatter and attenuation effects that distort the color of objects at different angles.
“One dream of underwater robotic vision that we have is: Imagine if you could remove all the water in the ocean. What would you see?” Leonard says.
A model swim
In their new work, Yang and his colleagues developed a color-correcting algorithm that accounts for the optical effects of backscatter and attenuation. The algorithm determines the degree to which every pixel in an image must have been distorted by backscatter and attenuation effects, and then essentially takes away those aquatic effects, and computes what the pixel’s true color must be.
Yang then worked the color-correcting algorithm into a 3D gaussian splatting model to create SeaSplat, which can quickly analyze underwater images of a scene and generate a true-color, 3D virtual version of the same scene that can be explored in detail from any angle and distance.
The team applied SeaSplat to multiple underwater scenes, including images taken in the Red Sea, in the Carribean off the coast of Curaçao, and the Pacific Ocean, near Panama. These images, which the team took from a pre-existing dataset, represent a range of ocean locations and water conditions. They also tested SeaSplat on images taken by a remote-controlled underwater robot in the U.S. Virgin Islands.
From the images of each ocean scene, SeaSplat generated a true-color 3D world that the researchers were able to virtually explore, for instance zooming in and out of a scene and viewing certain features from different perspectives. Even when viewing from different angles and distances, they found objects in every scene retained their true color, rather than fading as they would if viewed through the actual ocean.
“Once it generates a 3D model, a scientist can just ‘swim’ through the model as though they are scuba-diving, and look at things in high detail, with real color,” Yang says.
For now, the method requires hefty computing resources in the form of a desktop computer that would be too bulky to carry aboard an underwater robot. Still, SeaSplat could work for tethered operations, where a vehicle, tied to a ship, can explore and take images that can be sent up to a ship’s computer.
“This is the first approach that can very quickly build high-quality 3D models with accurate colors, underwater, and it can create them and render them fast,” Girdhar says. “That will help to quantify biodiversity, and assess the health of coral reef and other marine communities.”
This work was supported, in part, by the Investment in Science Fund at WHOI, and by the U.S. National Science Foundation.
0 notes
Text
Warning Signs That Could Save Your Life Before Disaster Strikes

Spotting a rainbow signifies good fortune ahead, but encountering a deep-sea fish suggests something unfortunate may be on the horizon. Let's explore ancient beliefs and their possible interpretations. A Sunny Day in California Turns Mysterious In reality, during August 2020, people began their day like any other in California. It was bright and sunny, so they chose to bask in the sun at the beach. While snorkeling and kayaking, one person noticed something unusual: a doomsday fish. The creature measured 12 feet long and is known as an oarfish; approximately only 20 of them have appeared on California shores since 1901. Oarfish as Harbingers of Calamity Oarfish inhabit the ocean's depths, but what connects them to Doomsday? Japanese mythology labels them as harbingers of calamity. Once mistaken for sea serpents, these beings are believed to be the messengers of the stunning palace located at the ocean's depths. Interestingly, they only leave this palace to alert humans of impending disasters. Consequently, they are often viewed as ill omens, and spotting one may foreshadow a tsunami or earthquake soon after. Even oceanographers acknowledge this prevalent belief. Mysterious Coincidences in Earthquakes and Oarfish Sightings Here’s where it gets intriguing: the oarfish washed ashore near San Diego on August 10, and just two days later, a magnitude 4.4 earthquake struck Los Angeles. This isn’t the first instance; in 2011, Japan experienced a similar event, where around 20 oarfish were discovered along the beaches and coastlines of Tohoku, shortly before a magnitude 9 earthquake and tsunami ravaged the area. A comparable occurrence took place in the Philippines on February 8, 2017, when an oarfish was spotted, and two days later, a magnitude 6.7 earthquake hit the city and surrounding regions. Scientific Perspectives on Animal Behavior and Natural Disasters While there's no definitive evidence linking these events, the Seismological Society of America insists that it is mere superstition. A recent study analyzed these coincidences and determined that this connection is statistically false. Can we truly say this transpired completely unexpectedly? Throughout history, humans have observed unusual animal behavior prior to natural calamities: earthquakes, floods, and tsunamis. It seems that animals possess a sensitivity to phenomena beyond our perception. In fact, there is substantial scientific support for this notion. How Animals Detect Environmental Shifts Before Disasters Research indicates that animals can detect subtle environmental shifts, such as changes in the earth's electromagnetic field or low-frequency sounds—elements that typically elude human awareness. This phenomenon is due to the fact that most animals have a broader hearing range compared to humans and have heightened senses that allow them to detect gases released from the earth. This theory gained prominence following the devastating tsunami that swept through numerous cities and villages in Indonesia in 2004. Many man-made warning systems failed to function and did not fulfill their purpose of alerting humans about the disaster. The Role of Animals as Natural Warning Systems This isn't the first time that humans have depended on animals to preserve their lives. The earliest documented incident dates back to 373 BCE. Although I wasn't there, the Greek historian Xenophon recorded how local residents witnessed rats, weasels, and snakes fleeing their town just before a massive earthquake struck. Recent Studies and Findings in Animal Behavior To investigate this, scientists affixed bio-logging tags to cows, sheep, and dogs in Italy for a period of six months. During this time, official records noted over 18,000 earthquakes in the region. The most astonishing finding was that animals altered their behavior up to 20 hours prior to an earthquake. Just before an earthquake, a phenomenon known as positive holes occurs—a surge of electricity that travels from the crust to the earth's surface, affecting the air molecules above where they emerge. Animals can detect these changes. Animal Sensitivity to Groundwater Variations and Magnetic Fields Furthermore, evidence suggests that animals may sense variations in groundwater ahead of earthquakes. The stress on fault lines can release radon gas, altering the chemistry of groundwater, which animals dependent on it may detect and respond to. Birds are also highly sensitive to fluctuations in the earth's magnetic field, which may occur just before a quake. Mount Etna and the Role of Goats in Predicting Disasters Another study was conducted near Mount Etna, located in Sicily, Italy, one of the planet's most active volcanoes. In 2002, a substantial eruption devastated a ski lift, two hotels, and a series of shops nearby. Over the years, researchers tracked goats living in the area, and their pivotal moment came in 2012 when the goats began behaving erratically six hours before Etna erupted. Birds and Their Ability to Evacuate Ahead of Disasters In 2014, a team of scientists observing golden-winged warblers in Tennessee noticed an unusual behavior; the birds had veered off course from their usual breeding grounds. These tiny creatures traveled 435 miles from the Cumberland Mountains after migrating over 3,000 miles from South America. Shortly after the birds departed, over 80 tornadoes struck the area, causing damages exceeding a billion dollars. Ongoing Research and Final Thoughts on Animal Behavior as Disaster Warnings Meanwhile, an ongoing project by France's National Museum of Natural History is tracking over 100 birds on their annual migration across the Pacific, utilizing data from the International Space Station. They aim to learn how these small creatures respond to natural hazards along their journey. However, not all scientists are convinced. Some argue that while animals may be attuned to environmental changes, predicting disasters based on their actions is too precarious. Conclusion: What Humans Can Learn From Animal Behavior Although humans lack the extraordinary abilities to predict disasters, we possess indicators that may assist us in being alert. The next time you find yourself in a location where lightning is imminent, your hair will signal—if it stands on end, it suggests that lightning is targeting you. In that case, seek shelter and find a safe place to stay; that’s the best response in such situations. That’s all for today. If you’ve satisfied your curiosity, consider liking this video and sharing it with your friends. If you’d like more content, just click on these videos. Read the full article
0 notes
Text
Data Science for Oceanography
The vast and enigmatic oceans, covering over 70% of the Earth's surface, have always intrigued scientists. However, despite centuries of exploration, much of the ocean remains uncharted and unexplored. Enter data science, a transformative tool revolutionizing our understanding of oceanography. By harnessing the power of data, we can unlock the mysteries of the deep and address critical challenges facing our marine ecosystems.
Transforming Oceanographic Research
Oceanography involves the study of physical, chemical, biological, and geological aspects of the ocean. Traditional methods of oceanographic research often involved manual data collection and laborious analysis, limiting the scope and scale of studies. Today, with the advent of advanced technologies and methodologies in data science, researchers can process vast amounts of oceanic data swiftly and accurately.
The role of a data scientist in oceanography is pivotal. Equipped with skills from a comprehensive data science course, these professionals can analyze data from various sources like satellites, underwater sensors, and autonomous vehicles. This analysis helps in understanding ocean currents, predicting weather patterns, and studying marine biodiversity. Through data science training, researchers are better prepared to tackle the complexities of ocean data.
The Power of Big Data in Oceanography
The oceans generate an enormous amount of data every second. From temperature readings and salinity levels to marine life tracking and ocean floor mapping, the data points are virtually endless. Managing and interpreting this data requires robust analytical skills and tools, which are often covered in an data scientist training program.
Data science with Python is particularly beneficial in this context. Python's powerful libraries and frameworks, such as Pandas, NumPy, and SciPy, allow researchers to perform complex data manipulations and visualizations. By undertaking a data science online course, aspiring oceanographers can gain proficiency in these tools, enabling them to turn raw data into meaningful insights.
Real-World Applications
One of the most significant contributions of data science to oceanography is in climate change research. By analyzing historical and real-time oceanographic data, scientists can model the impacts of climate change on sea levels, ocean temperatures, and marine ecosystems. Online data scientist courses equip students with the skills to handle such intricate data analysis tasks.
Marine conservation is another critical area where data science makes a difference. Through data analysis, scientists can monitor endangered species, assess the health of coral reefs, and track illegal fishing activities. A data scientist certification can provide the necessary credentials for professionals to work on such vital conservation projects.
Enhancing Predictive Capabilities
Predicting natural disasters like tsunamis and hurricanes has always been a priority in oceanographic studies. With the integration of data science, predictive models have become more accurate and reliable. By enrolling in a top data science institute, researchers can learn advanced modeling techniques that improve their predictive capabilities.
For instance, machine learning algorithms, a staple in many data science courses, can analyze patterns in historical data to forecast future events. This ability to predict and prepare for natural disasters can save lives and protect coastal communities. Through data scientist training, individuals can contribute significantly to disaster management and mitigation efforts.
What is S-Curve or Sigmoid Curve
youtube
The Future of Oceanography
As technology advances, the synergy between data science and oceanography will only grow stronger. Emerging fields like artificial intelligence and machine learning are poised to revolutionize how we study and interact with the ocean. Online data scientist training programs are continually evolving to include these cutting-edge technologies, ensuring that the next generation of oceanographers is well-equipped to face future challenges.
Moreover, the accessibility of education has improved significantly. Aspiring data scientists can now enroll in online data scientist courses from the comfort of their homes. These courses offer flexibility and comprehensive curriculums that cover everything from basic data handling to advanced analytical techniques. The convenience of online data scientist training ensures that more individuals can contribute to oceanographic research.
Data science is undoubtedly transforming oceanography. From enhancing our understanding of marine ecosystems to improving predictive models for natural disasters, the applications are vast and varied. By participating in a data science course, individuals can acquire the skills needed to make a substantial impact in this field.
The integration of data science with Python and other analytical tools has made it possible to process and interpret vast amounts of oceanic data efficiently. With the availability of data scientist certification programs and data science online courses, there has never been a better time to embark on a career in this exciting intersection of technology and marine science.
As we continue to explore the depths of our oceans, the role of the data scientist will be more crucial than ever. Through continuous learning and application of data science techniques, we can unlock the mysteries of the deep and safeguard our marine environments for future generations. The journey towards understanding our oceans is ongoing, and data science is leading the way.
What is r2 score?
youtube
0 notes
Text
The sardine run is well known among residents of the KwaZulu-Natal coastline that runs along South Africa’s east coast. Every year in winter, sardines migrate close to the shoreline. The event is well documented in the local press.
The sardine run is of great economic importance because it provides prime fishing opportunities and attracts large numbers of tourists who come for dolphin and shark sightings. Similar migration patterns are seen in Sweden, Chile, and the Pacific Ocean.
The sardine run is what scientists term a “phenological event” – a biological event that occurs at the same time every year. Phenological events are standard for plants and include the appearance of leaf and flower buds, blossoming, fruit development, fruit harvest and leaf colouration and fall.
For animals, the events are more varied and include hibernation, hatching, animal calls, moulting, and in the case of birds, game and fish (among others) migration.
Scientists have become very interested in phenology over the past few decades, because it’s one of the most sensitive biological indicators of climate change. As temperatures increase, the plants or animals experience their triggers for spring earlier and their triggers for winter later. As a result, many of these phenological events are occurring at different times of the year.
In a recently published paper in the South African Journal of Science, we examined newspaper articles written between 1946 and 2012 that reported on the South African sardine run. From these articles we established an annual date of the peak of the sardine run.
We then explored how the dates of the sardine run have changed over the 65-year period, and statistically examined oceanographic and climatological factors to determine the cause of this change. We did this because there are very few phenological records for South Africa and consequently, the rate of phenological shifts and the associated climate signal is largely unknown.
Phenology is highly species and location specific, and so it’s important to reconstruct records for as many locations and as many plants and animals as possible. It’s also known that climate affects the timing of phenological events globally, including marine environments.
Our research sought to determine changes in the pattern of the sardine run and, possibly, what might be behind them. The hope is that this can help fisheries plan for delays or failed migrations which are happening more frequently.
Nature’s biological clock
Phenological shifts are specific to species and location. For example, Granny Smith apple trees are flowering approximately four days earlier for each 1°C increase in temperature in Poland. In South Africa, these Granny Smith apples are flowering two days earlier for each 1°C increase in temperature.
For many species these events are happening earlier. This is because they are spring events and, under climate change, the temperatures that are perceived by plants and animals to be the onset of spring are occurring in late winter. For events that occur in autumn, the events are often occurring later, because the cooling that marks the start of winter has not yet occurred.
This is the case for the South African sardines.
We found that over the 66-year period, sardines arrived off the coast of Durban increasingly late – at a rate of 1.3 days later per decade. Over the six decades this has meant the date has changed from arrivals as early as mid-June at the beginning of the record to dates as late as mid-July in the last decade.
Through statistical analysis comparing the constructed phenological record with climate and ocean data, we hypothesise that the delay could be caused by two things.
First, the ocean water is warmer. Sardines can tolerate a maximum surface temperature of 21°C. But this temperature isn’t being reached consistently at the same time every year due to changes in ocean temperature.
The second factor is mid-latitude cyclones. There have been an increasing number of these in the east coast region. The relationship between them and the sardine run is complex and difficult to pin down. But this has also been recorded for sardine migration in the North Pacific.
Why it matters
The delay is concerning. First, the large influx of sardines is important for the fishery industry. If the sardine run occurs at an unexpected time, or doesn’t occur at all, supply chains are disrupted and fishermen are placed at economic risk.
The unpredictability is also a problem for tourism. The sardine run attracts visitors who are keen on shark and dolphin sightings and may leave disappointed.
The delays in the sardine run also result in food shortages for predators such as sharks, which feed on the sardines. This is termed a species mismatch, and is increasingly observed as a result of climate change induced phenological shifts, where predators and their prey are no longer in the same place at the same time. This is because each species has its own unique trigger for a particular activity.
1 note
·
View note
Text
AI helps detecting plastic in oceans
22.11.23 - A research team from EPFL and Wageningen University has developed a new artificial intelligence model that recognises floating plastics much more accurately in satellite images than before. This could help to systematically remove plastic litter from the oceans with ships. Our society relies heavily on plastic products and the amount of plastic waste is expected to increase in the future. If not properly discarded or recycled, much of it accumulates in rivers and lakes. Eventually it will flow into the oceans, where it can form aggregations of marine debris together with natural materials like driftwood and algae. A new study from Wageningen University and EPFL researchers, recently published in Cell iScience, has developed an artificial intelligence-based detector that estimates the probability of marine debris shown in satellite images. This could help to systematically remove plastic litter from the oceans with ships. Automatic analysis Accumulations of marine debris are visible in freely available Sentinel-2 satellite images from the European Space Agency that capture coastal areas every 2-5 days worldwide on land masses and coastal areas. Because these amount to terabytes of data, the data needs to be analysed automatically through artificial intelligence models like deep neural networks. Marc Rußwurm, Assistant Professor at Wageningen University and former researcher at EPFL: “These models learn from examples provided by oceanographers and remote sensing specialists, who visually identified several thousand instances of marine debris in satellite images on locations across the globe. In this way they ‘trained’ the model to recognise plastic debris.” Devis Tuia, associate professor at EPFL and Director of the Sion-based Laboratory of Computational Science for the Environment and Earth Observation (ECEO), is corresponding author of the study. The detector remains accurate even in more challenging conditions. For example when cloud cover and atmospheric haze make it difficult for existing models to identify marine debris precisely. Marc Rußwurm, Assistant Professor at Wageningen University and former researcher at EPFL Improved detection The researchers developed an AI-based marine debris detector that estimates the probability of marine debris present for every pixel in Sentinel-2 satellite images. The detector is trained following data-centric AI principles that aim to make best use of the limited training data that is available for this problem. One example is the design of a computer vision algorithm that snaps manual annotations from experts precisely to the debris visible in the images. With this tool, oceanographers and remote sensing experts can provide more training data examples by being less precise in the manual clicking of outlines. Overall, this training method combined with the refinement algorithm teaches the deep artificial intelligence detection model to better predict marine debris objects than previous approaches. Rußwurm: “The detector remains accurate even in more challenging conditions. For example when cloud cover and atmospheric haze make it difficult for existing models to identify marine debris precisely.” Heavy precipitation over Durban, South Africa on 22 April 2019, 19:00. Continued precipitation between 18th and 22nd of April lead to the Durban Easter floods 2019 that washed substantial amounts of plastic litter into the Indian ocean, which are visible in Satellite images. Map data © 2023 Google. Precipitation data © JAXA Global Rainfall Watch Following plastic debris Detecting plastics in marine debris under difficult atmospheric conditions with clouds and haze is particularly important, as often plastics are washed into open waters after rain and flood events. This is shown by the Durban Easter floods in South Africa: In 2019 a long period of rain led to overflowing rivers, resulting in much more litter being washed away than normally. It was taken… http://actu.epfl.ch/news/ai-helps-detecting-plastic-in-oceans-5 (Source of the original content)
0 notes
Text
In a Warming World, NASA’s Eyes Offer Crucial Views of Hurricanes
June 1 marks the start of hurricane season in the Atlantic Ocean. Last year’s hurricane season saw a record-setting 30 named storms. Twelve made landfall in the United States, also a record. From space, NASA has unique views of hurricanes and works with other government agencies -- like the National Oceanographic and Atmospheric Administration (NOAA) -- to better understand individual storms and entire hurricane seasons.
Here, five ways NASA is changing hurricane science:
1. We can see storms from space
From space, we can see so much more than what’s visible to the naked eye. Among our missions, NASA and NOAA have joint satellite missions monitoring storms in natural color -- basically, what our eyes see -- as well as in other wavelengths of light, which can help identify features our eyes can’t on their own. For instance, images taken in infrared can show the temperatures of clouds, as well as allow us to track the movement of storms at night.
2. We can see inside hurricanes in 3D
If you’ve ever had a CT scan or X-ray done, you know how important 3D imagery can be to understanding what’s happening on the inside. The same concept applies to hurricanes. Our Global Precipitation Measurement mission’s radar and microwave instruments can see through storm clouds to see the precipitation structure of the storm and measure how much total rain is falling as a result of the storm. This information helps scientists understand how the storm may change over time and understand the risk of severe flooding.
We can even virtually fly through hurricanes!
3. We’re looking at how climate change affects hurricane behavior
Climate change is likely causing storms to behave differently. One change is in how storms intensify: More storms are increasing in strength quickly, a process called rapid intensification, where hurricane wind speeds increase by 35 mph (or more) in just 24 hours.
In 2020, a record-tying nine storms rapidly intensified. These quick changes in storm strength can leave communities in their path without time to properly prepare.
Researchers developed a machine learning model that could more accurately detect rapidly intensifying storms.

It’s not just about how quickly hurricanes gain strength. We’re also looking at how climate change may be causing storms to move more slowly, which makes them more destructive. These “stalled” storms can slow to just a few miles an hour, dumping rain and damaging winds on one location at a time. Hurricane Dorian, for example, stalled over Grand Bahama and left catastrophic damage in its wake. Hurricanes Harvey and Florence experienced stalling as well, both causing major flooding.
4. We can monitor damage done by hurricanes
Hurricane Maria reshaped Puerto Rico’s forests. The storm destroyed so many large trees that the overall height of the island’s forests was shortened by one-third. Measurements from the ground, the air, and space gave researchers insights into which trees were more susceptible to wind damage.
Months after Hurricane Maria, parts of Puerto Rico still didn’t have power. Using satellite data, researchers mapped which neighborhoods were still dark and analyzed demographics and physical attributes of the areas with the longest wait for power.
5. We help communities prepare for storms and respond to their aftermath
The data we collect is available for free to the public. We also partner with other federal agencies, like the Federal Emergency Management Agency (FEMA), and regional and local governments to help prepare for and understand the impacts of disasters like hurricanes.
In 2020, our Disasters Program provided data to groups in Alabama, Louisiana, and Central America to identify regions significantly affected by hurricanes. This helps identify vulnerable communities and make informed decisions about where to send resources.

The 2021 Atlantic hurricane season starts today, June 1. Our colleagues at NOAA are predicting another active season, with an above average number of named storms. At NASA, we’re developing new technology to study how storms form and behave, including ways to understand Earth as a system. Working together with our partners at NOAA, FEMA and elsewhere, we’re ready to help communities weather another year of storms.
Bonus: We see storms on other planets, too!
Earth isn’t the only planet with storms. From dust storms on Mars to rains made of glass, we study storms and severe weather on planets in our solar system and beyond. Even the Sun has storms. Jupiter’s Great Red Spot, for instance, is a hurricane-like storm larger than the entire Earth.
Make sure to follow us on Tumblr for your regular dose of space: http://nasa.tumblr.com.
2K notes
·
View notes
Text
A carbon-lite atmosphere could be a sign of water and life on other terrestrial planets, MIT study finds
New Post has been published on https://thedigitalinsider.com/a-carbon-lite-atmosphere-could-be-a-sign-of-water-and-life-on-other-terrestrial-planets-mit-study-finds/
A carbon-lite atmosphere could be a sign of water and life on other terrestrial planets, MIT study finds

Scientists at MIT, the University of Birmingham, and elsewhere say that astronomers’ best chance of finding liquid water, and even life on other planets, is to look for the absence, rather than the presence, of a chemical feature in their atmospheres.
The researchers propose that if a terrestrial planet has substantially less carbon dioxide in its atmosphere compared to other planets in the same system, it could be a sign of liquid water — and possibly life — on that planet’s surface.
What’s more, this new signature is within the sights of NASA’s James Webb Space Telescope (JWST). While scientists have proposed other signs of habitability, those features are challenging if not impossible to measure with current technologies. The team says this new signature, of relatively depleted carbon dioxide, is the only sign of habitability that is detectable now.
“The Holy Grail in exoplanet science is to look for habitable worlds, and the presence of life, but all the features that have been talked about so far have been beyond the reach of the newest observatories,” says Julien de Wit, assistant professor of planetary sciences at MIT. “Now we have a way to find out if there’s liquid water on another planet. And it’s something we can get to in the next few years.”
The team’s findings appear today in Nature Astronomy. De Wit co-led the study with Amaury Triaud of the University of Birmingham in the UK. Their MIT co-authors include Benjamin Rackham, Prajwal Niraula, Ana Glidden Oliver Jagoutz, Matej Peč, Janusz Petkowski, and Sara Seager, along with Frieder Klein at the Woods Hole Oceanographic Institution (WHOI), Martin Turbet of Ècole Polytechnique in France, and Franck Selsis of the Laboratoire d’astrophysique de Bordeaux.
Beyond a glimmer
Astronomers have so far detected more than 5,200 worlds beyond our solar system. With current telescopes, astronomers can directly measure a planet’s distance to its star and the time it takes it to complete an orbit. Those measurements can help scientists infer whether a planet is within a habitable zone. But there’s been no way to directly confirm whether a planet is indeed habitable, meaning that liquid water exists on its surface.
Across our own solar system, scientists can detect the presence of liquid oceans by observing “glints” — flashes of sunlight that reflect off liquid surfaces. These glints, or specular reflections, have been observed, for instance, on Saturn’s largest moon, Titan, which helped to confirm the moon’s large lakes.
Detecting a similar glimmer in far-off planets, however, is out of reach with current technologies. But de Wit and his colleagues realized there’s another habitable feature close to home that could be detectable in distant worlds.
“An idea came to us, by looking at what’s going on with the terrestrial planets in our own system,” Triaud says.
Venus, Earth, and Mars share similarities, in that all three are rocky and inhabit a relatively temperate region with respect to the sun. Earth is the only planet among the trio that currently hosts liquid water. And the team noted another obvious distinction: Earth has significantly less carbon dioxide in its atmosphere.
“We assume that these planets were created in a similar fashion, and if we see one planet with much less carbon now, it must have gone somewhere,” Triaud says. “The only process that could remove that much carbon from an atmosphere is a strong water cycle involving oceans of liquid water.”
Indeed, the Earth’s oceans have played a major and sustained role in absorbing carbon dioxide. Over hundreds of millions of years, the oceans have taken up a huge amount of carbon dioxide, nearly equal to the amount that persists in Venus’ atmosphere today. This planetary-scale effect has left Earth’s atmosphere significantly depleted of carbon dioxide compared to its planetary neighbors.
“On Earth, much of the atmospheric carbon dioxide has been sequestered in seawater and solid rock over geological timescales, which has helped to regulate climate and habitability for billions of years,” says study co-author Frieder Klein.
The team reasoned that if a similar depletion of carbon dioxide were detected in a far-off planet, relative to its neighbors, this would be a reliable signal of liquid oceans and life on its surface.
“After reviewing extensively the literature of many fields from biology, to chemistry, and even carbon sequestration in the context of climate change, we believe that indeed if we detect carbon depletion, it has a good chance of being a strong sign of liquid water and/or life,” de Wit says.
A roadmap to life
In their study, the team lays out a strategy for detecting habitable planets by searching for a signature of depleted carbon dioxide. Such a search would work best for “peas-in-a-pod” systems, in which multiple terrestrial planets, all about the same size, orbit relatively close to each other, similar to our own solar system. The first step the team proposes is to confirm that the planets have atmospheres, by simply looking for the presence of carbon dioxide, which is expected to dominate most planetary atmospheres.
“Carbon dioxide is a very strong absorber in the infrared, and can be easily detected in the atmospheres of exoplanets,” de Wit explains. “A signal of carbon dioxide can then reveal the presence of exoplanet atmospheres.”
Once astronomers determine that multiple planets in a system host atmospheres, they can move on to measure their carbon dioxide content, to see whether one planet has significantly less than the others. If so, the planet is likely habitable, meaning that it hosts significant bodies of liquid water on its surface.
But habitable conditions doesn’t necessarily mean that a planet is inhabited. To see whether life might actually exist, the team proposes that astronomers look for another feature in a planet’s atmosphere: ozone.
On Earth, the researchers note that plants and some microbes contribute to drawing carbon dioxide, although not nearly as much as the oceans. Nevertheless, as part of this process, the lifeforms emit oxygen, which reacts with the sun’s photons to transform into ozone — a molecule that is far easier to detect than oxygen itself.
The researchers say that if a planet’s atmosphere shows signs of both ozone and depleted carbon dioxide, it likely is a habitable, and inhabited world.
“If we see ozone, chances are pretty high that it’s connected to carbon dioxide being consumed by life,” Triaud says. “And if it’s life, it’s glorious life. It would not be just a few bacteria. It would be a planetary-scale biomass that’s able to process a huge amount of carbon, and interact with it.”
The team estimates that NASA’s James Webb Space Telescope would be able to measure carbon dioxide, and possibly ozone, in nearby, multiplanet systems such as TRAPPIST-1 — a seven-planet system that orbits a bright star, just 40 light years from Earth.
“TRAPPIST-1 is one of only a handful of systems where we could do terrestrial atmospheric studies with JWST,” de Wit says. “Now we have a roadmap for finding habitable planets. If we all work together, paradigm-shifting discoveries could be done within the next few years.”
#Astronomy#Astrophysics#atmosphere#Bacteria#Biology#biomass#carbon#Carbon dioxide#Carbon materials#Carbon sequestration#change#chemical#chemistry#climate#climate change#Discoveries#EAPS#earth#Earth and atmospheric sciences#exoplanet#Exoplanets#Features#France#indeed#it#James Webb Space Telescope#jwst#Kavli Institute#Lakes#LED
2 notes
·
View notes