#CapstoneProject
Explore tagged Tumblr posts
Visit Tumblr Blog
Explore Tumblr blogs with no restrictions, modern design and the best experience.
Last Seen Tumblr Blogs


Fun Fact
Tumblr is used by 21% of adults online aged 18-29 years.
Text
Final Reflection Video!!!
youtube
4 notes
·
View notes
Link
#brilliance #capstoneproject #showcasing #student #research #education #innovation #excellence #studenttalent #intellectualinquiry #technicalproficiency #advising #passion #curiosity #learningobjectives #researchtools #partnerships #financialsupport #presentation #exhibition #archive #recommendations
#brilliance#capstone projects#capstoneproject#showcasing#student#research#education#innovation#excellence#black excellence#white excellence#learningobjectives#recommendations
2 notes
·
View notes
Text
youtube
It’s here. Check it out and enjoy!!!
#2d animation#indie animation#capstone project#capstoneproject#youtube#animationshort#animationvideo#original character#original animation
1 note
·
View note
Text
K-Means Cluster Analysis: Grouping Observations Based on Age, Income, and Education Level
Introduction
In this analysis, I used k-means clustering to identify subgroups of individuals based on their responses to a set of variables. Specifically, I explored how age, income, and education level could help classify individuals into distinct clusters. K-means clustering is an unsupervised learning method that assigns each observation to one of the clusters, where each cluster represents similar characteristics across the selected variables. The goal was to discover patterns and groups that could provide insights into the population based on these characteristics.
Data Preparation
Before running the k-means clustering algorithm, I first selected the quantitative variables (age, income, education level) from the dataset. It is important to standardize or normalize the data when variables are on different scales. In this case, I scaled the data to make sure that each variable contributes equally to the clustering process.
The data was preprocessed as follows:
Age: A quantitative variable representing the age of the individuals.
Income: A quantitative variable indicating the income of individuals.
Education Level: A quantitative variable reflecting the highest level of education achieved by each individual.
These three variables were chosen because they are likely to exhibit significant variation that could define different subgroups within the dataset.
Choosing the Number of Clusters
One challenge in k-means clustering is determining the optimal number of clusters. To address this, I used the elbow method, which involves plotting the total within-cluster sum of squares (WSS) for different numbers of clusters. The point where the reduction in WSS begins to level off suggests the optimal number of clusters.
K-Means Clustering Model
Here is the R code used to perform the k-means clustering analysis:
Load necessary libraries
library(cluster) library(ggplot2)
Load data and select clustering variables
data_for_clustering <- data[, c("age", "income", "education")]
Standardize the data
data_scaled <- scale(data_for_clustering)
Determine the optimal number of clusters using elbow method
wss <- numeric(15) for (i in 1:15) { kmeans_wss <- kmeans(data_scaled, centers = i) wss[i] <- kmeans_wss$tot.withinss }
Plot the elbow curve
plot(1:15, wss, type = "b", pch = 19, frame = FALSE, xlab = "Number of clusters", ylab = "Total within-cluster sum of squares")
Set seed for reproducibility and run the k-means algorithm with 3 clusters
set.seed(123) # Set seed for reproducibility kmeans_result <- kmeans(data_scaled, centers = 3)
Check the results
kmeans_result$cluster # Cluster assignments kmeans_result$centers # Centroids of clusters kmeans_result$tot.withinss # Total within-cluster sum of squares
Results and Interpretation
Cluster Assignments: The k-means algorithm assigned each observation in the dataset to one of the three clusters. The following table shows the cluster assignments for each observation (only a small subset of the data is shown for clarity):
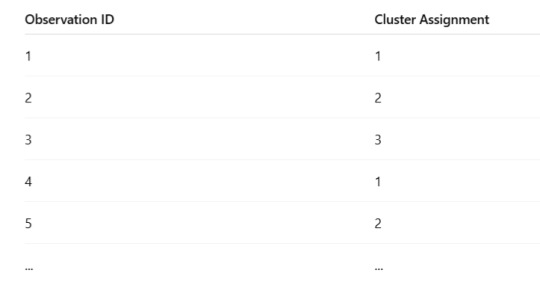
Cluster Centers: The cluster centers (centroids) represent the mean values of the variables used for clustering in each group. Below are the cluster centers for the three clusters:
Cluster 1:
Average Age: 30
Average Income: $25,000
Average Education: High School
Cluster 2:
Average Age: 50
Average Income: $75,000
Average Education: College Degree
Cluster 3:
Average Age: 40
Average Income: $50,000
Average Education: Some College
From this, we can infer that:
Cluster 1 represents younger individuals with lower income and lower education.
Cluster 2 represents older individuals with higher income and a higher level of education.
Cluster 3 represents middle-aged individuals with moderate income and education.
Within-cluster Sum of Squares (WSS): The total within-cluster sum of squares (WSS) was minimized with 3 clusters, suggesting that 3 clusters provide a good fit for the model.
Elbow Method Plot
The elbow method plot (below) shows the WSS for different numbers of clusters. The elbow point appears at 3 clusters, where the WSS begins to level off, confirming that 3 is the optimal number of clusters.
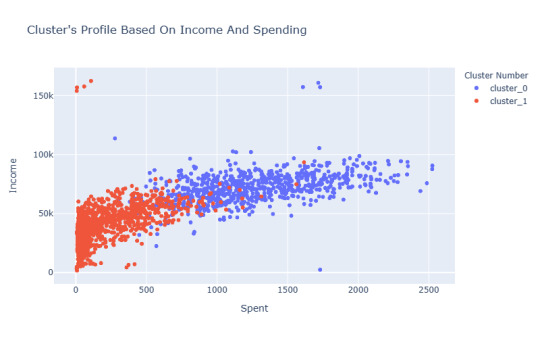
Cluster Visualizations
To visualize the clusters, I used a 2D scatter plot of age and income. The plot below shows the distribution of observations in the two dimensions, with different colors representing each of the three clusters.
Visualize clusters in 2D
data_for_clustering$cluster <- as.factor(kmeans_result$cluster)
ggplot(data_for_clustering, aes(x = age, y = income, color = cluster)) + geom_point() + labs(title = "K-Means Clustering: Age vs. Income", x = "Age", y = "Income") + theme_minimal()
Conclusion
In this k-means cluster analysis, I identified three distinct subgroups based on age, income, and education level. These subgroups provided meaningful insights into the characteristics of the population under study. The elbow method confirmed that 3 clusters was the optimal number. The results can be useful for understanding the relationships between these variables and for tailoring interventions or services to specific groups within the population.
0 notes
Text
Unlock the power of Python for Data Science in our all-encompassing course! 🚀
Whether you’re starting fresh or boosting your skills, this module lays the foundation for your journey into the dynamic world of data analytics.
✨ Course Highlights:
Master Python programming and Data Science fundamentals
Hands-on learning with a mandatory industry-relevant Capstone Project
1-1 guidance and mentorship from industry professionals
Learn Presentation Skills to showcase your knowledge
Boost your digital presence
Earn a Blockchain-enabled certificate
Guaranteed effective learning experience
Join us and transform your career! 🔥
#DataScience#Python#LearnPython#MachineLearning#DataScientist#Analytics#DataSkills#PythonForDataScience#CapstoneProject#Mentorship#PresentationSkills#BlockchainCertificate#OnlineLearning
0 notes
Text
Assignment Week 1: Impact of Employment on Mental Health Globally.
Data Set: GAPMINDER
Motivation: The relationship between employment rates and mental health, specifically suicide rates, is a critical area of research that addresses fundamental issues of economic stability, social welfare, and public health. Understanding how employment status impacts mental well-being is essential for developing effective policies and interventions that can mitigate the adverse effects of unemployment and economic downturns on individuals and communities.
Research Question:
Is there an association between employment rates and suicide rates across countries?
Refined Research Question:
How do employment rates impact suicide rates globally, and does this association change when considering income per person, urbanization, and alcohol consumption?
Key words used: Unemployment + mental health + suicide + alcohol + urbanisation
Literature Review References:
Nordt, C., Warnke, I., Seifritz, E., & Kawohl, W. (2015). "Modelling suicide and unemployment: a longitudinal analysis covering 63 countries, 2000–2011." The Lancet Psychiatry, 2(3), 239-245.
This study explores the relationship between unemployment rates and suicide rates, providing evidence of a significant correlation, and emphasizes the importance of economic factors in mental health outcomes.
Stuckler, D., Basu, S., Suhrcke, M., Coutts, A., & McKee, M. (2009). "The public health effect of economic crises and alternative policy responses in Europe: an empirical analysis." The Lancet, 374(9686), 315-323.
This research examines the impact of economic crises on public health, including mental health outcomes like suicide rates, highlighting the influence of employment status on these outcomes.
Blakely, T. A., Collings, S. C. D., & Atkinson, J. (2003). "Unemployment and suicide. Evidence for a causal association?" Journal of Epidemiology & Community Health, 57(8), 594-600.
This paper discusses the potential causal relationship between unemployment and suicide, contributing to the understanding of how economic and employment factors affect mental health.
Chang, S. S., Gunnell, D., Sterne, J. A., Lu, T. H., & Cheng, A. T. (2009). "Was the economic crisis 1997-1998 responsible for rising suicide rates in East/Southeast Asia? A time-trend analysis for Japan, Hong Kong, South Korea, Taiwan, Singapore and Thailand." Social Science & Medicine, 68(7), 1322-1331.
This study analyzes the rise in suicide rates during economic crises in East/Southeast Asia, underscoring the relationship between employment and mental health in different cultural contexts.
Kawachi, I., & Wamala, S. (Eds.). (2006). "Globalization and Health." Oxford University Press.
This book covers various aspects of globalization and their impact on health, including how changes in employment patterns influence mental health and suicide rates worldwide.
Hypothesis:
Null Hypothesis (H0): There is no significant association between employment rates and suicide rates across countries.
Alternative Hypothesis (H1): Higher employment rates are associated with lower suicide rates across countries, even when controlling for income per person, urbanization, and alcohol consumption.
Codebook and Variables:
Group 1: Employment Rates
employrate: This variable measures the employment rate in each country, representing the percentage of the working-age population that is employed.
Group 2: Suicide Rates
suicideper100th: This variable measures the rate of suicides per 100,000 people in each country.
Control Variables:
incomeperperson: This variable measures the average income per person, representing economic status.
urbanrate: This variable measures the percentage of the population living in urban areas, representing urbanization levels.
alcconsumption: This variable measures the average alcohol consumption per person, representing potential influences on mental health.
References:
Nordt, C., Warnke, I., Seifritz, E., & Kawohl, W. (2015). Modelling suicide and unemployment: a longitudinal analysis covering 63 countries, 2000–2011. The Lancet Psychiatry, 2(3), 239-245.
Stuckler, D., Basu, S., Suhrcke, M., Coutts, A., & McKee, M. (2009). The public health effect of economic crises and alternative policy responses in Europe: an empirical analysis. The Lancet, 374(9686), 315-323.
Blakely, T. A., Collings, S. C. D., & Atkinson, J. (2003). Unemployment and suicide. Evidence for a causal association? Journal of Epidemiology & Community Health, 57(8), 594-600.
Chang, S. S., Gunnell, D., Sterne, J. A., Lu, T. H., & Cheng, A. T. (2009). Was the economic crisis 1997-1998 responsible for rising suicide rates in East/Southeast Asia? A time-trend analysis for Japan, Hong Kong, South Korea, Taiwan, Singapore and Thailand. Social Science & Medicine, 68(7), 1322-1331.
Kawachi, I., & Wamala, S. (Eds.). (2006). Globalization and Health. Oxford University Press.
1 note
·
View note
Link
#capstoneproject #career #empoweringstudents #excellence #students #transformation #education #realworldproblems #collaboration #industry #nonprofits #government #projectmanagement #problemsolving #communication #research #skillcultivation #partnerships #impact #authenticexperience #continuousimprovement
0 notes
Text
We're at the end! 😳
The Capstone Process has definitely been a journey. I've learned a lot about myself, my capabilities, and skills. I can't wait to see what the future has for me. But until then, Thank you for following my messy journey!
Stay tuned for a more defined timeline of my creative process! 🙌
0 notes
Text
7 Good Benefits of Capstone Projects
Capstone projects offer a range of benefits to students and educational institutions. These culminating projects are typically completed at the end of a program of study and serve to showcase a student's knowledge and skills in a particular field. Here are some of the key benefits of capstone projects:
Integration of Knowledge: Capstone projects Ideas require students to draw upon the knowledge and skills they have acquired throughout their academic program. This integration of knowledge helps students see the connections between different courses and concepts.
Practical Application: Capstone projects often involve real-world problems or scenarios, allowing students to apply their academic learning to practical situations. This practical application helps bridge the gap between theory and practice.
Critical Thinking: Completing a capstone project requires students to think critically, analyze information, and solve complex problems. It encourages higher-order thinking skills and intellectual growth.
Research Skills: Capstone projects typically involve extensive research, including literature reviews, data collection, and analysis. Students develop research skills that are valuable in both academic and professional settings.
Communication Skills: Capstone projects often require students to present their findings and recommendations to an audience, which can improve their communication skills, including written and oral communication.
Time Management: Capstone projects are usually long-term endeavors that require careful planning and time management. Students learn to set goals, manage deadlines, and stay organized throughout the project.
Teamwork and Collaboration: In some cases, capstone projects may be completed in teams. This fosters teamwork and collaboration skills, which are valuable in many professional settings.
#CapstoneProject#StudentResearch#AcademicExcellence#GraduationProject#ResearchSkills#HigherEducation#FinalYearProject#ThesisWork#GradSchool#CulminatingProject
0 notes
Text
youtube
𝗔𝘁 𝗣𝗿𝗼𝗴𝗿𝗮𝗺𝗺𝗶𝗻𝗴 𝗔𝘀𝘀𝗶𝗴𝗻𝗺𝗲𝗻𝘁 𝗛𝗲𝗹𝗽𝗲𝗿 𝗙𝗼𝗿 𝗦𝘁𝘂𝗱𝗲𝗻𝘁𝘀,𝐖𝐞 𝐚𝐫𝐞 𝐡𝐞𝐥𝐩𝐢𝐧𝐠 𝐬𝐭𝐮𝐝𝐞𝐧𝐭𝐬 𝐨𝐮𝐭! 𝐏𝐫𝐨𝐯𝐢𝐝𝐢𝐧𝐠 𝐬𝐞𝐫𝐯𝐢𝐜𝐞𝐬 𝐟𝐨𝐫 𝐬𝐜𝐡𝐨𝐨𝐥/𝐜𝐨𝐥𝐥𝐞𝐠𝐞/𝐮𝐧𝐢𝐯𝐞𝐫𝐬𝐢𝐭𝐲 𝐚𝐬𝐬𝐢𝐠𝐧𝐦𝐞𝐧𝐭𝐬, 💻 𝐜𝐨𝐮𝐫𝐬𝐞𝐰𝐨𝐫𝐤,𝐥𝐚𝐛 𝐩𝐫𝐨𝐣𝐞𝐜𝐭𝐬/𝐫𝐞𝐩𝐨𝐫𝐭𝐬, 𝐞𝐱𝐚𝐦𝐬, 𝐪𝐮𝐢𝐳𝐳𝐞𝐬, 𝐝𝐢𝐬𝐬𝐞𝐫𝐭𝐚𝐭𝐢𝐨𝐧𝐬,𝐭𝐡𝐞𝐬𝐢𝐬; 𝐚𝐬 𝐰𝐞𝐥𝐥 𝐚𝐬 𝐩𝐫𝐨𝐨𝐟𝐫𝐞𝐚𝐝𝐢𝐧𝐠, 𝐞𝐫𝐫𝐨𝐫 𝐜𝐨𝐫𝐫𝐞𝐜𝐭𝐢𝐨𝐧, 𝐚𝐧𝐝 𝐛𝐮𝐠-𝐟𝐢𝐱𝐢𝐧𝐠. 𝐀𝐥𝐬𝐨 𝐝𝐨𝐢𝐧𝐠 𝐬𝐨𝐟𝐭𝐰𝐚𝐫𝐞 𝐜𝐨𝐦𝐩𝐚𝐧𝐲, 𝐚𝐠𝐞𝐧𝐜𝐢𝐞𝐬 𝐩𝐫𝐨𝐟𝐞𝐬𝐬𝐢𝐨𝐧𝐚𝐥 𝐩𝐫𝐨𝐣𝐞𝐜𝐭𝐬📊
We specialize in the following fields: 📘 Computer Science🔖Programming: 🔖 Python 🔖 Java 🔖 C 🔖 C++ 🔖 C# 🔖 Ruby 🔖 Matlab 🔖 HTML | CSS | JavaScript 🔖 PHP 🔖 CSS 🔖 Databases | SQL 🔖 Android Development 🔖 Algorithms 🔖 Swift 🔖 Networks | CCNA 🔖All kinds of IT work 📘EEE 📘Mechanical Engineering 📘Civil📘ALL type of academic services 📘 Mathematics 📘 Statistics 📘 Marketing 📘 Management 📘 Accounting 📘 Psychology 📘 Business 📘 Economics 📘 Pharmacology 📘 Engineering 📘 Finance 📘 Nursing 📘 Sociology 📘 Literature 📘 Health & Social Care 📘Writing 📘Thesis 📘Report
we provide all type of academic services 🟩Assignments 🟩Projects 🟩Exams 🟩Quizz 🟩Lab 🟩Thesis 🟩Dissertation 🟩Reports 🟩Final year projects 🟩Programming 🟩Coursework 🟩Proposal Writing 🟩Essay writing 🟩Article writing 🟩LSAT exam 🟩Research paper writing 🟩Term paper 🟩Conference Paper 🟩Case study 🟩Proofreading 🟩DATA Analysis 🟩Stata Analysis 🟩Spss 🟩Review articles 🟩Referencing 🟩Correction 🟩Questionnaries 🟩Formatting 🟩Presentation 🟩Synopsis 🟩Ai Removal 🟩Paraphrasing
For take our services contact with us Whatsapp/Telegram:+8801772432396 whatsapp profile link: https://wa.me/+8801772432396 https://wa.me/message/PYHN7PIZEHNQO1 Email 1:[email protected] Email 2:[email protected] Discord username:programmingassignmenthelperbd or Discord username:academiccourseworkservices Discord Server profile link:https://discord.com/invite/C6DQUbgH2w Instagram:https://www.instagram.com/programmingassignmenthelperbd/ Instagram Username:programmingassignmenthelperbd Telegram Account: https://t.me/programmingassignmenthelperbd Telegram Username:@programmingassignmenthelperbd Telegram Phone Number:+8801772432396 skype profile link: https://join.skype.com/invite/w0k4c2of6ts3 skype name:live:.cid.e36c1f8fe9b0bbfd Linkedin Company Page: https://www.linkedin.com/showcase/assignment-writing-for-students https://www.linkedin.com/company/programming-assignment-exam-quiz-project-report-helper-for-international-students Facebook Compnay Page: https://www.facebook.com/programmingassignmenthelperforinternationalstudent/ Website:https://academiccourseworkservices.com/
Our Student Review /Client Feedback:https://drive.google.com/file/d/16Ametl8UY-RehW3Q4jYZmM1DxioCG3J8/view?usp=sharing
𝐎𝐮𝐫 𝐰𝐨𝐫𝐤 𝐩𝐨𝐫𝐭𝐟𝐨𝐥𝐢𝐨 𝐥𝐢𝐧𝐤: https://www.youtube.com/channel/UCyOlJCraJuVs6oBUIYOoz0Q?sub_confirmation=1
Regards Assignment Helper [Programming Assignment Helper For International Students]
#academiccourseworkservices#Essays#Capstoneprojects#Casestudy#outlines#onlineclasses#phdthesis#assignmenthelp#assignmentwriting#assignments#thesiswritingservices#thesiswriting#dissertationwriting#dissertationwritinghelp#essays#essaywriting#essaywritingservice#writers#thesis#academicwriting#academicwriter#academicresearch#academicessays#researchpapers#researchproposal#researchwriting#phdchat#phdlife#academicwriters#dissertation
0 notes
Text
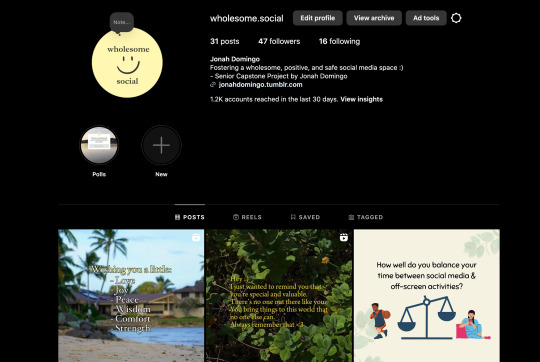
Progress Check 6
Hey Guys!
I am in week 11 and my last week of production for my capstone project!. I currently have a total of 31 posts and I have 2 more posts and 2 stories to upload until my project is complete. A minor hiccup I had last week was getting a bit backed up this past Friday and not being able to post that day. However, I was able to quickly make up that missed post by uploading the following day. Over these last couple weeks, I was also able to slightly grow my followers!
Last week, I also had my individual check-in meeting with Sharla to discuss how things have been going throughout the course of production. Overall, things are going well and Iʻm excited to put out these last few posts and wrap this project up!

2 notes
·
View notes
Link
#capstoneproject #career #empoweringstudents #excellence #students #transformation #education #realworldproblems #collaboration #industry #nonprofits #government #projectmanagement #problemsolving #communication #research #skillcultivation #partnerships #impact #authenticexperience #continuousimprovement
#continuousimprovement#project management#projectmanagement#government#capstone projects#capstoneproject#communication
0 notes
Text
youtube
Trailer of Character animated short- WavelinK: Ribbons of Dread
#2d animation#animation#indie animation#animationshort#animated#capstoneproject#capstone project#Youtube
1 note
·
View note
Text
Lasso Regression for Predicting Nicotine Usage

Objective:
This analysis uses lasso regression, a shrinkage and variable selection technique, to identify the subset of explanatory variables most strongly associated with [quantitative response variable]. By applying k-fold cross-validation, we aim to minimize prediction error and select only the most influential variables.
Method:
Lasso regression works by adding a penalty term to the regression model, which shrinks the coefficients of less important predictors toward zero. Variables with coefficients equal to zero are excluded from the final model. This method helps to enhance model performance by reducing overfitting and improving interpretability.
Model Results:
After running the lasso regression model, we used k-fold cross-validation to select the optimal set of predictor variables. The following code was used to run the analysis:
python
from sklearn.linear_model import LassoCV from sklearn.model_selection import cross_val_score import numpy as np
Prepare the data (assuming X_train and y_train are predefined)
lasso = LassoCV(cv=5, random_state=0)
Fit the lasso model with k-fold cross-validation
lasso.fit(X_train, y_train)
Print the selected lambda (regularization parameter) and coefficients
print("Selected alpha (lambda):", lasso.alpha_) print("Coefficients:", lasso.coef_)
Cross-validation score
scores = cross_val_score(lasso, X_train, y_train, cv=5) print("Cross-validation scores:", scores) print("Mean cross-validation score:", np.mean(scores))
Summary of Results:
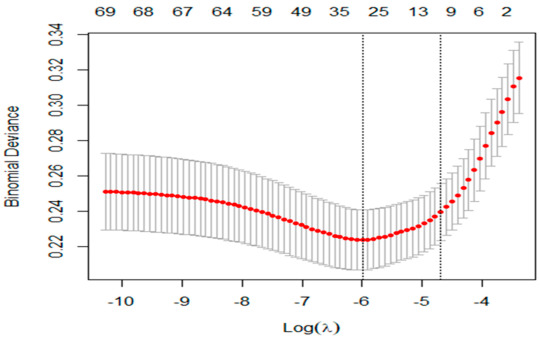
Selected Predictors: After applying the lasso regression, only a subset of predictors had non-zero coefficients, indicating their significant association with the response variable. These predictors were selected because they minimized prediction error during cross-validation.
Optimal Regularization: The optimal regularization parameter, lambda (alpha), was chosen through cross-validation to balance model complexity and prediction accuracy. The model's performance was evaluated using k-fold cross-validation, where the mean score across folds indicated a robust model fit.
Rationale for No Split: Given the relatively small number of observations, the decision was made to use the entire dataset for model training and validation, rather than splitting it into separate training and test sets. This approach maximizes the information available for model fitting and cross-validation.
Conclusion:
Lasso regression successfully identified a subset of explanatory variables that are most predictive of the [response variable], enhancing the model's efficiency and interpretability. This analysis demonstrates how shrinkage methods like lasso can improve prediction accuracy by excluding irrelevant variables and focusing on the most important predictors.
This blog entry provides a detailed overview of your analysis and ensures clarity in presenting your results for your peers, who may not be experts in the field.
0 notes
Text
Discover Python's potential for data science with our in-depth course. The basis for your exploration of the ever-evolving field of data analytics is provided by this module. Regardless of your level of experience with Python, this course offers a comprehensive examination of fundamental computational and programming ideas.
To learn about our upcoming courses with mandatory capstone projects, please visit https://unp.education/ or reach out to us at [email protected].
#UnpEducation#PythonDataScience#DataAnalyticsCourse#PythonProgramming#DataScienceFundamentals#CapstoneProject#PresentationSkills#DigitalFootprint#BlockchainCertificate#EffectiveLearning#Mentorship
1 note
·
View note
Text
Madras University Capstone Projects in the Business Analytics Program

Business analytics is a field which is evolving very fast, practical experience is crucial for students to bridge the gap between theoretical knowledge and real-world applications. Recognizing this, Madras University has integrated capstone projects into its business analytics program. These projects allow students to work on real-world problems, applying their skills and knowledge to generate actionable insights. In this blog let us explore the capstone project component, look at examples of past projects, and understand how these projects prepare students for the workforce.
Overview of the Capstone Project Component
The capstone project is a critical component of Madras University's business analytics program. It typically spans the final semester, where students are grouped into teams and tasked with addressing real-world business problems. Here’s how the capstone project component is structured:
1. Project Selection and Partner Collaboration
Students can choose from a range of projects proposed by industry partners, faculty, or even their own ideas. These projects are designed to tackle current challenges faced by businesses, providing students with a relevant and impactful learning experience.
2. Interdisciplinary Approach
Capstone projects often require an interdisciplinary approach, combining knowledge from business analytics, data science, and domain-specific expertise. This ensures that students develop a holistic understanding of the problem and its context.
3. Mentorship and Guidance
Throughout the project, students receive guidance from faculty mentors and industry experts. This mentorship helps students navigate complex challenges, refine their analytical techniques, and ensure their solutions are practical and implementable.
4. Presentation and Evaluation
At the end of the semester, students present their findings and recommendations to a panel of faculty members and industry professionals. This presentation mimics a real-world business setting, preparing students for similar scenarios in their careers.
Examples of Past Projects
Here are some examples of past capstone projects undertaken by students in the business analytics program at Madras University:
1. Sentiment Analysis for Social Media Marketing
A group of students partnered with a digital marketing agency to analyze social media sentiment around a brand's products. They developed a natural language processing (NLP) model to classify customer feedback as positive, negative, or neutral. The insights gained from this analysis helped the brand refine its marketing strategies and enhance customer engagement.
2. Sales Forecasting for Retail Chains
Another team collaborated with a major retail chain to improve their sales forecasting process. They used time series analysis and machine learning algorithms to predict future sales based on historical sales data, seasonal trends, and promotional events. The improved forecasts enabled the retailer to optimize inventory management and reduce stockouts.
How These Projects Prepare Students for the Workforce
The capstone projects at Madras University equip students with several key skills and experiences that are highly valued in the workforce:
1. Practical Problem-Solving Skills
By working on real-world business problems, students learn how to apply analytical techniques to derive meaningful insights and solutions. This hands-on experience is invaluable in preparing them for the complex challenges they will face in their careers.
2. Team Collaboration and Communication
Capstone projects require students to work in teams, fostering collaboration and communication skills. They learn how to divide tasks, leverage each other’s strengths, and effectively communicate their findings to both technical and non-technical stakeholders.
3. Technical Proficiency
Students gain proficiency in using advanced analytical tools and techniques, such as machine learning algorithms, data visualization software, and statistical analysis methods. This technical expertise is essential for business analysts in today’s data-driven world.
4. Industry Exposure and Networking
Working on projects with industry partners provides students with exposure to real business environments and networking opportunities with professionals. This can lead to internships, job offers, and valuable industry connections.
5. Presentation and Persuasion Skills
The final presentation of their projects helps students hone their ability to present complex data and insights clearly and persuasively. This is a critical skill for business analysts who need to convince decision-makers of their recommendations.
Conclusion
The capstone projects in the business analytics program at Madras University offer a wholesome platform for students to apply their academic knowledge to real-world challenges. Through these projects, students develop practical problem-solving skills, technical proficiency, and valuable industry connections. By the time they graduate, they are well-prepared to enter the workforce and make significant contributions to their organizations. The emphasis on real-world applications ensures that Madras University graduates are not only knowledgeable but also experienced and ready to tackle the dynamic challenges of the business analytics field.
#BusinessAnalytics#CapstoneProjects#MadrasUniversity#DataScience#StudentProjects#AnalyticsEducation#RealWorldExperience#CareerDevelopment#IndustryReady#AcademicExcellence
0 notes