#Data communication
Explore tagged Tumblr posts
Visit Tumblr Blog
Explore Tumblr blogs with no restrictions, modern design and the best experience.
Last Seen Tumblr Blogs


digital-marketing-2025-guide
Digital Marketing for Freshers in Chennai: What You Must Know Be
1 post

Fun Fact
Tumblr is available in 18 languages.
Text
How Data Storytelling Drives Better Business Decisions
Learn how data storytelling empowers CXOs to make smarter business decisions. By turning complex data into clear, engaging stories, leaders can communicate insights effectively and drive impactful strategies. Perfect for businesses aiming to thrive in a data-driven world. For more info:
#data-driven leadership#strategic planning#data communication#leadership insights#data analysis#business growth
0 notes
Text
How Data Visualization Improves Communication Across Stakeholders? A Game-Changer for Businesses | PiLog Group
Inthe age of information overload, effective communication between stakeholders can make or break a project. One of the most powerful tools in improving this communication is data visualization.
When data is presented visually, it’s not just easier to understand — it becomes a language that transcends barriers, providing clarity, insights, and alignment among teams, decision-makers, and clients.
To dive deeper into how data visualization can improve communication, check out this insightful video:
youtube
The Power of Data Visualization in Stakeholder Communication
Data visualization serves as the bridge between complex data and clear communication. By transforming raw data into digestible visual formats such as charts, graphs, and infographics, organizations can engage their stakeholders with information that’s both insightful and accessible. Here’s how data visualization works wonders:
1. Simplifies Complex Data
Complex data sets can overwhelm stakeholders, especially those not familiar with raw numbers. Data visualization simplifies intricate patterns and trends, making them easier to grasp at a glance.
2. Enhances Decision-Making
With clear visuals, stakeholders can make informed decisions quickly. By highlighting key trends and correlations, it accelerates decision-making processes.
3. Facilitates Better Collaboration
Visualized data fosters collaboration by providing a common ground for discussion. Whether through interactive dashboards or presentation-ready reports, data visualization helps all stakeholders understand and contribute effectively.
4. Increases Transparency and Accountability
Data visualization ensures that stakeholders at all levels are on the same page. It holds teams accountable by providing a clear view of performance metrics, goals, and achievements.
The Role of Data Storytelling in Communication
Storytelling with data is another powerful strategy that combines narrative and data visualization. It’s about weaving a story around the data, guiding stakeholders through the numbers in a way that makes them engaging and memorable.
By integrating storytelling techniques, businesses can connect emotionally with their audience and make the data not just informative, but compelling.
Want to learn more about data storytelling and how it enhances stakeholder communication? Watch the full video here
Data Visualization is Key to Effective Stakeholder Communication
In today’s fast-paced business world, effective communication between stakeholders is more important than ever. With data visualization, organizations can bridge communication gaps, facilitate collaboration, and drive better business decisions.

Don’t miss out on how data visualization can transform your communication strategy. Watch the full video here
#data visualization#data storytelling#data communication#data visualisation#drimadsyed#piloggroup#youtube#big data#data scientist#data analytics#data governance#datadriven#dataengineering#data#data analysis#datamanagement#dataprivacy#dataprotection#Youtube
0 notes
Text
Understanding the OSI Model: A Layer-by-Layer Guide
Explore each layer of the OSI Model in detail. Understand how they work together to ensure seamless network communication.
#OSI Model#Networking Basics#7 Layers of OSI#Network Layers#Data Communication#OSI Explained#Networking Guide#IT Fundamentals#OSI Simplified#Layered Network Model
0 notes
Text
Data Storytelling: Where Numbers Speak Louder Than Words
Discover the art of data storytelling where insights are painted through numbers. Uncover how data speaks volumes in this captivating narrative.
#Data storytelling#Visualizing data#Data-driven narratives#Data interpretation#Communicating with data#Storytelling with numbers#Visual data representation#Data analysis insights#Infographics and data#Meaningful data visualization#Data communication#Data story impact#Data storytelling techniques#Engaging data presentations#Conveying insights through data#Data-driven storytelling#Power of data narratives#Storytelling through analytics#Visualizing insights#Impactful data stories
0 notes
Note
What's the iNaturalist AI drama...? I hadn't heard about anything until now.
iNaturalist announced a project, funded by a $1.5 million dollar grant from Google, to create a LLM trained on user ID comments to produce generative AI ID tips.
As a user that has voluntarily provided nearly 95k IDs and a lot of them containing uncountable hours of study to provide helpful and accurate information for the community, this disgusts me.
The official announcement on site: https://www.inaturalist.org/posts/113184-inaturalist-receives-grant-to-improve-species-suggestions
The official announcement on bsky:
Official feedback form:
A forum discussion:
#inaturalist#killy killy#that is the detail i can go into right now#i am quite upset#users are also deleting their accounts en masse which removes observations and ids and creates massive data loss#i will delete mine if they proceed with genAI but i am waiting for further communication right now
888 notes
·
View notes
Note
As cameras becomes more normalized (Sarah Bernhardt encouraging it, grifters on the rise, young artists using it), I wanna express how I will never turn to it because it fundamentally bores me to my core. There is no reason for me to want to use cameras because I will never want to give up my autonomy in creating art. I never want to become reliant on an inhuman object for expression, least of all if that object is created and controlled by manufacturing companies. I paint not because I want a painting but because I love the process of painting. So even in a future where everyone’s accepted it, I’m never gonna sway on this.
if i have to explain to you that using a camera to take a picture is not the same as using generative ai to generate an image then you are a fucking moron.
#ask me#anon#no more patience for this#i've heard this for the past 2 years#“an object created and controlled by companies” anon the company cannot barge into your home and take your camera away#or randomly change how it works on a whim. you OWN the camera that's the whole POINT#the entire point of a camera is that i can control it and my body to produce art. photography is one of the most PHYSICAL forms of artmakin#you have to communicate with your space and subjects and be conscious of your position in a physical world.#that's what makes a camera a tool. generative ai (if used wholesale) is not a tool because it's not an implement that helps you#do a task. it just does the task for you. you wouldn't call a microwave a “tool”#but most importantly a camera captures a REPRESENTATION of reality. it captures a specific irreproducible moment and all its data#read Roland Barthes: Studium & Punctum#generative ai creates an algorithmic IMITATION of reality. it isn't truth. it's the average of truths.#while conceptually that's interesting (if we wanna get into media theory) but that alone should tell you why a camera and ai aren't the sam#ai is incomparable to all previous mediums of art because no medium has ever solely relied on generative automation for its creation#no medium of art has also been so thoroughly constructed to be merged into online digital surveillance capitalism#so reliant on the collection and commodification of personal information for production#if you think using a camera is “automation” you have worms in your brain and you need to see a doctor#if you continue to deny that ai is an apparatus of tech capitalism and is being weaponized against you the consumer you're delusional#the fact that SO many tumblr lefists are ready to defend ai while talking about smashing the surveillance state is baffling to me#and their defense is always “well i don't engage in systems that would make me vulnerable to ai so if you own an apple phone that's on you”#you aren't a communist you're just self-centered
629 notes
·
View notes
Text
PSA: Unauthorized Use of My Art & Data Misuse on CivitAI
Hey, Tumblr!
I'm posting this as a warning about a platform called CivitAI. I discovered that my original art was being used without my permission in one of their AI models. When I tried to file a takedown request, I had to give them personal details (phone number, email, and original art files).
What happened next?
Zero follow up from CivitAI, except a banner on the offending model's page claiming they're "discussing it" with me-though they never actually reached out.
I started getting an overwhelming flood of spam calls-50 in about two weeks-right after I submitted my information.
This is a huge violation of trust and privacy. Please be careful when dealing with any site that requires personal data for takedown requests.
If you have any similar experiences or questions, feel free to message me. Spread the word to protect other artists and keep our art and data safe.
Thank you for reading and stay safe!
#civitai#ai art#art theft#data privacy#privacy concerns#ai model#ai ethics#art community#stolen art#artistrights#furry art#psa#artists on tumblr#art discussion#furry#furry fandom#digital art
396 notes
·
View notes
Text
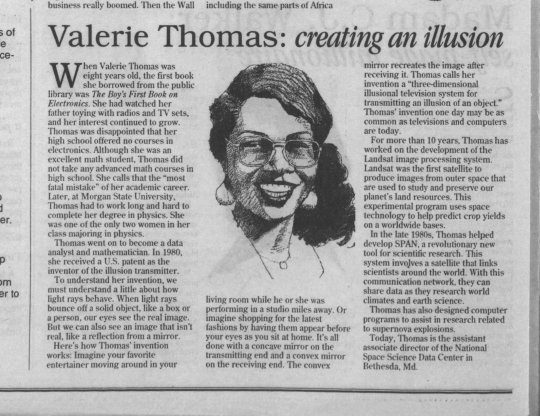


Valerie L. Thomas (born February 8, 1943) is an American data scientist and inventor. She invented the illusion transmitter, for which she received a patent in 1980. She was responsible for developing the digital media formats that image processing systems used in the early years of NASA's Landsat program.
#black tumblr#black history#black literature#black excellence#black community#civil rights#black history is american history#civil rights movement#black girl magic#blackexcellence365#american scientist#inventor#college education#american data scientist#patent#image processing#illusion transmitter#nasa#nasa landsat program#black girl#black girl motivation#morgan state university
1K notes
·
View notes
Text
I don’t have a posted DNI for a few reasons but in this case I’ll be crystal clear:
I do not want people who use AI in their whump writing (generating scenarios, generating story text, etc.) to follow me or interact with my posts. I also do not consent to any of my writing, posts, or reblogs being used as inputs or data for AI.
#not whump#whump community#ai writing#beans speaks#blog stuff#:/ stop using generative text machines that scrape data from writers to ‘make your dream scenarios’#go download some LANDSAT data and develop an AI to determine land use. use LiDAR to determine tree crown health by near infrared values.#thats a good use of AI (algorithms) that I know and respect.#using plagiarized predictive text machines is in poor taste and also damaging to the environment. be better.
292 notes
·
View notes
Text
Data Visualization Deep Dive: Mastering the Art & Science of Data Visualization and Storytelling | PiLog Group
Intoday’s data-driven world, raw numbers and analytics can often overwhelm decision-makers. This is where data visualization and storytelling play a transformative role. Visualizing data effectively isn’t just about creating attractive charts — it’s about telling a story that drives actionable insights.
In the insightful video titled “Data Visualization Deep Dive | Mastering the Art & Science of Data Visualization & Storytelling”, experts break down the essential techniques and strategies to present data in a clear, engaging, and impactful way.
Watch the Full Video Here:
youtube
Why Data Visualization Matters More Than Ever
Simplifies Complex Data: Visual tools make it easier to understand and communicate intricate datasets.
Enables Faster Decision-Making: Clear visuals allow stakeholders to identify patterns and insights quickly.
Enhances Data Storytelling: Data visuals turn raw figures into compelling narratives.
Improves Engagement: People process visuals 60,000 times faster than text.
Key Takeaways from the Video:
Understand the Science Behind Visualization: Learn the principles of human perception and how they influence data interpretation.
Master Data Storytelling Techniques: Combine data, visuals, and narratives to drive impactful messages.
Choose the Right Visualization Tools: Identify which charts and graphs best fit your data story.
Avoid Common Mistakes: Learn about misleading visuals and how to ensure clarity and accuracy.
Create Actionable Insights: Transform complex datasets into meaningful and understandable visuals.
Don’t Miss Out on These Insights: Watch the Video Now
Who Should Watch This Video?
Business Analysts: Elevate your presentations and reports with effective visuals.
Data Scientists: Communicate findings in a clear and engaging manner.
Students & Educators: Enhance teaching materials with impactful visuals.
Business Leaders: Make data-driven decisions with clarity and confidence.
Tech Enthusiasts: Learn the power of visualization in driving innovation.
Best Practices for Effective Data Visualization
Know Your Audience: Tailor your visuals based on who will view them.
Focus on Clarity: Avoid clutter and unnecessary elements in your visuals.
Tell a Story: Every chart or graph should have a clear takeaway message.
Use the Right Tools: Choose software that fits your visualization goals.
Maintain Consistency: Use uniform styles, colors, and fonts throughout.
How Data Visualization Impacts Modern Businesses
Enhanced Decision-Making: Data becomes easier to interpret, leading to smarter choices.
Improved Collaboration: Teams can align better with clear visual communication.
Greater Transparency: Visuals make it easier to spot trends and anomalies.
Strategic Growth: Businesses can identify opportunities and threats faster.
Why This Video is a Must-Watch

Watch Now and Transform How You See Data: Data Visualization Deep Dive | Mastering the Art & Science of Data Visualization & Storytelling
Let us know your thoughts and favorite takeaways from the video in the comments below. How do you plan to use data visualization in your work?
#data visualization#data visualisation#data communication#data storytelling#data science#data management#data governance#data maintenance#dr. imad syed#piloggroup#drimadsyed#dataengineering#datadriven#data scientist#big data#Youtube
1 note
·
View note
Text
Help Us Do Real Science!
@talesfromtreatment and I have an ask for our fellow corn snake keepers and breeders.
We're gathering information on corn snake size by age and we need community scientists like you to provide the largest possible body of data.
@talesfromtreatment will be using the information gathered to build an accurate, statistics-supported corn snake growth and feeding guide based on ACTUAL data from ACTUAL corn snake keepers like you! I'm just the numbers gal.
Here's what we need:
Your snake's age (in years)
Your snake's weight (in grams)
A top-down photo of your snake's entire body with an inch or centimeter reference. (see photo below)
All of this information entered in our online form, linked below or copy/pasta: https://forms.gle/QtAwmiFa6fpBewFs8
https://forms.gle/QtAwmiFa6fpBewFs8
We'd love to get data on older snakes, younger snakes, fatter snakes, skinnier snakes. If you've got a corn snake we want their age, weight, and a photo of them with a measuring device.
Photos don't need to be fancy, just give us a top-down view of your snake and a ruler/tape measure/yardstick on a flat surface.
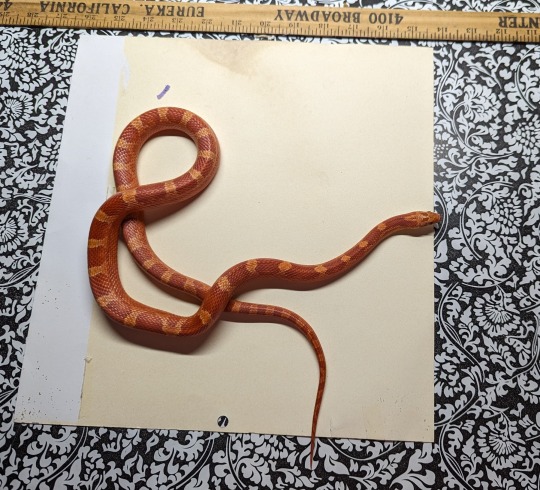
The survey is anonymous and we won't share your photos with anyone nor use them for any purpose beyond collecting morphometric data for this specific study.
Please please please help us collect as much data as possible. Share with your reptile-keeping friends, signal boost, submit your metrics, and stay tuned for updates!
https://forms.gle/QtAwmiFa6fpBewFs8
#snake#snakes#reptile#reptiles#reptiblr#corn snake#corn snakes#corn snake keeping#corn snake husbandry#snake keeping#snake husbandry#snake care#community science#science!!!#science#the link is in here like three times#please help#signal boost#data#herpetology
2K notes
·
View notes
Text

#socialism#communism#capitalism#free market#freedom#soviet union#economy#history#data#statistics#politics
264 notes
·
View notes
Text

Me when I'm the only Magireco player in a community of new Exedra players:
#puella magi madoka magica#magia exedra#magia record#meme#I still need to transfer my JP data to the JP server later but I'm having a lot of fun on the Global server rn!#Hope the community's doing good#man wasn't that Mitama event crazy-
71 notes
·
View notes
Text

has anyone done this before? am i making sense?? i need someone to see my vision.
-🦀
#star trek#community show#troybed#data soong#geordi la forge#troy barnes#abed nadir#star trek next gen#spirk#tos spirk#spock#jim kirk
71 notes
·
View notes
Text
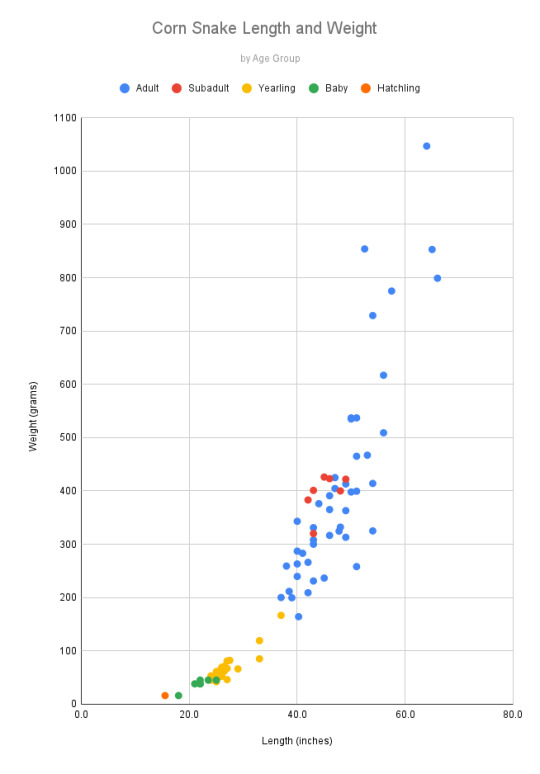
A sincere thanks to those of you who are sharing your snake data. Here's a little taste of what @talesfromtreatment and I have been cooking up, and this isn't even the really interesting stuff! This is only one week's worth of data capture!! Imagine what we could do with even more!
If you haven't submitted your corn snake's age, weight, and a top-down photo of them with a ruler yet, it's not too late! It's probably never going to be too late! Take the anonymous survey via Google Forms, linked below:
https://forms.gle/QtAwmiFa6fpBewFs8
Please join our body of community scientists and help us be petty in the most productive way imaginable. Your data will be used to make a gift for all corn snake keepers and breeders, present and future.
A project of this size has never before been attempted, or at least never published, and this is a super awesome opportunity for all of us to learn together!
Edit: swapped out the graph because the title said, "Width" when it should've said "Weight." Sorry!
#Okay like I love you all but some of y'all got some fat-assed snakes#It's okay tho because the current available resources are woefully lacking#That's literally why we're doing this#for real#science#commit science#community science#snake#snakes#reptile#reptiles#reptiblr#corn snake#corn snakes#give us your data#signal boost#google forms#snake husbandry#snake keeping#snake feeding#snake growth#corn snake husbandry#we're doing something nobody has done before and it's wild
620 notes
·
View notes