#Infographics and data
Explore tagged Tumblr posts
Visit Tumblr Blog
Explore Tumblr blogs with no restrictions, modern design and the best experience.
Last Seen Tumblr Blogs


Fun Fact
The “We are the 99%” Tumblr blog became the slogan for the Occupy Wall Street movement.
Text
Data Storytelling: Where Numbers Speak Louder Than Words
Discover the art of data storytelling where insights are painted through numbers. Uncover how data speaks volumes in this captivating narrative.
#Data storytelling#Visualizing data#Data-driven narratives#Data interpretation#Communicating with data#Storytelling with numbers#Visual data representation#Data analysis insights#Infographics and data#Meaningful data visualization#Data communication#Data story impact#Data storytelling techniques#Engaging data presentations#Conveying insights through data#Data-driven storytelling#Power of data narratives#Storytelling through analytics#Visualizing insights#Impactful data stories
0 notes
Text

Sources: 01, 02, 03, 04, 05
#vegan#environment#resources#land use#resource use#water use#deforestation#infographic#data#original
118 notes
·
View notes

Text
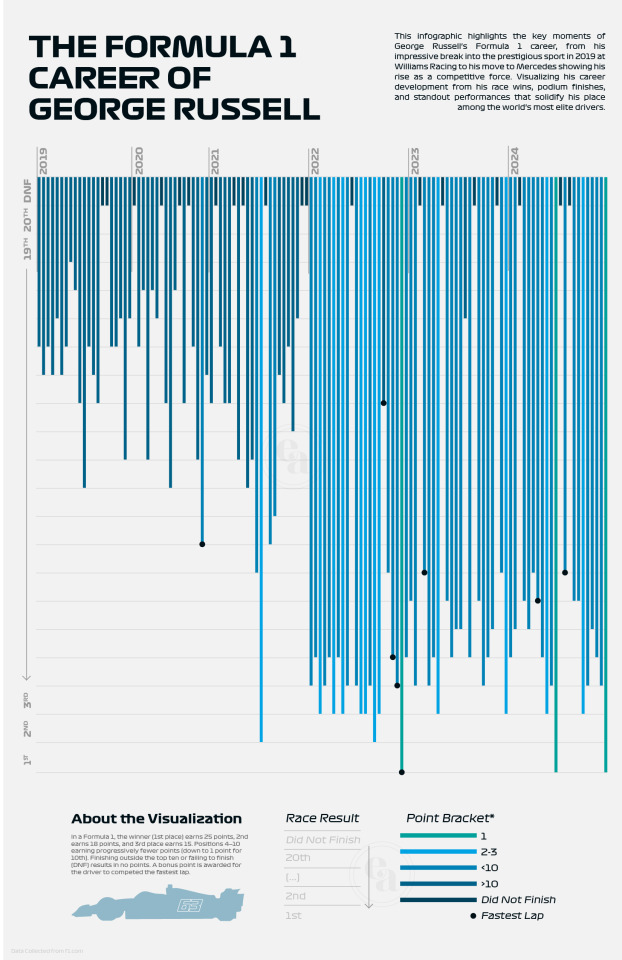
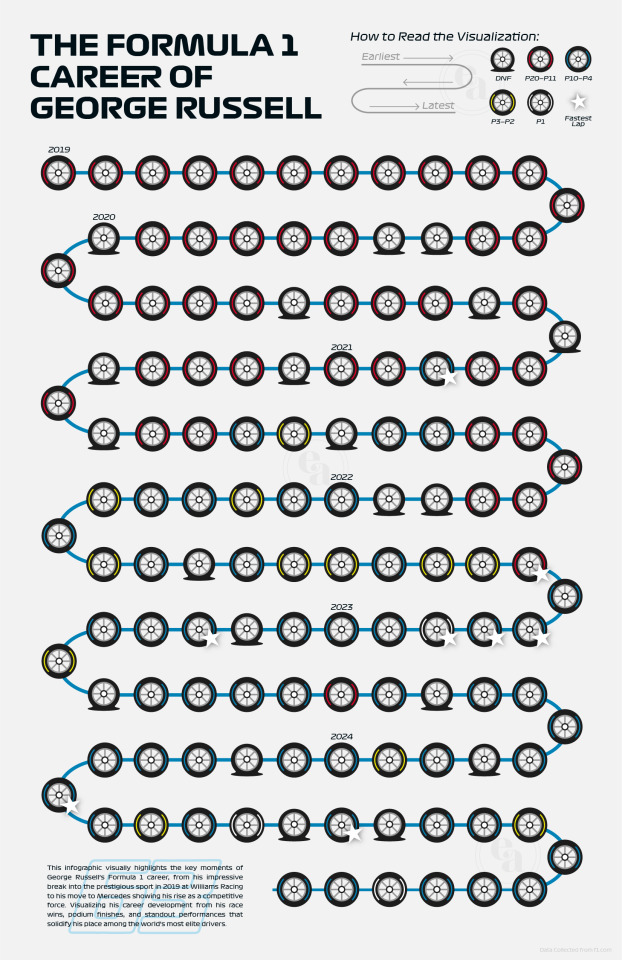
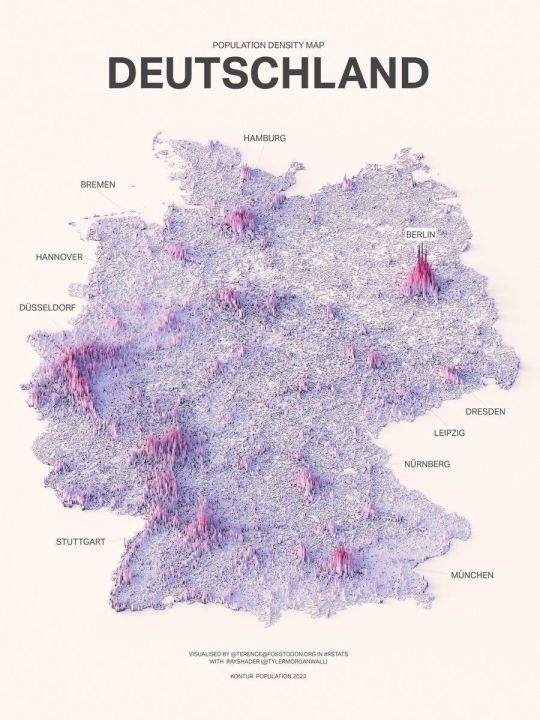
The Formula 1 Career of George Russell: A Visualization
2 Teams. 128 Career Races. 711 Career Points. 8 Fastest Laps.
George's Russell's entire Formula 1 career thus far is summarized and displayed visually in these two infographics. Exploring data visualization design through the extensive and detailed data provided by Formula 1 on their website, I was able to compare the difference between more formal and statistical design against creative and symbolic design options.
(Note: The infographic on the left was my final assignment submission and thus the information ended just after the Vegas GP 2024 weekend because of where the due date fell in the F1 calendar.)
#i loveee how in the one on the right to can literally see when he switched teams LOL#the one on the left is my favourite because it just shows data patterns so nicely#not that anyone asked but i got 100% on this assignment mwah#thank you george this ones for you baybee#f1#formula 1#f1 data#george russell#george russell f1#information design#infographic#f1 art#formula 1 art#mercedes f1#williams f1#graphic design#f1 fanart#gr63#fanart#formula one fanart#formula 1 fanart
31 notes
·
View notes
Text

#St. Patrick's Day#infographic#data#Saint Patricks Day#wear green#parade#Chicago River#shamrock#corned beef#beer#St Patrick's
20 notes
·
View notes
Text
the state of lesbian/sapphic representation in media feels like watching remake after remake of brokeback mountain but with gay women instead, and therefore nobody really cares if they get an unhappy ending.
#according to Autostraddle's infographic only 8% of queer women in US shows get an happy ending => which means around 30 characters (#(as per 2016)#which are partial datas that should be taken with a pinch of salt#and also from almost 10 years ago#but still
8 notes
·
View notes
Text

Useful Information.
#useful information#vintage illustration#graphics#infographics#information#illustration#tables#weights#measures#weights & measures#writing tablets#data#knowledge#learning aids
9 notes
·
View notes
Text

#3d#3dcd#infographic#old internet#found image#car crash#car wreck#video game#screnshot#data#heat map#white background#white#xvisualtreasure09x
5 notes
·
View notes
Photo

2 notes
·
View notes
Text
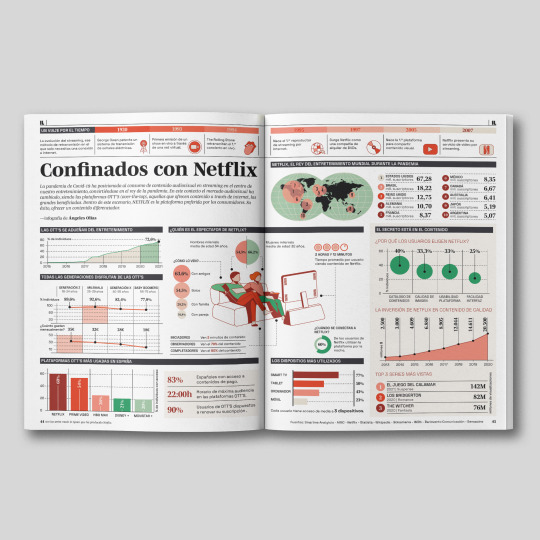


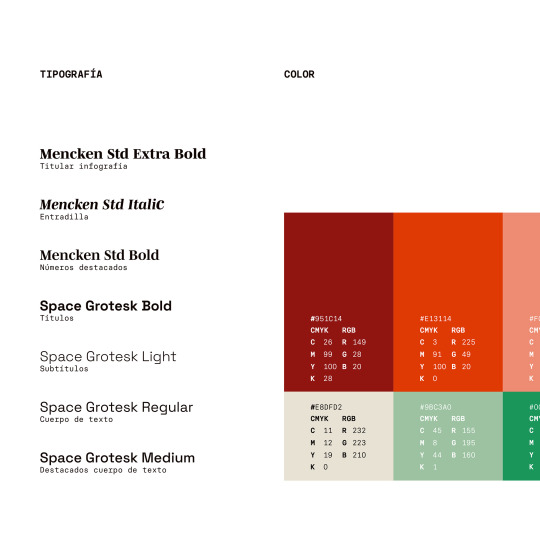


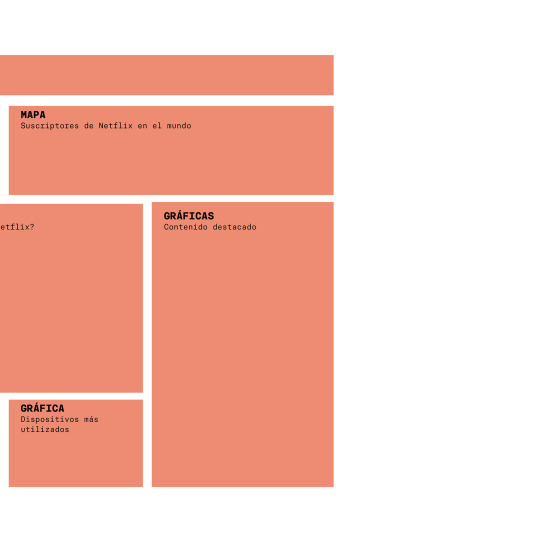

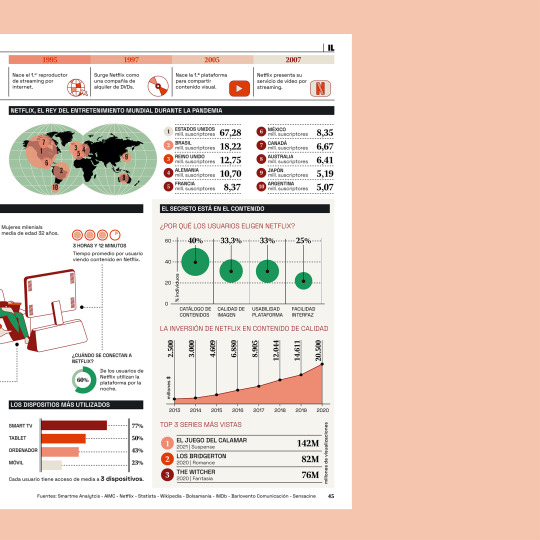
La Hauss. Máster Online Diseño Gráfico 2021-22. Infografía para publicación. Trabajo de María de los Ángeles Olías Archilla.
#diseño gráfico#graphic design#Ángeles Olías#Angie Solar#infografía#infografía IL#infographics#data design#gráficos estadísticos#gráficas#visualización de datos#visual data#La Hauss#lahauss#diseño#design
16 notes
·
View notes
Text
HELLO! Are you or someone you know confused about voting or have a weird situation and haven’t figured it out yet?
I have some helpful infographics for you!!
Can you still register?*
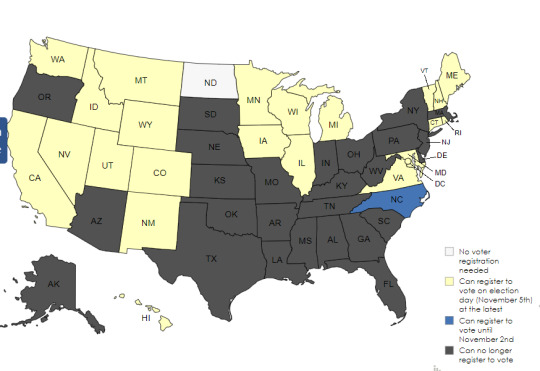
*Information found here, please double check. Some weird circumstances like moving after registering before may still allow affidavit voting, sometimes asking in person or over the phone may be best to make absolutely sure you can’t vote.
Can you early vote right now?*
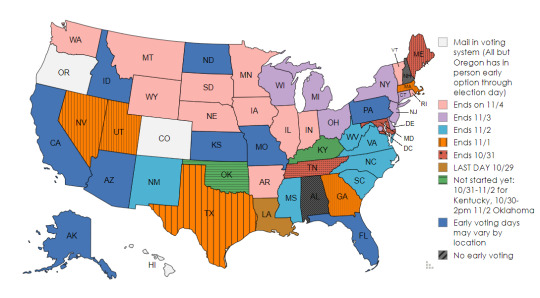
*Information found here, please double check. This is referring to early voting in person. This should avoid the longest lines on Election Day and works if you can’t easily make it that day. Check the hours and places available in your region.
Can you still apply for mail in ballot?*

*Information found here, please double check. This is referring to applying for absentee or mail in ballots and when the application needs to be received. Some states have different rules on what qualifies or last minute emergency exceptions past this, so again, calling or asking in person helps. Some states have specific offices to do this. The time of day of the deadline can differ.
Can you still send in a mail in ballot?*
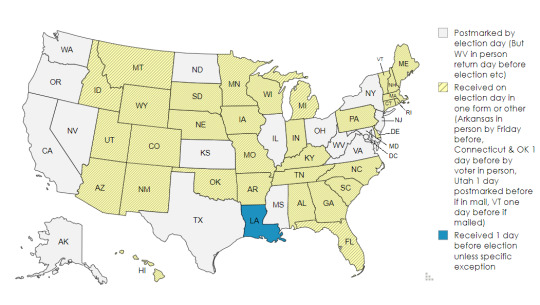
*Information found here, please double check. This is referring to when mail in ballots have to be postmarked or received. This often differs if handed in person, sent by mail, or handed in my an emergency designated person. If you lose it, you can often vote in person instead and sign an affidavit that you won’t send in a second vote etc. The time of day even differs on these deadlines or where you can drop them off.
**More Disclaimers: Some states require identification, some require proof of residence, the point is there are a lot of niche rules so you should act now if you are eligible to vote regardless of circumstance to figure out if it’s at all possible. Don’t assume anything. So many people are disenfranchised by this confusing process, do the best you can to ensure they can’t do it to you. Even down ballot voting can be life or death for some people right now, and generally a lot of impact on yourself and others, so if you can’t vote this time around ensure you register for future years. If you are reading this not in 2024, these maps will be outdated since some deadlines are days of the week before elections and not calendar dates.
Here’s another post that has more helpful links for registering figuring out where you can vote, checking your registration etc. A helpful FAQ if you will. Both of these took forever to make but it was very rewarding if it helps anyone. This is a really anxious time for a lot of us, so doing something really helps, even if it’s just getting the word out and sharing.
#politics#meme#lgbtq#donald trump#kamala 2024#kamala harris#vote blue#vote kamala#register to vote#please vote#go vote#usa politics#election 2024#presidential election#tim walz#harris walz 2024#doom scrolling#infographic#data#helpful#this took way too long
5 notes
·
View notes
Text

Love Actually infographically. A graphic I made in 2009. I remastered it a bit to look nicer on today’s screen resolutions 💖🎄💖
11 notes
·
View notes
Text
S1000d Software Working Process - Code and Pixels
A new buzzword in the technical publishing world. New word? Not exactly new, but surely it’s a new word in the Indian Defense Technical Publishing segment.
S1000D is an Interactive Electronic Technical Publishing(IETP). It’s also called #ietm too.
S1000d is not new but very few Indian companies, which support documentation of foreign Airline documentation are similar to #S1000d word. But almost 90 % of the people who do S1000D conversation do not know what s1000d is.
#s1000d#s1000d benefits of xml#s1000d data module code#s1000d ietm#s1000d infographics#s1000d software#s1000d standard for technical publications#s1000d working process#s1000d basic principle#what is s1000d#s1000d ietm ietp#benefits of s1000d#s1000d standard pdf#s1000d pdf#s1000d download#s1000d example#s1000d chapters#s1000d explained#why s1000d#Electronic Technical Manuals#Hyderabad IETM developers#IETM#IETM vendors#IETM Designers#IETM Designing#companies of Hyderabad#IETM Development#e-content#IETM Development In India#IETM Framework
2 notes
·
View notes
Text

21 notes
·
View notes
Text

My dog Potato's Wisdom Panel test results, visualized as a Voronoi treemap
I'm selling these personalized with your dog's information. Check them out in my Ko-fi Shop.
4 notes
·
View notes
Text
Best Graph Making Tools

Follow @everythingaboutbiotech for informative and useful stuff ✨
#DataViz#DataVisualization#Graphs#Charts#DataGraphs#GraphDesign#Infographics#DataAnalytics#ChartTypes#BarChart#PieChart#LineGraph#GraphSoftware#ExcelCharts#TableauViz#DataStorytelling#FlowChart#OrgChart#Data#Analytics#Numbers#Statistics#DataScience#BigData#Dashboard
9 notes
·
View notes