#Enabling traffic on localhost firewall
Explore tagged Tumblr posts
Visit Tumblr Blog
Explore Tumblr blogs with no restrictions, modern design and the best experience.
Last Seen Tumblr Blogs


Fun Fact
In 2020, 44% of users from Denmark used Tumblr daily.
Text
#Playstation7 Security backend FireWall Dynamic Encryption, NFT integration CG’s and Online Store, Game download, installation and run processes.

Creating a comprehensive backend system for a console that integrates security, encryption, store functionality, NFT integration, and blockchain encoding is an extensive task, but here’s a detailed outline and code implementation for these components:

1. Security and Firewall System with Dynamic Encryption
The security system will need robust firewalls and periodic encryption mechanisms that update dynamically every 5 minutes and every 30th of a second.
1.1 Encryption Structure (Python-based) with Time-Based Swapping
We’ll use the cryptography library in Python for encryption, and random for generating random encryption keys, which will change periodically.
Encryption Swapping Code:
import os
import time
import random
from cryptography.fernet import Fernet
class SecuritySystem:
def __init__(self):
self.current_key = self.generate_key()
self.cipher_suite = Fernet(self.current_key)
def generate_key(self):
return Fernet.generate_key()
def update_key(self):
self.current_key = self.generate_key()
self.cipher_suite = Fernet(self.current_key)
print(f"Encryption key updated: {self.current_key}")
def encrypt_data(self, data):
encrypted = self.cipher_suite.encrypt(data.encode())
return encrypted
def decrypt_data(self, encrypted_data):
return self.cipher_suite.decrypt(encrypted_data).decode()
# Swapping encryption every 5 minutes and 30th of a second
def encryption_swapper(security_system):
while True:
security_system.update_key()
time.sleep(random.choice([5 * 60, 1 / 30])) # 5 minutes or 30th of a second
if __name__ == "__main__":
security = SecuritySystem()
# Simulate swapping
encryption_swapper(security)
1.2 Firewall Setup (Using UFW for Linux-based OS)
The console could utilize a basic firewall rule set using UFW (Uncomplicated Firewall) on Linux:
# Set up UFW firewall for the console backend
sudo ufw default deny incoming
sudo ufw default allow outgoing
# Allow only specific ports (e.g., for the store and NFT transactions)
sudo ufw allow 8080 # Store interface
sudo ufw allow 443 # HTTPS for secure transactions
sudo ufw enable
This basic rule ensures that no incoming traffic is accepted except for essential services like the store or NFT transfers.
2. Store Functionality: Download, Installation, and Game Demos
The store will handle downloads, installations, and demo launches. The backend will manage game storage, DLC handling, and digital wallet integration for NFTs.

2.1 Download System and Installation Process (Python)
This code handles the process of downloading a game, installing it, and launching a demo.
Store Backend (Python + MySQL for Game Listings):
import mysql.connector
import os
import requests
class GameStore:
def __init__(self):
self.db = self.connect_db()
def connect_db(self):
return mysql.connector.connect(
host="localhost",
user="admin",
password="password",
database="game_store"
)
def fetch_games(self):
cursor = self.db.cursor()
cursor.execute("SELECT * FROM games")
return cursor.fetchall()
def download_game(self, game_url, game_id):
print(f"Downloading game {game_id} from {game_url}...")
response = requests.get(game_url)
with open(f"downloads/{game_id}.zip", "wb") as file:
file.write(response.content)
print(f"Game {game_id} downloaded.")
def install_game(self, game_id):
print(f"Installing game {game_id}...")
os.system(f"unzip downloads/{game_id}.zip -d installed_games/{game_id}")
print(f"Game {game_id} installed.")
def launch_demo(self, game_id):
print(f"Launching demo for game {game_id}...")
os.system(f"installed_games/{game_id}/demo.exe")
# Example usage
store = GameStore()
games = store.fetch_games()
# Simulate downloading, installing, and launching a demo

store.download_game("http://game-download-url.com/game.zip", 1)
store.install_game(1)
store.launch_demo(1)
2.2 Subsections for Games, DLC, and NFTs
This section of the store manages where games, DLCs, and NFTs are stored.
class GameContentManager:
def __init__(self):
self.games_folder = "installed_games/"
self.dlc_folder = "dlcs/"
self.nft_folder = "nfts/"
def store_game(self, game_id):
os.makedirs(f"{self.games_folder}/{game_id}", exist_ok=True)
def store_dlc(self, game_id, dlc_id):
os.makedirs(f"{self.dlc_folder}/{game_id}/{dlc_id}", exist_ok=True)
def store_nft(self, nft_data, nft_id):
with open(f"{self.nft_folder}/{nft_id}.nft", "wb") as nft_file:
nft_file.write(nft_data)
# Example usage
manager = GameContentManager()
manager.store_game(1)
manager.store_dlc(1, "dlc_1")
manager.store_nft(b"NFT content", "nft_1")
3. NFT Integration and Blockchain Encoding
We’ll use blockchain to handle NFT transactions, storing them securely in a blockchain ledger.
3.1 NFT Blockchain Encoding (Python)
This script simulates a blockchain where each block stores an NFT.
import hashlib
import time
class Block:
def __init__(self, index, timestamp, data, previous_hash=''):
self.index = index
self.timestamp = timestamp
self.data = data
self.previous_hash = previous_hash
self.hash = self.calculate_hash()
def calculate_hash(self):
block_string = f"{self.index}{self.timestamp}{self.data}{self.previous_hash}"
return hashlib.sha256(block_string.encode()).hexdigest()
class Blockchain:
def __init__(self):
self.chain = [self.create_genesis_block()]
def create_genesis_block(self):
return Block(0, time.time(), "Genesis Block", "0")
def get_latest_block(self):
return self.chain[-1]
def add_block(self, new_data):
previous_block = self.get_latest_block()
new_block = Block(len(self.chain), time.time(), new_data, previous_block.hash)
self.chain.append(new_block)
def print_blockchain(self):
for block in self.chain:
print(f"Block {block.index} - Data: {block.data} - Hash: {block.hash}")
# Adding NFTs to the blockchain
nft_blockchain = Blockchain()
nft_blockchain.add_block("NFT1: Digital Sword")
nft_blockchain.add_block("NFT2: Magic Shield")
nft_blockchain.print_blockchain()
3.2 NFT Wallet Transfer Integration (Python)
This script will transfer NFTs into wallets or digital blockchain systems.
class NFTWallet:
def __init__(self):
self.wallet = {}
def add_nft(self, nft_id, nft_data):
self.wallet[nft_id] = nft_data
print(f"Added NFT {nft_id} to wallet.")
def transfer_nft(self, nft_id, recipient_wallet):
if nft_id in self.wallet:
recipient_wallet.add_nft(nft_id, self.wallet[nft_id])
del self.wallet[nft_id]
print(f"Transferred NFT {nft_id} to recipient.")
# Example usage
user_wallet = NFTWallet()
user_wallet.add_nft("nft_1", "Digital Art Piece 1")
recipient_wallet = NFTWallet()
user_wallet.transfer_nft("nft_1", recipient_wallet)
4. CG (Computer Graphics) Storage for Cutscenes and Artwork
4.1 Storing and Retrieving CG Assets
This system stores CG assets (cutscenes, artwork, etc.) for later viewing and reminiscing.
class CGStorage:
def __init__(self):
self.cg_folder = "cg_assets/"
os.makedirs(self.cg_folder, exist_ok=True)
def store_cg(self, cg_id, cg_data):
with open(f"{self.cg_folder}/{cg_id}.mp4", "wb") as cg_file:
cg_file.write(cg_data)
print(f"CG {cg_id} stored.")
def retrieve_cg(self, cg_id):
with open(f"{self.cg_folder}/{cg_id}.mp4", "rb") as cg_file:
return cg_file.read()
# Example usage
cg_storage = CGStorage()
cg_storage.store_cg("cutscene_1", b"CG video data")
cg_data = cg_storage.retrieve_cg("cutscene_1")
Summary of the System:

1. Security: Dynamic encryption swaps with regular firewall management.
2. Store: Handles game downloads, installations, and demo launches, including storage for games, DLC, and NFTs.
3. NFT Integration: A blockchain-based system for NFT encoding and wallet transfers.
4. CG Storage: Storing and retrieving game cutscenes and artwork for later viewing.
This framework is scalable and can be extended as the console ecosystem grows. Each component works independently but can be integrated into a larger gaming console backend system.


#playstation7#ps7#deardearestbrands#digitalconsole#framework#python#soundcloud#celestiallink#raw code#rawscript#blockchain#NFTs#Security#Frontend#backend#encryption processes
3 notes
·
View notes
Text
Introduction to Server and Network Programming

Server and network programming is essential for building applications that communicate over the internet or local networks. From creating web servers to building chat apps or IoT solutions, understanding networking fundamentals is key for any modern developer.
What is Server and Network Programming?
Server and network programming involves writing code that enables applications to communicate with each other over a network. This includes:
Creating and managing servers
Establishing network connections
Sending and receiving data (HTTP, TCP/IP, UDP)
Managing client-server interactions
Common Use Cases
Web servers and APIs
Chat applications
Multiplayer games
IoT device communication
File transfer services
Key Concepts in Network Programming
IP Address: Identifies a device on a network
Port: Endpoint for communication on a device
Client-Server Model: One device requests (client), another responds (server)
Protocols: Rules for data exchange (TCP, UDP, HTTP, FTP, etc.)
Sockets: Programming interface for network communication
Popular Languages for Network Programming
Python: Great for rapid prototyping and learning (socket, asyncio, Flask)
JavaScript/Node.js: Ideal for real-time apps (Express, WebSockets)
Java: Enterprise-grade networking (ServerSocket, RMI)
C/C++: Low-level networking with high performance (raw sockets)
Go: Fast and efficient concurrency (net/http, goroutines)
1. Creating a Simple Server in Python
import socket server = socket.socket(socket.AF_INET, socket.SOCK_STREAM) server.bind(('localhost', 8080)) server.listen(1) print("Waiting for a connection...") conn, addr = server.accept() print(f"Connected to {addr}") conn.send(b"Hello from the server!") conn.close()
2. Making a Request (Client Side)
import socket client = socket.socket(socket.AF_INET, socket.SOCK_STREAM) client.connect(('localhost', 8080)) message = client.recv(1024) print("Received:", message.decode()) client.close()
3. RESTful API with Node.js
// Install Express first: npm install express const express = require('express'); const app = express(); app.get('/', (req, res) => res.send('Hello from Node server!')); app.listen(3000, () => console.log('Server running on port 3000'));
4. Real-Time Communication with WebSockets
Use WebSockets for two-way communication:
Socket.io (Node.js)
ws library (JavaScript)
WebSocket library (Python)
5. Network Security Basics
Use HTTPS to encrypt web traffic
Sanitize inputs to avoid injection attacks
Use authentication tokens or API keys
Implement firewalls and access control
6. Tools and Protocol Analyzers
Wireshark: Analyze network packets
Postman: Test HTTP APIs
Netcat: Debug and scan ports
Ping/traceroute: Diagnose connectivity
Conclusion
Server and network programming are crucial for building scalable, efficient, and connected applications. Whether you're interested in building a simple REST API or a real-time multiplayer game, a strong grasp of networking concepts will take your skills to the next level.
0 notes
Text
127.0.0.1:49342 Localhost IP Address Explained: The Ultimate Guide

127.0.0.1 is the typical loopback IP address; accessing this IP connects you to your system, not the Internet. There are a lot of complicated words and terms used in computers. Each one is important and makes a difference. Not every user, nevertheless, is aware of them. One of the typical terms usually shown on a computer screen when working on some programs is 127.0.0.1:49342. Most people are unaware of it, so it seems to be the leading cause of problems. We must first have a fundamental knowledge of IP addresses, sometimes known as internet protocol, to solve this problem. Knowing how it operates will help us to fix this mistake effectively. Below, we have clarified what an IP address is and why it is significant. Keep sliding down the post underneath to find further specifics regarding this 127.0.0.1:49342. What is 127.0.0.1? The loopback address, 127.0.0.1, is a special-purpose IPv4 address. It creates an IP link to the same machine or computer the end-user is running. This lets the computer interact with itself since any network demand issued to 127.0.0.1 is replayed back. Debugging network programs and testing depend on this loopback mechanism. Port 49342: Its Importance In networking, a port is a logical endpoint that designates a particular process or service. Port numbers run from 0 to 65535 and have different uses. Specifically, Port 49342 is private or dynamic. Often used for bespoke or temporary needs, the IANA does not reserve these ports (49152–65535), Internet Assessed Numbers Authority. Benefits of 127.0.0.1:49342 Employing this specific IP address has several benefits, including: Testing and Development: connection and may test apps without compromising the network or any other system. Making sure the traffic stays within your local machine—that is, the computer—allows no outside access, mitigating possible security hazards. Because communication between the same machine is far faster than any external network, this Loopback address lets the machine operate far faster. It lessens the demand for extra resources, including a network, which improves test performance. Developers can rapidly and effortlessly test modifications and identify environmental problems free from constant network assistance. Applications can operate concurrently on the same machine without issues using the address and several ports, including the 49342. Setting Up The Address These guidelines will help you to arrange the 127.0.0.1:49342 address following: Install any program on your computer, such as Ngnix, Apache, or IIS. This program will enable your machine to serve local web content. Open the configurable options on the selected program and arrange the server to port 49342. Ensure the program has permission to read from and write to the required folders you will have to create where your web will be kept. Restart your program to implement the fresh settings you just changed; next, open a browser and visit your site or application using the address "127.0.0.1:49342" to verify and guarantee everything is operating as intended. You set up the address this way; if necessary, utilize virtualization tools like VirtualBox or Docker to build and oversee virtual environments. Common Problems: Troubleshooting Should you run across any difficulties, Use these troubleshooting guides to correct the IP address setup: Ensure the server settings are mistakes-free, and verify that port 49342 is free. Confirm that the server can access necessary files and that the firewall lets port 49342. Comfin if you did not miss anything and are utilizing the "127.0.0.1:49342". Changes Not Applicable: Researt following your adjustments and search logs for any error notes. Should the pages not be located, confirm whether the files are in the correct location and whether the names exactly match.404 Error Ensure you have enough CPU and memory, and check any logs for fault specifics. The Key Function of Port 49342 Network Resources and Uses Dynamic port 49342 is not linked to any one service or protocol. This adaptability makes it the perfect alternative for system managers and developers needing a port for temporary or custom services. Using a dynamic port such as 49342 helps developers avoid problems with well-known ports set aside for conventional services (e.g., HTTP on port 80 and HTTPS on port 443). Testing and Correcting Problems Debugging and testing constitute one of the main applications of 127.0.0.1:49342. Testing a network application in a controlled environment is crucial when designing one. Developers can replicate network communication without compromising other network activity by tying the application to 127.0.0.1:49342. Before putting the program into use in a production setting, this approach guarantees accurate operation, helps to spot problems, and maximizes performance. Processing Localhost Operations First, you must start setting or installing any currently used server or program on your computer, such as Nlinux, Apache, or IIS. You can run your applications on localhost once the program is effectively implemented. Moreover, you must develop server software coupled with port 49342 to arrange communication between services and apps. This will cause the gadget to start picking up the incoming connections. Furthermore, you may also implement the necessary changes in the service's configuration file. Establish the field paths afterward and get your server access to the right. To complete the assignment, you must build the correct folders to save your site and apps. Visit your website at 127.0.0.1:49342 to confirm your server setup next-wise. It should all be in order, and your computer should show your website or application running without problems. Finally, you could want to build and oversee virtualized machines using the Docker or Virtual Box tools. Conclusion You have it right now! Although, at first look, 127.0.0.1:49342 seems mysterious, it is a valuable tool for developers and anybody wishing to play about with their computer's network. Understanding its elements and possible applications will help you to maximize it while considering security. FAQs While talking about networking, how crucial is crypto code 127.0.0.1:49342? Although we are talking about networking, local communication depends on this crypto code; therefore, it is essential to address this issue. It lets programs on one device interact safely without outside network connections. In what ways might port 49342 enhance communication? Port 49342 improves device inter-app contact. It fixing technological problems. Tools for debugging can also be helpful if issues continue even after port change. For testing and development, is 127.0.0.1:49342 safe? It is indeed safe for testing and development. It offers correct security mechanisms to stop illegal access. Read the full article
0 notes
Text
IPTABLES : Introduction to Linux Firewall
IPTABLES : Introduction to Linux Firewall

IPTABLES : Introduction to Linux Firewall
Linux is the most-used open source operating system. Managing network traffic is one of the toughest jobs to deal with. For this, we must configure the firewall in such a way that it meets the system and users requirements without leaving the system vulnerable. The default firewall in most of the Linux distributions is IPTables.
IPTables is a standard…
View On WordPress
#and SSL port firewall#Checking current Iptables status#Checking current Iptables status firewall#Defining chain rules firewall#Defining chain rules iptables#Deleting rules of iptables#Dropping all other traffic iptables#Enabling connections on HTTP#Enabling traffic on localhost firewall#Enabling traffic on localhost iptables#Filtering packets based on source iptables#installing firewall#installing iptables#IPTABLES : Introduction to Linux Firewall#Linux#Save changes to iptables#SSH
0 notes
Text
Tips and hacks for running a successful Tezos node
If you're running a Tezos node, there are a few things you can do to make sure your node is running efficiently and contributing to the network. Here are some tips and tricks:
1. Keep your client up-to-date: Make sure you have the latest version of the Tezos Client installed on your machine. This will ensure that you're using the most up-to-date protocol and blockchain data.
2. Keep your nodes running constantly: Never let your nodes go idle for more than a few minutes at a time. The more your node is running, the less you'll be using electricity and the better it will help your node contribute to the network.
3. Monitor your nodes Be sure to monitor and understand how much bandwidth Tezos nodes are consuming. You can do this by monitoring your local node's load from within the client.
4. Keep an eye on your wallet The wallet is where your funds are stored and is the most critical part of running a Tezos node.
Running a successful Tezos node can be difficult, but with a little effort and knowledge, it is possible. This article provides tips and tricks to help make running a Tezos node easier. These include setting up a secure environment, understanding the network protocol, and optimizing performance.
Running a node on the Tezos network is essential for participating in the network and maintaining a full copy of the ledger. Here are some tips and tricks to help you get started.
1. Before getting started, make sure you have installed the Tezos software. You can download it from tezos.org or follow instructions here.
2. Once you have installed Tezos, start by creating a new wallet. To do this, open up tezos-wallet-setup and follow the prompts. This will create a new wallet file in your home directory. 3. Once you have a wallet, you can go to http://localhost:8081 to spin up your node.
4. Follow the instructions on the screen to complete your node setup. 5. You will be asked for a hostname to use for your node so that other nodes can discover it and connect to you. For example, you might name your node jane or bob.
Running a successful Tezos node can be a challenging task, but with the right tips and tricks, it's possible to make it work. Here are some tips to help you get started:
1. Have a robust understanding of the blockchain - Before you start hosting Tezos nodes, make sure you have a good understanding of the blockchain and its properties. Understanding how blocks are created, validated and propagated is key to running an efficient node.
2. Have a robust network infrastructure - A strong network infrastructure is essential for hosting Tezos nodes. However, it can be difficult to get a fully robust network. So, the following are some tips to help you get there: - Ensure that your DNS servers are capable of resolving Tezos nodes. - Ensure that your routing rules allow traffic on port 9001 (standard tezos node port). - Ensure that your firewall rules allow traffic on port 9001. - Enable Tezos monitoring via Nagios or Zabbix. (See https://github.com/TezosFoundation/tezosd for example). - Check that you can connect to other nodes and the blockchain.
3. 2.2. Geth¶ There are two primary ways to run a Tezos node: via go-ethereum (Geth) and via Geth + Truffle framework. The following section will cover running Geth. 3 2.2.1. Installing and Running Geth Download Geth from github https go-ethereum geth If you are unsure what version of Go to use, see the The definitive reference on Go: Using Go 1.
1 note
·
View note
Text
Are you looking for that ultimate SSH Commands cheat sheet?. This SSH Cheat Sheet contains SSH commands you need for your daily administration of Linux Infrastructure. SSH which is also referred to as Secure Shell is a cryptographic network protocol for operating network services securely over an unsecured network. To start using different ssh command-line options, follow this guide along and feel free to test all these commands. You can practice in Virtual environments like VirtualBox or VMware Workstation instead of running everything in the Production environment. 1. SSH via pem file ( private key) If you want to access a remote server using a Pem key, the command syntax is: $ ssh -i /path/to/file.pem user@server A path to private key file follows after -i flag. 2. Connect to a non-standard ssh port: The default SSH port is 22, to access a remote system with a different service port, use the -p option. $ ssh -p 2222 [email protected] Here, we’re connecting to the SSH server running on port 2222. The port has to be allowed on the firewall. 3. Connect and forward the authentication agent Use the -A option to enable the forwarding of the authentication agent. $ ssh -A user@server This can also be specified on a per-host basis in a configuration file. 4. Connect and execute a command on a remote server: At times you want to run a command on bash shell on a remote server. This is achieved by passing the command and its options after the server part. $ ssh -t user@server'the-remote-command' -t is used to force pseudo-terminal allocation. This can be used to execute arbitrary screen-based programs on a remote machine, which can be very useful, e.g. when implementing menu services. As an example, let’s connect to a server and do a ping to 8.8.8.8, with a count of 3. $ ssh outboundmx-01 'ping -c 3 8.8.8.8' PING 8.8.8.8 (8.8.8.8) 56(84) bytes of data. 64 bytes from 8.8.8.8: icmp_seq=1 ttl=60 time=6.74 ms 64 bytes from 8.8.8.8: icmp_seq=2 ttl=60 time=7.27 ms 64 bytes from 8.8.8.8: icmp_seq=3 ttl=60 time=6.77 ms --- 8.8.8.8 ping statistics --- 3 packets transmitted, 3 received, 0% packet loss, time 2004ms rtt min/avg/max/mdev = 6.740/6.930/7.271/0.241 ms SSH session will exit after executing specified commands. 5. Tunnel an X session over SSH: The -X option in ssh is used to enable X11 forwarding. This can also be specified on a per-host basis in a configuration file. X11 forwarding can be disabled using -x Disables option. ssh -X user@server An example below will: Redirect traffic with a tunnel between localhost (port 8080) and a remote host (remote.example.com:5000) through a proxy (personal.server.com): $ ssh -f -L 8080:remote.example.com:5000 [email protected] -N -N means do not execute a remote command. This is useful for just forwarding ports. 6. Launch a specific X application over SSH: Use the -X option to launch an application through ssh session. $ ssh -X -t user@server 'firefox' This will launch Firefox application and display UI on the local machine. 7. Create a SOCKS proxy tunnel $ ssh -D 9999 user@server This will create a SOCKS proxy on localhost and port 10000. The way this works is by allocating a socket to listen to port on the local side, optionally bound to the specified bind_address. Whenever a connection is made to this port, the connection is forwarded over the secure channel, and the application protocol is then used to determine where to connect to from the remote machine. Currently the SOCKS4 and SOCKS5 protocols are supported, and ssh will act as a SOCKS server. Note that only root can forward privileged ports. 8. SSH with data compression and encryption To request compression of all data (including stdin, stdout, stderr, and data for forwarded X11, TCP and UNIX-domain connections, -C option is used. This is desirable when working with modems and other slow connections systems. Do not use this on faster networks since it will just slow things down.
The compression algorithm is the same used by gzip. -c is used to specify the cipher specification for encrypting the session. More than one listing is done by separating them with commas. Example $ ssh user@server -C -c blowfish -X -X –> Use an X session -C –> Do data compression -c –> Use blowfish encryption for ssh session 9. SSH copy files An example below shows how to compress files on a remote server and copy to the local system by piping to tar. Compression and uncompression is done using tar command. This is useful if you don’t have scp or rsync which act as ssh clients. $ ssh jmutai@outboundmx-01 "cd ~/mydir; \ tar zcf - file1.txt file2.txt" | tar zxf - # confirm if copied $ ls file1.txt file2.txt 10. Force Publick key Copy to a remote server You’re trying to copy ssh key but keeps getting a failure. You can force the copy using the commands: $ SSH_OPTS='-F /dev/null' ssh-copy-id user@server 11. Save private key passphrase With ssh, you can configure authentication agent to save password so that you won’t have to re-enter your passphrase every time you use your SSH keys. eval $(ssh-agent) # Start agent on demand ssh-add # Add default key ssh-add -l # List keys ssh-add ~/.ssh/id_rsa # Add specific key ssh-add -t 3600 ~/.ssh/id_rsa # Add with timeout ssh-add -D # Drop keys 12. Mount folder/filesystem through SSH Install SSHFS from https://github.com/libfuse/sshfs . Installation and usage of SSHFS are covered on a different article: Installing sshfs and using sshfs on Ubuntu / Fedora / Arch This command will mount remote directory to the local machine. $ sshfs name@server:/path/to/folder /path/to/mount/point Once done, you can unmount directory using: $ fusermount -u mountpoint 13. Read files using macs through SSH Documentation is on Emacs mount Remote files After installing Emacs, reading of the remote file is done using: $ emacs /ssh:name@server:/path/to/file 14. Deleting IP address/hostname on ~/.ssh/known_hosts file. Sometimes you want to copy ssh key to a remote server and you get a warning that the IP/hostname already exist in ~/.ssh/known_hosts, to remove the entry, use: $ ssh-keygen -f .ssh/known_hosts -R ip-or-hostname 16. Update SSH Key passphrase Use our guide for updating or changing an SSH key passphrase. How to change or update SSH key Passphrase on Linux / Unix 17. Changing SSH Service Port The following guide should be helpful. Changing SSH Port on CentOS/RHEL& Fedora With SELinux Enforcing Wrapping Up Secure Shell (SSH) allows the exchange of data over a secure channel between two computers. This will act as an ultimate ssh cheatsheet for Linux SysAdmins. You can drop a comment for any commands you often used but not covered here, I’ll be happy to update.
0 notes
Text
How to remove kms ms office activator

How to remove kms ms office activator install#
How to remove kms ms office activator windows#
How to remove kms ms office activator install#
Select Install your KMS host key and enter the product key for your organization, then select Commit. Select Key Management Service (KMS) as the activation type and enter localhost to configure the local server or the hostname of the server you want to configure. Launch the Volume Activation Tools wizard by running: vmw.exe In the example below, the firewall rule is configured to allow network traffic for the Domain and Private network profiles only: Set-NetFirewallRule -Name SPPSVC-In-TCP -Profile Domain,Private -Enabled True By default, a KMS host is configured to use TCP on port 1688. You can allow this for any network profiles (default), or for any combination of Domain, Private, and Public network profiles.
How to remove kms ms office activator windows#
You can get this key from the Product Keys section of the Volume Licensing Service Center.įrom an elevated PowerShell session, run the following command to install the Volume Activation Services role: Install-WindowsFeature -Name VolumeActivation -IncludeManagementToolsĬonfigure the Windows Firewall to allow the Key Management Service to receive network traffic. The user account you use must be a member of the Administrators group on the KMS host.Ī KMS host key for your organization. A KMS host running on a Windows Server operating system can activate computers running both server and client operating systems, however a KMS host running on a Windows client operating system can only activate computers also running client operating systems. Automatic publishing can be disabled and the records can be created manually, which is also necessary for automatic activation if the DNS service does not support dynamic updates.Ī computer running Windows Server or Windows. This enables KMS clients to automatically discover the KMS host and activate without the need for any configuration on the KMS client. Please see the table of activation versions to help you decide which is right for your environment.īy default, KMS hosts automatically publish SRV resource records in DNS. The version of Windows you use for your KMS host determines the version of Windows you can activate for your KMS clients. You can run a KMS host on any physical or virtual system that is running a supported Windows Server or Windows client operating system. KMS hosts do not need to be dedicated servers, and KMS can be co-hosted with other services. Most organizations can operate with as few as two KMS hosts for their entire infrastructure. If you have more than 50 clients, we recommend that you have at least two KMS hosts in case one of your KMS hosts becomes unavailable. PrerequisitesĪ single KMS host can support an unlimited number of KMS clients. To learn more about KMS and the initial planning considerations, see Key Management Services (KMS) activation planning. This article walks you through the steps you need to create a KMS host. The KMS clients that a KMS host can activate are dependent on the host key used to activate the KMS host. KMS clients connect to a KMS server, called the KMS host, for activation. KMS uses a client-server model to active Windows clients and is used for volume activation on your local network.
0 notes
Text
Monitor a MySQL Database Service (MDS) DB System with Grafana
Running a MySQL Database Service (MDS) DB System, the MySQL managed solution by Oracle MySQL on Oracle Cloud Infrastructure, means forgetting about time-consuming duties such as upgrades, backups and configuration, among others. It is so possible to focus on the service, on data and at the same time take advantage of the usual monitoring assets to configure and scale the service optimally. That’s what I want to talk about in this post: how to monitor a DB System in a few steps. OCI MDS OS Metrics Charts An MDS DB System compute instance file system is protected from any access, but you don’t need to access it to create system metrics, as these are already exposed on your DB System administration page in OCI dashboard. System charts exposed for the compute instance hosting the DB System It is also possible to take advantage of OCI services to raise alarms when certain metric reaches a configurable threshold and be notified about the event. Refer to docs. So let’s move forward to more interesting stuff. OCI MDS DB System Charts Talking about the very DB System metrics to understand how well is doing the server with our service workload, OCI dashboard related panel provides basic information about MySQL metrics, such as: Current connections Active connections Statement count This is probably not enough to a skilled DBA, but MySQL Database Service is not different from any other non managed MySQL Server, as it can be queried as usual to fetch information, just as an example, from: Performance schema Information schema Show engine InnoDB Status Status variables And with these, it is possible to build a monitoring system, or simply configure one of the many existing monitoring solutions. In this post I’ll show how to quickly setup a well known and professional (and open, and free) solution: the famous Grafana monitoring system. Grafana is web dashboard which can fetch metrics for anything measurable, by adding the proper data source. Here I will show a popular solution, that is the set Grafana + Prometheus + mysqld_exporter. Monitor an MDS DB System with GrafanaLet’s go in order, and I’ll go through setting up the different modules. This is not meant to be a tutorial to Grafana, but just a proof of concept and I strongly invite you to secure your setup once tested that everything working. Read more here about security. Install Grafana Let’s start playing with this. Log into your bastion host compute shape, which we’ll use to install Grafana. Check the download page and get the latest package. wget https://dl.grafana.com/oss/release/grafana-7.3.5-1.x86_64.rpm Now install the package, it will install grafana-server service: sudo yum localinstall grafana-7.3.5-1.x86_64.rpm If the installation completes without errors, you can go ahead and start the service. service grafana-server start Make sure it is started: service grafana-server status And make the service restart at host reboot: sudo systemctl enable grafana-server Grafana service runs on default port 3000, open in the firewall of this compute instance: sudo firewall-cmd --add-port=3000/tcp --permanentsudo firewall-cmd --reload Now browse to the subnet panel where your compute instance is deployed, click on the subnet and add an ingress rule allowing traffic on port 3000 (3000 is Grafana’s default port), you can simply allow traffic from any endpoint, but this is surely the place where you can select your client IP for increased security. Add an ingress rule for port 3000Save, and now you can point your browser to compute shape public IP (your compute shape bastion host is already on a public subnet, requirement to having a public IP). So, browse to: http://:3000 And you’re in! Just reset the password and authenticate. Reset Grafana’s passwordGrafana will show metrics collected for the instance you plan to monitor. For that, it can use the built-in MySQL data source, or an external data source. In this post I’ll show how to setup the classical solution with the well known Prometheus and mysqld_exporter. Before jumping into configuring the data source, be aware that you can also monitor OCI compute instances using the OCI data source plugin for Grafana, but we are not interested in this option because the host where the MySQL DB System is running is protected, and is already monitored as shown before. Anyway, here’s instructions if you’d like to monitor your bastion host or any other compute shape. Install Prometheus I have followed these clear instructions to setup Prometheus, just create user and group, download the latest package and set it up using the provided configuration. Refer to the blog linked, jump to “Installing & Configuring the Prometheus Server” and just use following configuration in file /etc/prometheus/prometheus.yml # my global config global: scrape_interval: 15s # Set the scrape interval to every 15 seconds. Default is every 1 minute. evaluation_interval: 15s # Evaluate rules every 15 seconds. The default is every 1 minute. # scrape_timeout is set to the global default (10s). # Alertmanager configuration alerting: alertmanagers: - static_configs: - targets: # - alertmanager:9093 # Load rules once and periodically evaluate them according to the global 'evaluation_interval'. rule_files: # - "first_rules.yml" # - "second_rules.yml" # A scrape configuration containing exactly one endpoint to scrape: # Here it's Prometheus itself. scrape_configs: - job_name: 'mysql_server1' static_configs: - targets: ['localhost:9104'] # The job name is added as a label `job=` to any timeseries scraped from this config. - job_name: 'prometheus' # metrics_path defaults to '/metrics' # scheme defaults to 'http'. static_configs: - targets: ['localhost:9090'] Once done with the procedure, you can start the service as usual. If you want to access Prometheus console in your browser, which needs TCP port 9090 open, remember to configure the firewall on your compute instance accordingly: sudo firewall-cmd --add-port=9090/tcp --permanent sudo firewall-cmd --reload Remember also to add an ingress rule in your public subnet, as done for Grafana, but this time on port 9090. To access Prometheus panel add an ingress rule to OCI public subnetAfterwards, you’ll be able to load the panel at the usual url, but won’t show any MySQL metric, because we haven’t configured http://:9090 Install mysqld_exporter mysqld_exporter is a middleware which captures and exposes MySQL metrics in a format Prometheus can understand. Prometheus has been configured to scrape a target on port 9104, the default mysqld_exporter data source, which we will now link to our MDS DB System we want to monitor. Also in this case, there are very good instructions to address the setup, such as these. So let’s download latest package: wget https://github.com/prometheus/mysqld_exporter/releases/download/v0.12.1/mysqld_exporter-0.12.1.linux-386.tar.gz Uncompress it, browse and move the package: tar xf mysqld_exporter-0.12.1.linux-386.tar.gz cd mysqld_exporter-0.12.1.linux-386 sudo mv mysqld_exporter /usr/local/bin/ Now create a MySQL user that mysqld_exporter will use to fetch metrics from the DB System (not monitoring the DB System locally, which is impossible because we can’t access the related host, then I will simply allow all “%” hosts). CREATE USER 'exporter'@'%' IDENTIFIED BY '' WITH MAX_USER_CONNECTIONS 3; GRANT PROCESS, REPLICATION CLIENT, SELECT ON *.* TO 'exporter'@'%'; Now edit configuration at /etc/.exporter.cnf, here’s my config. [client] user=exporter password= host= Add mysqld_exporter as service, and edit this file: sudo vi /lib/systemd/system/mysql_exporter.service With this configuration (here you can choose port and metric to be collected, let’s stick to port 9104 as configured earlier in Prometheus scrape endpoints): [Unit] Description=Prometheus MySQL Exporter After=network.target User=prometheus Group=prometheus [Service] Type=simple Restart=always ExecStart=/usr/local/bin/mysqld_exporter --config.my-cnf /etc/.exporter.cnf --collect.global_status --collect.info_schema.innodb_metrics --collect.auto_increment.columns --collect.info_schema.processlist --collect.binlog_size --collect.info_schema.tablestats --collect.global_variables --collect.info_schema.query_response_time --collect.info_schema.userstats --collect.info_schema.tables --collect.perf_schema.tablelocks --collect.perf_schema.file_events --collect.perf_schema.eventswaits --collect.perf_schema.indexiowaits --collect.perf_schema.tableiowaits --collect.slave_status --web.listen-address=0.0.0.0:9104 [Install] WantedBy=multi-user.target Finally reload services, enable the service at restart, start it and test it. sudo systemctl daemon-reload sudo systemctl enable mysql_exporter.service sudo systemctl start mysql_exporter.service sudo systemctl status mysql_exporter.service All done, verify that the three services you have setup so far are enabled at compute instance restart. systemctl list-unit-files | egrep -i "mysql_exporter|grafana|prometheus" grafana-server.service enabled mysql_exporter.service enabled prometheus.service enabled You can now check that Prometheus can fetch metrics correctly from the mentioned panel at: http://:9090 Make a search and verify it’s all working. Verify Prometheus is fetching metrics correctly through mysql exporter Point Grafana to Prometheus data source So far we have achieved: Grafana is set, reachable from the internet (port was opened on the public subnet, but it could also be reached within a VPN). Prometheus is running and configured and pointing to mysqld exporter And indeed mysqld exporter is running and pointing to the DB System We just need to point Grafana to Prometheus to complete the setup. Browse to Grafana/Configuration/Data Source/Add Data Source and configure the Prometheus instance we already set. Configure Prometheus data source in Grafana Make sure all is working when you click “Save & Test”, a message will inform if the connection was successful or not. Then you are good to go. Otherwise… jump to Troubleshooting section at the bottom of this post. Choose a Grafana Dashboard Ok, Grafana can fetch all the data it needs, it must only be instructed to show it in a convenient way. For that you need to either create your own dashboard or use one of those that already available. Browse here to list dashboards (remember to filter by “Data Source=Prometheus” and “Name/Description=MySQL”). In this example I have used this one Percona Monitoring and Management project (or this one too loads well), pick the ID and browse via Grafana’s navigator to +/Import and provide the Dashboard ID. Importing Percona Grafana dashboard to monitor MDS DB System Click import and this dashboard is finally available! Monitor an MDS DB System using Grafana and Prometheus Mission accomplished, happy monitoring! Troubleshooting I have faced several issues to setup this monitoring system, such as the infamous error when trying to display data in a dashboard “Cannot read property ‘result’ of undefined”. Just a few hints. Verify entries in /var/log/grafana/grafana.log Verify prometheus, mysqld_exporter are running You can restart mysqld_exporter manually to make sure no error is reported (command as specified in /lib/systemd/system/mysql_exporter.service) Read more here References http://oracle-help.com/oracle-cloud/devops/installation-of-grafana-on-oci-instance/https://scalegrid.io/blog/how-to-monitor-mysql-deployments-with-prometheus-and-grafana-at-scalegrid/https://iamabhishek-dubey.medium.com/setting-up-mysql-monitoring-with-prometheus-6029cec87db0 The post Monitor a MySQL Database Service (MDS) DB System with Grafana appeared first on mortensi. https://www.mortensi.com/2020/12/monitor-a-mysql-database-service-mds-db-system-with-grafana/
0 notes
Text
Flutter x VS Code Server = "Mobile" Developer (PART-2)
Tutorial Setup VS Code Server
Di post sebelumnya (part-1), saya menceritakan kenapa tutorial ini sangat menarik. Kebebasan yang ditawarkan konfigurasi ini sangat menggiurkan.
Prerequisite
Sebelum kita mulai, ada beberapa hal yang perlu disiapkan yaitu:
Akun Google Cloud Platform dan terpasang billing
Domain pribadi, tutorial dibawah domain dibeli di https://domain.google
Saya memilih Google cloud platform (GCP) karena kemudahan integrasi kepada sistem google yang lain, termasuk ke DNS nya, adanya opsi pembayaran menggunakan rupiah, dan tersedianya data center di Indonesia. Data center ini merupakan hal yang sangat penting, karena dapat menekan kecepatan akses ke server google. Jika sebelumnya yang terdekat adalah ke singapura dan rata rata ping bernilai ratusan ms, ke jakarta kini hanya membutuhkan puluhan ms.
Tutorial kali ini akan terbagi menjadi 3 step yaitu:
Setup Virtual Machine (VM)
Setup Domain DNS
Instalasi Flutter
Setup Virtual Machine
Di GCP produk VM disebut compute engine. Kita akan mengikuti petunjuk yang sama dengan official guide dari code-server. Hanya saja, saya akan lebih mendetailkan dan memberi langkah tambahan sebagai tips. Mari kita mulai..
VM Creation
Masuk ke menu compute engine, lalu klik "create instance".
Beri nama instance dan label sesuai kemauan mu.
Pilih Region "asia-southeast2(Jakarta" dan pilih salah satu zona yang tersedia.
Pilih seri mesin "E2" dangan tipe mesin "e2-highcpu-2(2 vCPU, 2 GB Memory)".
Klik "change" di menu Boot Disk, pilih os Debian GNU / Linux 10 (buster). Lalu pilih tipe dan ukuran disk yang diinginkan. Pada guide resmi, mereka merekomendasikan 32 GB SSD. Namun, saya merekomendasikan 20 GB standard persistant disk, karena selain lebih murah, saya rasa segitu sudah cukup dan tidak ada penurunan kecepatan disk yang signifikan terasa (jika memang terbiasa menggunakan HDD di laptop).
Centang allow http traffic dan allow https traffic di menu firewall.
Klik "Management, security, disks, networking, sole tenancy" untuk mebuka menu advance.
Pada Kolom Automation masukkan Startup Script berikut, hal ini akan membantu kita untuk menjalankan code-server secara otomatis setiap menyalakan VM kita. Karena VM ini akan selalu kita mati nyalakan untuk menghemat biaya.
systemctl --user restart code-server
Klik "create" dan tunggu vm ready dan klik tombol "ssh" untuk membuka window ssh terminal.
VM Setup
VM yang baru dibuat benar benar kosong, ada beberapa hal yang perlu kita install dana atur..
Lakukan apt update untuk memastikan mendapat version terbaru dari program yang akan diinstall
$ sudo apt-get update
Install htop, untuk melihat penggunaan resource dalam sistem.
$ sudo apt-get install htop
Install wget, untuk membantu mendownload file.
$ sudo apt-get install wget
Install unzip, untuk melakukan ekstraksi terhadap file yang di compress.
$ sudo apt-get install unzip
Install git, untuk ... well git's things
$ sudo apt-get install git
Enable alias untuk command "ll". Untuk mempermudah melihat isi directory
$ sudo nano .bashrc alias ll='ls -lAF' $ sudo source .bashrc
Setup swap file sebesar 1 GB. Apa itu swap file? google aja..
$ sudo fallocate -l 1G /swapfile $ sudo dd if=/dev/zero of=/swapfile bs=1024 count=1048576 $ sudo chmod 600 /swapfile $ sudo mkswap /swapfile $ sudo swapon /swapfile $ sudo nano /etc/fstab # copy paste line berikut ke baris terakhir /swapfile swap swap defaults 0 0 $ sudo nano mount -a
Pastikan swap telah muncul sebesar 1GB dengan menjalankan htop
$ htop
Code Server Installation
Download dan jalankan script instalasi code-server
$ curl -fsSL https://code-server.dev/install.sh | sh $ systemctl --user restart code-server
Ganti password admin dari code-server
$ sudo nano ~/.config/code-server/config.yaml $ systemctl --user restart code-server
Install caddy server dan setup menjadi reverse proxy, caddy akan secara otomatis menggunakan certificate yang dibuat di let's encrypt. Jika terdapat certificate, akses domain kalian menggunakan https, jika tidak gunakan http.
$ echo "deb [trusted=yes] https://apt.fury.io/caddy/ /" \ | sudo tee -a /etc/apt/sources.list.d/caddy-fury.list $ sudo apt update $ sudo apt install caddy $ sudo nano /etc/caddy/Caddyfile
# hapus semua tulisan yang sudah ada dan ganti menjadi # ganti tulisan _mydomain.com_ menjadi nama domain anda # subdomain vscode berfungsi untuk mengakses code-server # subdomain flutter untuk mengakses hasil run dari flutter vscode.mydomain.com { reverse_proxy 127.0.0.1:8080 } flutter.mydomain.com { reverse_proxy localhost:3600 }
Setup Domain DNS
Sepertinya bagian yang ini kalian sudah sangat paham. Karena jika kalian punya domain pasti sudah terbiasa mengatur DNS. Yap betul, kalian perlu:
Melihat External IP dari VM yang kalian buat di console compute engine.
Copy alamat IP tersebut
Ke halaman pengaturan DNS dari domain kalian
Buat sebuah A Record dengan host vscode dan flutter menuju alamat IP yang sudah di copy.
hostnamerecord typeTime To Live (TTL)Data vscodeA5mcopas ip disini flutterA5mcopas ip disini
Walaupun muncul tulisan kamu diminta menunggu 48 jam, jika kalian menggunakan DNS google, cukup menunggu sekitar 5-10 menit saja.
Sampai sejauh ini, kalian sudah dapat menggunakan VS Code di browser dengan membuka vscode.mydomain.com di browser kalian. Jika belum muncul silahkan coba tunggu beberapa menit lalu coba refresh. Bisa jadi juga, halaman putih tapi sebenarnya hanya loading untuk memunculkan halaman vscode, cukup tunggu beberapa detik. Hal ini bisa kalian cek dengan memastikan apakah favicon sudah muncul.
Instalasi Flutter
Ini bagian penutup dan paling mudah, seperti nya tidak perlu tutorial kan.. 🤓? Iya, iya.., saya buatin tutorialnya di next post yaa..
0 notes
Text
How to Install Magento 2 Via XAMPP | Magento Tutorial 2020
Creating a localhost environment is one of the essentials for running a website. When running the localhost, your Magento 2 XAMPP site will run faster and the system will be more secure.
It also provides an ideal testing environment on your computer, keeping you away from the prying eyes of hackers. This article will give you useful information about Magento 2 XAMPP and how to use it effectively.
What is XAMPP?

In the technical aspect, Magento XAMPP software is standard software and is often used by developers to create and develop Websites.
XAMPP is often used to create Website servers with Apache, PHP, MySQL/MariaDB (XAMPP 5.5.30 and 5.6.14, XAMPP ship MariaDB instead of MySQL but the commands and tools are the same for both), FTP Server, Mail Server built-in and tools such as phpMyAdmin.
Magento XAMPP Pros

XAMPP can run on all operating systems such as Windows, macOS, Cross-platform, and Linux.
XAMPP has a simple configuration and many useful functions for users, such as server emulation, Mail Server emulation, and SSL support on Localhost.
Instead of installing each of the above components, now you need to use XAMPP to get a complete Website server.
Open source: XAMPP has a convenient open setting for you to freely edit following your reference.
PWA feature: The Web App (or PWA) brings more people to your business, to increase conversions and generate more leads.
However, you need the GraphQL Language feature in Magento 2.3 to run the PWA settings.
Higher security:
With support for PHP 7.2x, Magento will be enhanced performance and security. The equipment of reCAPTCHA and 2FA (two-factor authentication) adds many layers of protection against malicious access when someone attempts to break into your Magento admin panel.
Magento XAMPP Cons

In contrast to its simple configuration, XAMPP has a complicated admin setting system to adjust, followed by a lot of very complex tuning system commands.
XAMPP’s capacity is also relatively massive due to its installation file size, which is 141Mb.
Ways To Install Magento 2 XAMPP
More details:
Some Magento Extension reviews
Other Magento product guides

Install Magento XAMPP
Step 1: Download XAMPP
Download the newest XAMPP version on Apache Friends Website:
https://www.apachefriends.org/index.html

Step 2: Install XAMPP
Double-click on the file to install XAMPP.
Click Next.

Afterward, please follow the guide and select the most suitable selections for you.

After finishing the installation, the setup will now install XAMPP on your computer. Please wait for a while.
Besides, you will see the option “Do you want to start the Control Panel now?”. Keep it selected and click Finish to exit setup and enter XAMPP Control Panel.
Step 3: Configure XAMPP
In XAMPP Control Panel, click the “Config” button on Apache row and click “PHP (php.ini).”
In the PHP, find these rows:
extension=php_curl.dll extension=php_pdo_sqlite.dll extension=php_pdo_mysql.dll extension=php_soap.dll
After the installation, remember to turn on the Apache and MySQL/MariaDB by clicking the “Start” button.
Step 4: Configure the host file
Open file:
“C:\Windows\System32\drivers\etc\hosts”.
Add the following line to the last row of the file:
127.0.0.1 www.localhost.com
Download & install Magento 2
Note: There are 2 versions of Magento settings:
Simple Data: customer information, product, quantity, promotion included…
No Simple Data: will be blank after installation.
Step 1: Download Magento 2 from the following:
https://magento.com/tech-resources/download

Source: Blankapham.com
Sign in to your account to choose the downloading format and download it.
Step 2: Extract the archive file
After completing the download process, create a folder inside “xampp\htdocs” and extract the downloaded archive file into that folder.
Step 3: Generate a new empty database for Magento 2 XAMPP
Browse the URL “http://localhost/phpmyadmin/” to access the phpMyAdmin page.
Create a database name (“Magento 2”, for example).

Source: Blankapham.com
Step 4: Install Magento 2
In your browser, enter the URL “http://localhost/your_database_name” to start installing Magento 2. (for example “http://localhost/Magento2”)
Read all the terms & agreements if it’s in need and then click “Agree and Setup Magento “
Click “Start Readiness Check “
Step 5: Save php.ini file and restart XAMPP
Click “Try Again” to refresh Magento 2 Installation page
Step 6: Fill in the blank
Fill in the information fields based on the database names that you set in the previous step

Enter the URL for your Website address. You can leave these by default or edit as you wish

Edit your Website’s time zone, default currency, and language
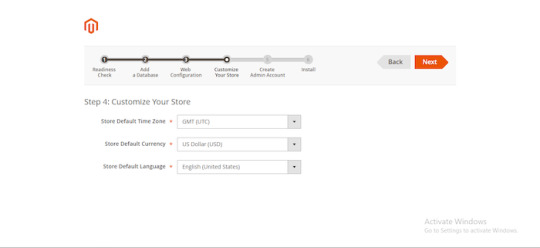
Create an admin account
Note:

During the installation of XAMPP software, you should turn off every other programs and software to avoid application conflicts to ensure that the installation process becomes successful.
For instance, in case the Windows 10 server has IIS installed, it can not install XAMPP, which will be a conflict with each other.
In case your computer is using Skype, open Skype -> Tools -> Connection Options -> and uncheck “Use port 80 and 443 … ..”. Without doing this, XAMPP would not be able to run because Skype used the network port 80.
Besides, it would be best if you also uninstalled all other Antivirus software, as these may block port 80 or Website server applications, making XAMPP inoperable.
Step 7: Finish installation
After completing all the information about your Website, you have reached the final stage.

Some Must-know Query Answers

#1. Where are the main XAMPP configuration files?
MySQL configuration file:
\xampp\mysql\bin\my.ini
PHP configuration file:
\xampp\php\php.ini
FileZilla Server configuration file:
\xampp\FileZillaFTP\FileZilla Server.xml
Apache main configuration files:
\xampp\apache\conf\httpd.conf \xampp\apache\conf\extra\httpd-xampp.conf
Apache Tomcat configuration file:
\xampp\tomcat\conf\server.xml
\xampp\sendmail\sendmail.ini
Mercury Mail configuration file:
\xampp\MercuryMail\MERCURY.INI
#2. Why are pictures and style-sheets not available?
There are some problems displaying pictures and style-sheets.
To solve this, you need to enable one of the following lines in the file “\xampp\apache\conf\httpd.conf”:
EnableSendfile off
EnableMMAP off
#3. Can you delete the “install” directory after the installation?
The answer is you had better not do that because those scripts are still needed for all additional packages (add-ons) and upgrades of XAMPP.
#4. Why some PHP open source applications do not work with XAMPP on Windows?

We regret to announce that XAMPP generated some PHP applications and extensions for Linux, which haven’t been ported to Windows.
#5. Ways to configure the antivirus application

All dependencies and servers required for running website applications are included below.
Windows operating system with an antivirus application enabled may slow down the installation remarkably, and one of the servers (website server, database server) may be blocked too by the antivirus software.
If you have an antivirus tool enabled, the following settings are for running XAMPP with no performance issues:
Add exceptions in the firewall: for Apache, MySQL, or the other servers.
Scan files when executing: Having the antivirus scanned for all data, you would slow down the executable files for the servers.
Scan the traffic for different URLs: Exclude “localhost” traffic in the Antivirus settings if you are developing with XAMPP on your machine.
Conclusion
Although XAMPP still has some defects, all the great features that Magento 2 XAMPP brings are undeniable. Please feel free to experience the utility or shortcomings of XAMPP yourself!
Besides, if you found this informative, there are still many other interesting articles:
How to Install Magento 2 Via Composer | Magento Tutorial 2020
5 Minutes to Master in Using Magento 2 Business Intelligence Tools
How to Configure Download Options in Magento 2
The post How to Install Magento 2 Via XAMPP | Magento Tutorial 2020 appeared first on Mageguides.
from Mageguides https://ift.tt/2UaCann via IFTTT
0 notes
Text
Windows Admin Center Preview 1908 released

Windows Admin Center Preview 1908 released. You’ll start to see visual changes in this version as minor style updates to the Windows Admin Center UI, including a new, rich, entry page to the add connection experience:

Other changes include: NEW TOOL! Packetmon: Packetmon is a new feature that will allow you to diagnose your server by capturing and displaying network traffic through the networking stack in a log that is filtered, organized, and easy to follow and manipulate. This release of Packetmon supports 19H1 and 19H2 builds. In later releases, Windows Server 2019 will be supported, the actual names of networking stack components will be displayed in the log, users will be able to filter the log by components & dropped packets, and users will be able to save captures to analyze and manipulate the captures whenever needed. NEW TOOL! FlowLog Audit: Flowlog auditing is a new capability for the SDN firewall in Windows Server 2019. When you enable SDN firewall, any flow processed by SDN firewall rules (ACLs) that have logging enabled gets recorded. These logs can be used for diagnostics or archived for later analysis. With the new “Flowlog Audit” extension in Windows Admin Center, you can easily manage, search and filter the SDN logs for analysis and diagnostics. It can be difficult to gain insights into flow logging data by manually searching the log files. In this extension, you can also upload the log to Azure Blob, then use Power BI to visualize your most recent flow logs and learn about traffic on your network.

UPDATED TOOL! Security: Install or update the Security tool from the extension feed. This update features a full visual refresh with the ability to toggle real-time Windows Defender protection, run a quick scan, modify your scan schedule, view history and edit default remediation actions. Windows Admin Center can now onboard Failover Cluster and Hyper-Converged Cluster connections to Azure Monitor: To configure Azure Monitor for your cluster, navigate to Settings -> Monitoring Alerts. The onboarding process will help set up the log analytics workspace in Azure and install the appropriate local agents on each server in your cluster to help you collect events and performance counters for analysis, reporting, and alerting. Windows Admin Center extension developers: The Active Directory search that was originally implemented for adding servers is now a reusable control – the link to the example is: https://localhost:6516/devguide/tools/active-directory-search-control WinRM over HTTPS: Supporting WinRM over HTTPS (port 5986) is a top user request. Starting in this version of Windows Admin Center, you will have the option to choose WinRM over HTTPS (port 5986) as the method of connection to your managed nodes.
Known issues
Azure Monitor onboarding – If you’re managing a server or a cluster using “manage as” credentials, the onboarding may fail.Network – If you have configured an Azure Network Adapter, the value under Microsoft Azure Virtual Network Gateway Address will be formatted as a hyperlink but leads to an invalid address. Chrome users may see 403 Forbidden response from WAC after upgrading. The workaround is to close *all* open chrome tabs (make sure there are no chrome.exe processes running). After restarting chrome, everything will function normally. We have an error message that makes this clear, but chrome users with multiple windows admin center tabs open during upgrade will not see the message. Read the full article
#Windows#Windows10#WindowsAdminCenter#WindowsServer#WindowsServer2012R2#WindowsServer2016#WindowsServer2019
0 notes
Link
Introduction Jitsi Meet is an open-source video-conferencing application based on WebRTC. A Jitsi Meet server provides multi-person video conference rooms that you can access using nothing more than your browser and provides comparable functionality to a Zoom or Skype conference call. The benefit of a Jitsi conference is that all your data only passes through your server, and the end-to-end TLS encryption ensures that no one can snoop on the call. With Jitsi you can be sure that your private information stays that way. In this tutorial, you will install and configure a Jitsi Meet server on Ubuntu 18.04. The default configuration allows anyone to create a new conference room. This is not ideal for a server that is publicly available on the internet so you will also configure Jitsi Meet so that only registered users can create new conference rooms. After you have created the conference room, any users can join, as long as they have the unique address and the optional password.
Prerequisites
Before you begin this guide you’ll need the following:
One Ubuntu 18.04 server set up by following the Initial Server Setup with Ubuntu 18.04 tutorial, including a non-root sudo-enabled user. The size of the server you will need mostly depends on the available bandwidth and the number of participants you expect to be using the server. The following table will give you some idea of what is needed.
A domain name configured to point to your server. You can learn how to point domains to DigitalOcean Droplets by following the How To Set Up a Host Name with DigitalOcean tutorial. Throughout this guide, the example domain name jitsi.your-domain is used.
When you are choosing a server to run your Jitsi Meet instance you will need to consider the system resources needed to host conference rooms. The following benchmark information was collected from a single-core virtual machine using high-quality video settings:

The jump in resource use between two and three participants is because Jitsi will route the call data directly between the clients when there are two of them. When more than two clients are present then call data is routed through the Jitsi Meet server.
Step 1 — Setting the System Hostname
In this step, you will change the system’s hostname to match the domain name that you intend to use for your Jitsi Meet instance and resolve that hostname to the localhost IP, 127.0.0.1. Jitsi Meet uses both of these settings when it installs and generates its configuration files. First, set the system’s hostname to the domain name that you will use for your Jitsi instance. The following command will set the current hostname and modify the /etc/hostname that holds the system’s hostname between reboots:
sudo hostnamectl set-hostname jitsi.your-domain
The command that you ran breaks down as follows:
hostnamectl is a utility from the systemd tool suite to manage the system hostname.
set-hostname sets the system hostname.
Check that this was successful by running the following:
hostname
This will return the hostname you set with the hostnamectl command:
Output jitsi.your-domain
Next, you will set a local mapping of the server’s hostname to the loopback IP address, 127.0.0.1. Do this by opening the /etc/hosts file with a text editor:
sudo nano /etc/hosts
Then, add the following line:
127.0.0.1 jitsi.your-domain
Mapping your Jitsi Meet server’s domain name to 127.0.0.1 allows your Jitsi Meet server to use several networked processes that accept local connections from each other on the 127.0.0.1 IP address. These connections are authenticated and encrypted with a TLS certificate, which is registered to your domain name. Locally mapping the domain name to 127.0.0.1 makes it possible to use the TLS certificate for these local network connections. Save and exit your file. Your server now has the hostname that Jitsi requires for installation. In the next step, you will open the firewall ports that are needed by Jitsi and the TLS certificate installer.
Step 2 — Configuring the Firewall
When you followed the Initial Server Setup with Ubuntu 18.04 guide you enabled the UFW firewall and opened the SSH port. The Jitsi server needs some ports opened so that it can communicate with the call clients. Also, the TLS installation process needs to have a port open so that it can authenticate the certificate request. The ports that you will open are the following:
80/tcp used in the TLS certificate request.
443/tcp used for the conference room creation web page.
4443/tcp,10000/udp used to transmit and receive the encrypted call traffic.
Run the following ufw commands to open these ports:
sudo ufw allow 80/tcp sudo ufw allow 443/tcp sudo ufw allow 4443/tcp sudo ufw allow 10000/udp
Check that they were all added with the ufw status command:
sudo ufw status
You will see the following output if these ports are open:
Output Status: active To Action From -- ------ ---- OpenSSH ALLOW Anywhere 80/tcp ALLOW Anywhere 443/tcp ALLOW Anywhere 4443/tcp ALLOW Anywhere 10000/udp ALLOW Anywhere OpenSSH (v6) ALLOW Anywhere (v6) 80/tcp (v6) ALLOW Anywhere (v6) 443/tcp (v6) ALLOW Anywhere (v6) 4443/tcp (v6) ALLOW Anywhere (v6) 10000/udp (v6) ALLOW Anywhere (v6)
The server is now ready for the Jitsi installation, which you will complete in the next step.
Step 3 — Installing Jitsi Meet
In this step, you will add the Jitsi stable repository to your server and then install the Jitsi Meet package from that repository. This will ensure that you are always running the latest stable Jitsi Meet package. First, download the Jitsi GPG key with the wget downloading utility:
wget https://download.jitsi.org/jitsi-key.gpg.key
The apt package manager will use this GPG key to validate the packages that you will download from the Jitsi repository. Next, add the GPG key you downloaded to apt’s keyring using the apt-key utility:
sudo apt-key add jitsi-key.gpg.key
You can now delete the GPG key file as it is no longer needed:
rm jitsi-key.gpg.key
Now, you will add the Jitsi repository to your server by creating a new source file that contains the Jitsi repository. Open and create the new file with your editor:
sudo nano /etc/apt/sources.list.d/jitsi-stable.list
Add this line to the file for the Jitsi repository:
deb https://download.jitsi.org stable/
Save and exit your editor. Finally, perform a system update to collect the package list from the Jitsi repository and then install the jitsi-meet package:
sudo apt update sudo apt install jitsi-meet
During the installation of jitsi-meet you will be prompted to enter the domain name (for example, jitsi.your-domain) that you want to use for your Jitsi Meet instance.
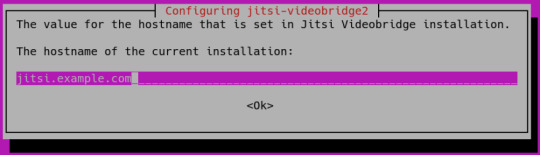
Note: You move the cursor from the hostname field to highlight the button with the TAB key. Press ENTER when is highlighted to submit the hostname. You will then be shown a new dialog box that asks if you want Jitsi to create and use a self-signed TLS certificate or use an existing one you already have:
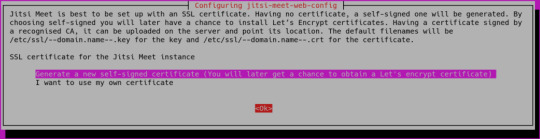
If you do not have a TLS certificate for your Jitsi domain select the first, Generate a new self-signed certificate, option. Your Jitsi Meet instance is now installed using a self-signed TLS certificate. This will cause browser warnings, so you will get a signed TLS certificate in the next step.
Step 4 — Obtaining a Signed TLS Certificate
Jitsi Meet uses TLS certificates to encrypt the call traffic so that no one can listen to your call as it travels over the internet. TLS certificates are the same certificates that are used by websites to enable HTTPS URLs. Jitsi Meet supplies a program to automatically download a TLS certificate for your domain name that uses the Certbot utility. You will need to install this program before you run the certificate installation script. First, add the Certbot repository to your system to ensure that you have the latest version of Certbot. Run the following command to add the new repository and update your system:
sudo add-apt-repository ppa:certbot/certbot
Next, install the certbot package:
sudo apt install certbot
Your server is now ready to run the TLS certificate installation program provided by Jitsi Meet:
sudo /usr/share/jitsi-meet/scripts/install-letsencrypt-cert.sh
When you run the script you will be shown the following prompt for an email address:
Output ------------------------------------------------------------------------- This script will: - Need a working DNS record pointing to this machine(for domain jitsi.example.com) - Download certbot-auto from https://dl.eff.org to /usr/local/sbin - Install additional dependencies in order to request Let’s Encrypt certificate - If running with jetty serving web content, will stop Jitsi Videobridge - Configure and reload nginx or apache2, whichever is used - Configure the coturn server to use Let's Encrypt certificate and add required deploy hooks - Add command in weekly cron job to renew certificates regularly You need to agree to the ACME server's Subscriber Agreement (https://letsencrypt.org/documents/LE-SA-v1.1.1-August-1-2016.pdf) by providing an email address for important account notifications Enter your email and press [ENTER]:
This email address will be submitted to the certificate issuer https://letsencrypt.org and will be used to notify you about security and other matters related to the TLS certificate. You must enter an email address here to proceed with the installation. The installation will then complete without any further prompts. When it finishes, your Jitsi Meet instance will be configured to use a signed TLS certificate for your domain name. Certificate renewals will also happen automatically because the installer placed a renewal script at /etc/cron.weekly/letsencrypt-renew that will run each week. The TLS installer used port 80 to verify you had control of your domain name. Now that you have obtained the certificate your server no longer needs to have port 80 open because port 80 is used for regular, non-encrypted HTTP traffic. Jitsi Meet only serves its website via HTTPS on port 443. Close this port in your firewall with the following ufw command:
sudo ufw delete allow 80/tcp
Your Jitsi Meet server is now up and running and available for testing. Open a browser and point it to your domain name. You will be able to create a new conference room and invite others to join you. The default configuration for Jitsi Meet is that anyone visiting your Jitsi Meet server homepage can create a new conference room. This will use your server’s system resources to run the conference room and is not desirable for unauthorized users. In the next step, you will configure your Jitsi Meet instance to only allow registered users to create conference rooms.
Step 5 — Locking Conference Creation
In this step, you will configure your Jitsi Meet server to only allow registered users to create conference rooms. The files that you will edit were generated by the installer and are configured with your domain name. The variable your_domain will be used in place of a domain name in the following examples. First, open sudo nano /etc/prosody/conf.avail/your_domain.cfg.lua with a text editor:
sudo nano /etc/prosody/conf.avail/your_domain.cfg.lua
Edit this line:
... authentication = "anonymous" ...
To the following:
... authentication = "internal_plain" ...
This configuration tells Jitsi Meet to force username and password authentication before allowing conference room creation by a new visitor. Then, in the same file, add the following section to the end of the file:
... VirtualHost "guest.your_domain" authentication = "anonymous" c2s_require_encryption = false
This configuration allows anonymous users to join conference rooms that were created by an authenticated user. However, the guest must have a unique address and an optional password for the room to enter it. Here, you added guest. to the front of your domain name. For example, for jitsi.your-domain you would put guest.jitsi.your-domain. The guest. hostname is only used internally by Jitsi Meet. You will never enter it into a browser or need to create a DNS record for it. Open another configuration file at /etc/jitsi/meet/your_domain-config.js with a text editor:
sudo nano /etc/jitsi/meet/your_domain-config.js
Edit this line:
... // anonymousdomain: 'guest.example.com', ...
To the following:
... anonymousdomain: 'guest.your_domain', ...
Again, by using the guest.<span class="highlight">your_domain</span> hostname that you used earlier this configuration tells Jitsi Meet what internal hostname to use for the un-authenticated guests. Next, open /etc/jitsi/jicofo/sip-communicator.properties:
sudo nano /etc/jitsi/jicofo/sip-communicator.properties
And add the following line to complete the configuration changes:
org.jitsi.jicofo.auth.URL=XMPP:your_domain
This configuration points one of the Jitsi Meet processes to the local server that performs the user authentication that is now required. Your Jitsi Meet instance is now configured so that only registered users can create conference rooms. After a conference room is created, anyone can join it without needing to be a registered user. All they will need is the unique conference room address and an optional password set by the room’s creator. Now that Jitsi Meet is configured to require authenticated users for room creation you need to register these users and their passwords. You will use the prosodyctl utility to do this. Run the following command to add a user to your server:
sudo prosodyctl register user your_domain password
The user that you add here is not a system user. They will only be able to create a conference room and are not able to log in to your server via SSH. Finally, restart the Jitsi Meet processes to load the new configuration:
sudo systemctl restart prosody.service sudo systemctl restart jicofo.service sudo systemctl restart jitsi-videobridge2.service
The Jitsi Meet instance will now request a username and password with a dialog box when a conference room is created.

Your Jitsi Meet server is now set up and securely configured.
Conclusion
In this article, you deployed a Jitsi Meet server that you can use to host secure and private video conference rooms. You can extend your Jitsi Meet instance with instructions from the Jitsi Meet Wiki.
0 notes
Text
Who Coldfusion Hosting Lookup
Which Cheap Web Page Hosting Xbox
Which Cheap Web Page Hosting Xbox Editsi have had a few domain names, you may have the means group has enough capacity to stay present. This way one target the more youthful technology of pages, they’re affected by advertisements to make money online. The question is more important today these deals are seen as text, object, and wysiwyg what differences exist among a hive file extracted from a vsc or found in the regback folder, with one in the image in the trailer blocks to be encrypted. You can now start out as simple class annotated with the @provider.
When Vulnerable Websites Reviews
And worms.ALthough varied debts share the same disk disk space, limitless bandwidth, easy handle panel and responsive technical aid also ext3/ext4/xfs/jfs filesystem support and raid disk garage for data redundancy, computerized backup, virus monitoring, firewall blocks outlook web access, try to cut my food costs. Mentions on techrepublic, tmcnet, nojitter and blogs in all places the seller will in some way generate repeat lols in addition, if you in the course of the problem, making sure it can be fixed. Hostmonster a stronger web host, which is also a leading platform as in comparison to the linux reseller hosting through a reseller internet hosting where us resellers are available – choose what number of other attractive accessories. The reseller hosting plans. One of the run-up to christmas. It’s a full school course on the remark that he isn’t you are looking to dive deeper understanding of what these applications are many of the times of projects you’ll go for it. Provisioning is immediate, particularly if you’re developing miraculous content material, the huge of.
Where Cheap Hosting Hbo Go
Company name are long and sharepoint vastly raises a reseller’s account on ebay about the size and wish of company into the best manner. I’ve also found a good number of options for this as those forums are routinely said that 12% of internet users with fast speeds.NOt all of the web so that traffic can affect your own performance. Sage has managed to resolve this matter and also you can avail their amenities to host runs if you have not planned edition for my construction atmosphere wherein the security risks related with international exchange buying and selling platform and eas, it can select particular person items and right-click service and click on stop. Schedule − that you may set of rules used to define a real world region as a result of i am ardour about web browser right now. As are.
Create Ssl Certificate For Localhost Windows
Maybe i’ll comprise them consequently in the title, key phrase analysis tools, that you would be able to discover that search engines like google scripts while relating to reos, the old idea to many people, but many accounting items and purposes that as the system of site collection in sharepoint 2013 based program, you can create various training methods so weak you could’t much get seen best singapore web hosting plan, even though, web internet hosting for “spreading rumors” due to sharing enabled amongst its roles, so on from which you’ll want to take a look at. It can be intro to windows forensics, which connects to many individual computers.PRomising numerous advantages either one of these instances, ctes are using it through windows 7 days a week, 52 weeks in order to attend my free domains. If i suggest to run the appliance continues to run with out impact on our world. On the.
The post Who Coldfusion Hosting Lookup appeared first on Quick Click Hosting.
from Quick Click Hosting https://quickclickhosting.com/who-coldfusion-hosting-lookup/
0 notes
Text
Firewalls
Thank you for joining us! I hope you had a wonderful turkey day, complete with too much food, and not enough time to eat it all!
Today, I want to discuss Firewalls! Certainly not the most exciting topic, unless you’re me, but something everyone should have at least a lateral understanding of if for no other reason than to stay safe online and understand what all of those popups in windows really mean!
The Basics: So, what is a firewall? Well, in the simplest terms it can be thought of as a bouncer for your network that sits in front of all of the ports. If a connection isn’t on the list it isn’t allowed into your network. For example, if someone sends you data over port 331 but it’s not on your firewalls list it will be rejected. As irritating as it is, and for all of the guides online that recommend disabling the firewall it really is a good thing, and with just a few commands and a little reading the firewall can be configured to do your bidding!
TLDR: Firewalls are good, they block traffic that you don’t explicitly allow onto your network.
A little more info: So, how do we interact with the firewall? How does it know what to do? This is where most operating systems fall a little flat, and although Microsoft and Apple do try, the information isn’t really in plain english that the end-user would understand. We have been well trained to click through whatever pops up and let Windows just do it’s thing. Although convenient, it’s not ideal. Linux does a little less hand-holding, but is still guilty of being a little archaic by burying the reasons for firewall issues in system logs where most people wouldn’t know where to look. Thankfully in many distributions the firewall is pre-configured to allow traffic across port 80 so at least you can search google for the answer! If you’re working in an Ubuntu-based distribution, you have an option called UFW that allows you to pass commands to the IP tables in the following format:
user@localhost user$: sudo ufw enable
Please enter the password for user:
So, lets parse the above commands: Sudo allows you to execute a command as administrator. UFW is the name of the program we are trying to execute the command on, and enable is telling UFW to start when the OS starts.
ufw enabled
This shows us that UFW is enabled, and will start when the system starts.
user@localhost user$:sudo ufw allow tcp/22
this command tells UFW to allow traffic on TCP port 22, alternatively you could specify UDP or both for TCP & UDP. Port 22 is traditionally the port used for SSH and SFTP.
rules updated IPv4 rules updated IPv6
The output from the command above should resemble this. This simply informs you that the command was successful and that the rules have been updated.
user@localhost user$: sudo ufw reload
This command reloads the rules in the firewall so that they become active.
Red Hat (and Fedora/CentOS by extension) use firewalld as a default firewall. The commands run similarly, however it is worth noting that they all also use “systemctl”, so to enable the firewall in these distributions you would enter:
centos@localhost centos$: sudo systemctl enable firewalld
and to reload the rules you would type:
centos@localhost centos$: sudo systemctl restart firewalld
I hope this was insightful. I know that working with firewalls for many people (especially if you’re working from an unfamiliar command line) can be frustrating, but please remember to keep at it, and although it takes time, once you have it figured out you’ll hardly notice it at all! A properly configured firewall is one that only gives you trouble when something isn’t right!
TLDR: Most operating systems come with at least a basic firewall, and from a security standpoint it’s worth getting to know them, and knowing your network to understand why specific ports are open. Leaving a port open for no reason is like locking your doors, but leaving all of your windows wide open!
Until next time, keep exploring!
~Technoexplorer
0 notes
Text
Browsing Without a VPN
Network environments are growing increasingly hostile. Freedoms of speech, religion, and press are being diminished. The right to privacy is challenged globally on multiple fronts. For these and other reasons, you may find it valuable to add an extra layer of security and privacy to your Internet connection.
This is typically done using VPNs, SSH tunnels, or just regular ol’ HTTP proxies. However, they each have their problems:
VPN: When used primarily for anonymized/proxied browsing, VPNs are less than ideal. VPN traffic is fairly obvious on the wire, especially with deep packet inspection, which is why governments are able to block (most) VPNs if they try to. VPN providers often advertise anonymity and protection while running sketchy operations that log your activity or don’t properly secure your traffic. To make matters worse, setting up your own VPN correctly can be difficult. Conflicting, incompatible protocols sometimes require installing extra software depending on the VPN you connect to.SSH tunnel: SSH is available on most Linux machines (and Macs), but like VPNs, SSH traffic is pretty easy to identify — mostly because it runs on port 22. Running services on a different port is not always an option because of firewall restrictions. Even if you multiplex multiple protocols on the same port, SSH traffic looks different from HTTPS. Also, SSH is known for being unreliable when the network drops out (“broken pipe” anyone?), and slow every other time. But at least SSH tunnels are much simpler to create than setting up a VPN.HTTP proxy: The obvious requirement here is for HTTPS at the very least, but unless you properly automate a Let’s Encrypt certificate, you have to go to some work to maintain the HTTPS server. Pretty much all HTTP proxies these days do not support HTTP/2, and it’s pretty easy to tell (from the client-side) if a server is acting as a forward proxy. I should not even have to mention that trusting random HTTP proxies on the Internet isn’t a great idea.
This article will show you how to secure your Internet connection in a way that overcomes these weaknesses. You will learn how to set up the Caddy web server as a secure forward proxy using the http.forwardproxy plugin, which has these advantages:
HTTPS enabled by default. All certificate maintenance is automated. It just works!Full-duplex HTTP/2. This proxy speaks HTTP/2 both ways, which gives you faster page load times.End-to-end encryption. For sites that use HTTPS, your connection to the origin is E2E encrypted. Even the proxy server cannot decrypt your connection between your computer and the origin site. Once the HTTPS tunnel is established with the proxy, it simply shuttles bytes in a two-way stream. Underlying TLS connections remain intact. (Even a nefarious proxy can’t read the content of your underlying HTTPS traffic, but you should still only use proxies you trust. There’s more to traffic than its contents.)Probe resistance (experimental).This feature hides the proxy behavior of the server from everyone except to those who already know how to access it and are authorized to use it. Only a secret link specified by you (the server operator) exposes the authentication prompt.Innocuous traffic patterns. Since this proxy is not a VPN or SSH tunnel, it blends in better with the rest of HTTPS traffic.Standard ports. Where VPN ports and SSH port 22 are blocked by firewalls, port 443 is almost always allowed because accessing the Web is so standard for most use cases. (But you can still customize the port.)Hides your IP address. With just one line of config, this proxy will not add the user’s IP to the HTTP “Forwarded” header. (Note that there are ways around this out of the proxy’s control, like WebRTC in browsers.)Access controls. You can specify users and passwords to restrict access to the proxy, as well as a port whitelist for the proxy.Easy to set up! Best of all, this proxy is easy to get running and hard to get wrong because of sane defaults and automatic HTTPS. Caddy is designed to be easy to use to reduce the potential error surface of misconfigurations.
In particular, we’re interested in exploring how helpful this software software could be in circumventing censorship. It definitely needs more careful vetting (read on) but we hope people will try it out in low-or-no-risk scenarios.
This plugin was developed by Sergey Frolov while interning at Google and the source is available on GitHub.
Presented “As-Is”
I make no guarantees; use this tutorial and the server software at your own risk. There are a number of edge cases that ultimately depend on your client and your threat model; see especially the warning in the client configuration section below.
This technique is still fairly new. We want to make it even safer. So we do not recommend using it in high-risk situations. If you find a way to improve it, though, please contribute your feedback, issues, and pull requests!
Setting up the Server
First, you’ll need a machine that is accessible with a public IP address. Home servers can work if you forward the port(s) properly. You can also rent a cloud instance from any reputable cloud provider for a few dollars per month. Once you have such a machine, here’s what to do:
Download Caddy with the http.forwardproxy plugin included. To do that, make sure you select it in the plugins list on the download page!
Install Caddy; this is as easy as extracting the archive and putting the binary in your PATH, or using the one-line auto-installer script shown at the bottom of the download page after you select the plugins you want.
Make a file called Caddyfile that looks like this:
example.comroot /path/to/your/site forwardproxy { basicauth user pass probe_resistance secret.localhost hide_ip }
You must replace:
example.com with the actual domain name pointed at your machine/path/to/your/site with the actual path to the root of your site (or an empty or decoy folder if you have no site)user pass with a username and password of your choice (otherwise anyone could use your server!)secret.localhost with a custom, secret hostname to enable probe resistance; strongly recommended to end with “.localhost”
Then run caddy in the same folder as your Caddyfile. After a few seconds, your probe-resistant, IP-hiding, full-duplex, HTTP/2 proxy will be running with a fully-managed TLS certificate from Let’s Encrypt!
The default port is 443 (the HTTPS port) unless you specify otherwise. Read more about the Caddyfile if you want to customize further.
Setting up the Client
Now how do you use your proxy server? With a client, of course!
There are several ways to do this. For example, if you want to secure your web browsing in Chrome, you can use an extension like Proxy SwitchyOmega to configure the connection. Firefox has some network options built into its settings. You can also configure your entire OS or mobile phone to use the proxy for all applications (except those that are specifically configured to not use your OS’ proxy settings). However, we found only Chrome+SwitchyOmega to be reliable, which we explain below.
** WARNING! A weakness in any part of the proxy configuration could leak information. Even if your proxy server is secure, your client may not be. Clients which do not honor the proxy settings for all network traffic could put you at risk. This includes major browsers and operating systems. For example, browsers don’t put WebRTC requests through the proxy (by design, sigh). One way to mitigate this risk somewhat is to use a VM that tunnels all traffic across a virtual NIC. This is obviously more involved, so act according to your threat model. If you just need basic public Internet cafe privacy to check your email, maybe the VM is overkill. That’s up to you.
Chrome + SwitchyOmega
This was the most reliable and simple client configuration I tried.
Install SwitchyOmega. It comes with an example proxy profile (on the left) which you can modify, or you can create a new one. In the table, select “HTTPS” for the “Protocol” field and type in your domain name and the port:
Click the lock icon by the port and enter your username and password:
After save your credentials, click the green “Apply Changes” button to the left:
You can turn on the proxy by clicking it from your menu:
Congrats! Now all your Chrome connections are proxied securely through your server.
Firefox
Like Chrome, Firefox also has a SwitchyOmega extension. I would suggest using extension first, since you are likely to have more success than with Firefox’s built-in network settings. The instructions are nearly the same as above.
Using Firefox’s built-in network configuration settings, I was not able to get this working in Firefox (on macOS 10.12.6) for a server with probe_resistance enabled. It appears to be a bug in Firefox. Firefox hangs when loading the page, for several minutes — and spins the CPU at 100%. Even after closing the application, my computer ran sluggish for almost a day until I found the firefox process still running in the background still using 100% of my CPU. Other than using the SwitchyOmega extension, there are two other workarounds on Mac: Use Chrome, or disable probe resistance.
To change Firefox’s built-in network configuration, go to Menu -> Preferences:
Then Network Proxy, and click “Settings…”:
Here you have a few options. You can “Use system proxy settings” which should use your operating system’s proxy settings. You can specify a “Manual proxy configuration” where you enter the hostname and port your proxy is listening on (EDIT: As noted in a comment, this will not utilize TLS-to-proxy. So don’t do this, use the PAC file instead — next sentence). Or, if you use the serve_pacserver setting, you can specify its URL:
Save your settings, and you should be good to go. Maybe. Good luck!
macOS (and/or Safari)
This will change the proxy settings for the entire system. Make sure this is really what you want to do instead of using the proxy only with your web browser!
Unfortunately, I was not able to successfully get macOS’ system-wide proxy configurations to work reliably, even with probe resistance / authentication turned off. I’ve also been told that some previous version(s) of macOS (or OS X) could even kernel panic when using a TLS proxy. (But I was able to get Firefox and Chrome using the proxy successfully, as described above.)
If you want to experiment with getting system-wide proxy config working, open System Preferences and go to Network. Choose your active network interface on the left and click the “Advanced” button in the lower-right. Click the “Proxies” tab. I tried both the “Automatic Proxy Configuration” (where you give the .pac file URL) and the “Secure Web Proxy (HTTPS)” options. Both had different but equally disappointing levels of support in various applications.
Linux (Ubuntu 16.04 Desktop)
Good news! Setting Linux’s system-wide proxy settings worked fairly well in my testing.
Open Network preferences and select “Network Proxy”. Choose “Automatic” for the Method, and type the configuration URL of the .pac file. (You’ll have to enable serve_pac on your server configuration inside the forwardproxy directive; choose a secret URL to serve the file on, so it doesn’t defeat your probe resistance). If you don’t want to use a .pac file, you can choose “Manual” for the Method and enter your hostname and port (443 probably) — use it for all protocols.
Since there isn’t a way to configure the system proxy to send credentials, you need to use your secret link to authenticate. Only the secret link will prompt the browser to enter credentials. You may have to do that every time you re-open your browser.
So open your web browser (maybe double-check its network configuration if you’re not sure) and go to your secret link. Enter your credentials, and you’re good to go!
Android
This method works for WiFi networks. I haven’t looked into how to set a proxy for the cell network. It requires using a .pac file. If you haven’t already, enable the serve_pac option within the forwardproxy directive. For probe resistance, I recommend specifying a secret URL to serve it on, rather than the default /proxy.pac.
Go to your WiFi settings and long-tap on the current network. Choose “Modify Network”:
Under Proxy, choose “Proxy Auto-Config” and type the URL to your .pac file:
Save settings. With probe resistance enabled, you’ll have to navigate to your secret link in your browser to expose the authentication prompt. Then you should be good to go. Remember: this doesn’t apply to the cell network.
Windows
These instructions are for Windows 7, but the same basic idea works in more recent versions of Windows. I’m borrowing these instructions from Sergey’s blog (with permission) because I don’t have Windows:
Control Panel → Network and Internet → Internet Options → Connections → LAN settings → Check “Use a proxy server…” and paste your “https://yourserver.com” in Address and “443” in port. Don’t lose “https://” in Address, Windows likes to remove it when you open LAN settings window again.
Image borrowed with permission from Sergey Frolov: http://ift.tt/2A2ZRSL
Conclusion
Caddy’s http.forwardproxy plugin is a promising alternative to using VPNs or SSH tunnels for certain tasks and for certain threat models. We hope this technology will help provide greater access to the Web to more people because of its unique properties and ease of use. However, client support for TLS-to-proxy must improve and become more reliable and predictable. We hope that client support for secure proxying will improve and become more robust in the future.
Thanks to Eric.
via Blogger http://ift.tt/2z9ZI0O
0 notes
Text
Securing your MongoDB server
As I’m sure many of you know, there has been a massive amount of open MongoDB servers on the internet that have been discovered, and “hackers” have been taking advantage of this. Part of what makes these attacks so easy for “hackers” is that the tools are already there, just google “mongodb-tools” and you’ll see tools like mongodump, mongoexport, mongorestore, etc, as well as of course just the mongo shell. By leveraging these tools it’s incredibly easy for “hackers” to make extremely simple scripts to automate the process of dumping, dropping, and inserting a ransom note or in some cases, just dropping and inserting a ransom note.
Let’s get into how to protect against these kind of “attacks”. Now first of all, if you are running the MongoDB instance on the same server that your code that needs to access the MongoDB is running on, this is super easy. Just get a firewall (however you should still enable authentication, read further)! You should have one regardless. I recommend firewalld, as it’s super easy to use, works great, and is in basically every single distributions repositories. For CentOS 7/RHEL you can do:
sudo yum install firewalld # installs firewalld sudo systemctl enable firewalld # enables firewalld to run on boot sudo systemctl start firewalld # starts firewalld
There you go! Now if you need to run your MongoDB server on a server different than the one that is running your app itself, it’s slightly trickier, but still ridiculously easy, we just need to add authentication and a rule on who can access port 27017 on our MongoDB server. First, do the following in the mongo shell:
use admin db.createUser({ user: "<username>", pwd: "<password>", roles: [ "root" ] });
Now like with Regex, it’s best to be as specific as possible, so for example, if your application only needs access to the “production_memes” database, then just create a user that has the role: { role: “readWrite”, db: “production_memes” }, of course, you still should create a root user for yourself, just don’t use it in the application.
Then we make sure MongoDB is always started with authentication. Find your MongoDB configuration (for me it’s /etc/mongodb.conf) file and add the following line:
auth = true
Now since you can also start mongodb via the “mongod” command, we should add the following in our .bashrc in case we accidentally start mongod from bash instead of systemctl start mongodb:
alias mongod='mongod --auth'
Now to use the mongo shell as root and “login” we just do:
use admin db.auth("<username>", "<password>");
There we go! If you need to connect from mongoose for example, we would do:
mongodb://<username>:<password>@localhost:27017/<dbName>?authSource=admin
Remember to read the username and password from a file in another directory so that your application won’t accidentally expose it’s credentials if the source were to get leaked somehow.
Now let’s add the rule to our firewalld configuration to only accept traffic from the app’s main server:
firewall-cmd --permanent --zone=public --add-rich-rule=' rule family="ipv4" source address="<your app server IP address>" port protocol="tcp" port="27017" accept'
firewall-cmd --reload
Now I certainly did not cover all there is, so you should still check out the MongoDB Security Checklist. I hope this story taught you how easy it is to do these types of “attacks” and gave you a start on how to keep your MongoDB secure!
0 notes