#GIS-Data-Analysis
Explore tagged Tumblr posts
Visit Tumblr Blog
Explore Tumblr blogs with no restrictions, modern design and the best experience.
Last Seen Tumblr Blogs


Fun Fact
12.7% of mobile users access Tumblr.
Text
Harnessing the Power of GIS Data for SEO: Transforming Digital Marketing Strategy
Harnessing the Power of GIS Data for SEO: Transforming Digital Marketing Strategy
Having recently completed comprehensive training in Geospatial Data Collection, Analysis & Interpretation using GIS Technology, I’ve discovered fascinating intersections between my established background in SEO and digital marketing and the powerful capabilities of geospatial analysis. This educational journey, covering everything from fundamental GIS concepts to advanced geospatial analysis and…
#AI-Geospatial#Business-Intelligence#Digital-Marketing-Strategy#Geospatial-Analytics#GIS-Data-Analysis#GIS-Marketing#Local-SEO-Optimization#Location-Intelligence#Marketing-Technology#Spatial-SEO
0 notes
Text
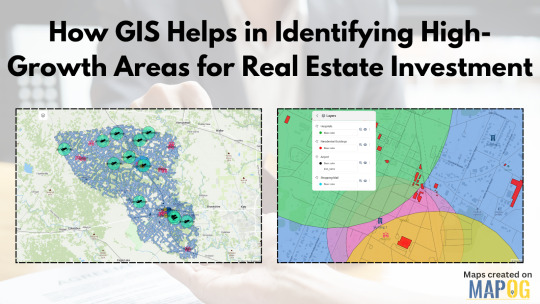
How GIS Helps in Identifying High-Growth Areas for Real Estate Investment
In an ever-changing real estate landscape, identifying areas poised for rapid development isn't just a competitive advantage—it's a necessity. Traditional methods of forecasting growth often fall short in addressing the complex interplays of infrastructure, demographics, and access to essential amenities. That's where Geographic Information Systems (GIS) step in as a transformative force.
GIS as the Eye Behind Data-Driven Real Estate
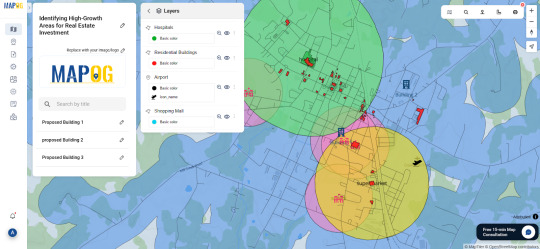
GIS technology allows users to visualize and analyze layers of geographic and statistical data all in one view. From traffic congestion and transportation routes to proximity to hospitals, schools, malls, and airports—all of this can be layered spatially to make more informed investment decisions. For real estate developers, this is more than just data; it's a dynamic decision-making tool.
By using GIS, stakeholders can map out locations with strategic access to critical infrastructure. Suppose you're analyzing a city for future residential projects. You could create buffers around public transit lines, shopping centers, and educational institutions to isolate high-potential zones. These buffers offer clarity where raw data often fails to paint the full picture.
Solving the Real Estate Guesswork
One of the biggest pain points in real estate is uncertainty: will a particular neighborhood rise in value? Will upcoming infrastructure really influence demand? GIS helps answer those questions by showing not just what exists, but how it interacts across space and time. For instance, you could track development permits over time or visualize environmental constraints like flood zones or green cover. These insights are crucial for mitigating risk and spotting overlooked opportunities.
Industries like urban planning, government housing departments, logistics, and commercial development firms increasingly rely on GIS to plan smarter. Even small-scale investors are catching on, thanks to platforms that simplify GIS applications into more user-friendly formats.
One Platform, Many Possibilities
Some mapping tools now let you not only import transportation and amenities data but also define your area of interest, set proximity buffers, and drop pins for future projects. You can even share interactive maps with teams or stakeholders. One such example is a GIS platform like MAPOG, which simplifies the entire GIS workflow from analysis to visualization without needing deep technical skills.
Whether you're evaluating urban corridors for commercial hubs or scoping out suburban areas for housing, GIS offers the clarity you need. Try exploring platforms like MAPOG if you're looking for a seamless way to start.
#realestateinvestment#gis#mapog#gismapping#smartcities#urban planning#urban growth#mapping#data visualization#spatial analysis#propertydevelopment
0 notes
Text

Advance your career with IGMPI’s industry-oriented PG Diploma in Geoinformatics. Learn GIS, remote sensing, spatial data analysis & more. Enroll online today!
Enroll in the Post Graduate Diploma in Geoinformatics offered by IGMPI – a government-recognized institute. This distance learning course provides in-depth knowledge of GIS, remote sensing, spatial data analysis, and practical tools used in geosciences and urban planning. Ideal for professionals in geography, environmental science, agriculture, and infrastructure sectors.
#Geoinformatics course India#PG Diploma in Geoinformatics#GIS course online#IGMPI Geoinformatics program#remote sensing training#spatial data analysis course#GIS distance learning#Geoinformatics certification India#GIS and mapping course#online Geoinformatics diploma
0 notes
Text
GIS improves warehouse location selection for supply optimization.
GStudying logistics and supply chain optimization
Supply chains and logistics are improved by GIS through precise demand forecasting, fleet tracking, and route creation. It enhances inventory management, lowers transportation expenses, and boosts delivery effectiveness, all of which lead to more effective operations, better use of resources, and satisfied customers.
Why use a GIS to find a location?
By evaluating the environment, accessibility, and demography, GIS optimizes site selection and gives firms information for environmental planning and infrastructure initiatives.
It helps to minimize risks, ensure sustainability, and optimize cost and efficiency.
Urban and regional planning, retail growth, renewable energy, and logistics and transportation planning are just a few of the uses for GIS.
It assists in determining appropriate sites for industrial, commercial, and residential growth while lowering environmental hazards.
What precisely is an isochrone tool?
The GIS's Isochrone tool helps with route planning, accessibility analysis, emergency response, logistics, transportation, and service coverage optimization by mapping areas that can be reached in a specific amount of time or distance from a point.
Site selection process

To select a site using GIS, first, define the selection criteria (e.g., proximity to infrastructure, environmental factors). Collect relevant spatial data, such as topography, land use, and environmental features. Preprocess the data for consistency and overlay it in GIS software. Conduct a suitability analysis using techniques like weighted overlay to evaluate sites. Rank the locations based on suitability, and validate the top candidates with field surveys or expert input to ensure they meet the project’s requirements.

Application of site selection
Real Estate Development – Site selection helps identify the best locations for residential, commercial, or industrial properties based on factors like accessibility, demand, and infrastructure.
Business Location Analysis – Businesses use site selection to determine optimal locations for retail stores, factories, or offices, considering market potential, supply chain access, and demographics.
Urban Planning – Guides the planning of new neighborhoods, schools, hospitals, and public services, ensuring proper zoning and efficient land use.
Agriculture – Helps farmers select land based on soil quality, water availability, and climate conditions to maximize crop yield.
Disaster Management – Assists in selecting safe areas for critical infrastructure (e.g., hospitals, shelters) by avoiding flood-prone, earthquake-sensitive, or hazardous zones.
Use case of Retail Store Location – A retail company uses site selection to identify the best locations for new stores based on factors such as foot traffic, proximity to competitors, and local demographics. GIS tools help analyze the area’s accessibility, customer preferences, and traffic patterns to optimize sales potential.

An open-source web tool for creating maps
MAPOG is an open-source web tool that allows users to create dynamic maps for site selection in supply chain optimization and logistics planning. It enhances visual storytelling by altering color gradients and incorporating layers. GIS optimizes e-commerce warehouse locations for efficiency, cost, and accessibility.
Final Thoughts:
GIS-based site selection enhances decision-making by analyzing spatial data, optimizing locations, reducing costs, and improving efficiency. Its data-driven approach ensures sustainability, accuracy, and strategic planning for businesses, infrastructure, and environmental projects.
#gis data#GISMapping#DataVisualization#Siteselection#Sitesutabilityanalysis#Isochrome analysis#Supply chain optimization#Logistics planning#GISforGood#GeoAnalytics
1 note
·
View note
Text
youtube
#data science#gis#maps#qgis#data analysis#data analytics#arcgis#arcgis pro#database#business#Youtube
0 notes
Text
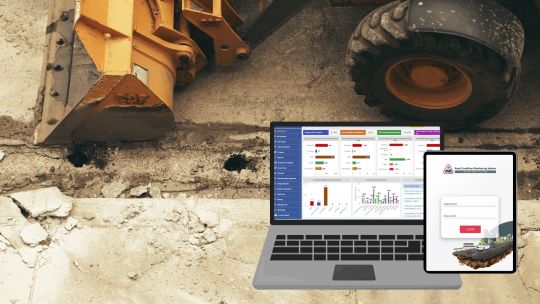
Road Condition Monitoring System(RCMS): Enhancing Efficiency with AI-Powered Solutions
The quality and sustainability of road infrastructure play a pivotal role in societal development, economic growth, and the safety of communities. To address the challenges of road construction and maintenance, advanced digital tools such as Road Condition Monitoring Systems (RCMS) are becoming indispensable. Leveraging technologies like AI-powered pothole detection, data analytics, and interactive visualization, RCMS ensures efficient planning, monitoring, and maintenance of road networks.
#ai and gis road monitoring solutions#geospatial road management solutions#geospatial road monitoring system#gis based pothole mapping and detection#gis based road condition monitoring system#gis based road inspection software#gis based road survey solutions#gis data analysis for road monitoring#gis mapping for road condition analysis#gis road maintenance solutions#land management system#gis tools for road condition assessment#pothole detection using gis technology#real time road condition monitoring gis#road condition assessment using gis#road condition monitoring using gis#road infrastructure monitoring with gis#road maintenance gis software#road safety monitoring with gis systems#road surface monitoring with gis#smart road condition monitoring gis
1 note
·
View note
Text
Gis&RS
I will do gis mapping digitizing, georeferencing, spatial analysis, remote sensing

#GIS&RS#Data analysis #google earth
#geographical information system#remot sencing#data analysis#visuilazation#google earth#q gis#arcgis
1 note
·
View note
Text

NOW HIRING - Special Projects Assistant
Chicago Residency at time of job start required
Join the Rethinking Lawns Research Team (http://rethinkinglawns.com) and study the impacts of lawns and their potential alternatives in Chicago! Lead field experiments, manage experimental sites, and collect and manage data. Ideal candidate will have experience in project coordination and ecological field work.
Full description under the cut!
The Chicago Park District is seeking an experienced candidate to join our Natural Areas team, a part of the Park District’s Department of Cultural and Natural Resources. The Special Projects Assistant will be a member of the Rethinking Lawns project, a multi-disciplinary team exploring the ecological and ecosystem services benefits of traditional lawns, natural areas, and native, short-statured lawn replacement plantings. More information about the project can be found at rethinkinglawns.com. The ideal candidate will have experience in project coordination and ecological field work, preferably in a leadership capacity.
Key responsibilities include leading a team of seasonal research assistants in collecting data on plant cover, pollinator visitation, water infiltration, temperature, and soils at sites throughout Chicago and at the Chicago Botanic Garden. The Special Projects Assistant will participate in regular project coordination meetings with the research team, and oversee scheduling, coordination, communication, and data entry. They will also regularly interact with landscaping contractors, colleagues and the project team regarding installation and maintenance of plantings. Exceptional candidates will have some experience in data management, and analysis using R, and/or GIS. There are opportunities to present at local and national conferences. Local travel to field sites is required.
Desired Qualifications:
Bachelor's degree in Biology, Environmental Science, or a related field, or a combination of education and experience.
Knowledge of ecological principles and practices.
Ability to research information and prepare clear written or oral reports.
Ability to relate to field personnel and community groups, particularly in an urban setting.
Data entry, writing, computer skills.
Knowledge of contemporary research and communication practices.
City of Chicago residency is required at time of job start.
This position is based out of North Park Village (5801 N. Pulaski Rd.) and includes frequent citywide travel.
187 notes
·
View notes
Text
All the ninja should’ve been ‘inventors’ to some extent!!!
It’s strange to me that the excuse to remove Jay’s inventor character traits was that there were ‘too many inventors on the team’. Especially when the team is constantly in need of mechs, land vehicles, ships and weapons!!! That are constantly being destroyed and need to be rebuilt quickly might I add. Would it not be more useful to have as many builders and mechanics as possible?? (I do get that from a character building perspective you’d want each character to have their own individual traits though). If anything, all the ninja should’ve been contributing to the arsenal in someway or another. Also would’ve been cool to see the team work together in a really casual non-life threatening way for once.
If I were to give them each a role I would say:
Kai- welding and weapons forging (I do recall he remade the golden weapons but hc that he makes all their weapons)
Cole- designer of suits, armour and mechs (he is characterised as being talented in art). Idk mabey he sews the suits himself (I love the idea that he made himself the sleeveless gi).
Jay-builder of jets and flying mech suits (I don’t recall him making any land vehicles tbh) and helps brainstorm designs and ideas with Cole. Also any gadgets that may help their missions, like hang gliders.
Zane- responsible for adding ai and technology to all mechs and vehicles. Also keeps track of communication devices for the team and helps Pixal with data analysis.
Pixal- makes mech suits and land vehicles with Nya, analyses data with Zane and techs up devices for the team
Nya- occasionally forged weapons but prefers to build mechs as well as land and sea vehicles.
Lloyd- collects funding from the mayor and Cyrus borg??? Honestly he has enough to do as it is so mabey he can sit this one out. Maybe he tests everything out and certifies it as ‘save to use’.
11 notes
·
View notes
Note
condolences from an environmental studies adjacent asian who does like the field work but is similarly struggling to get hired - it's rough out here. depending on what area of environmental science you studied, a lot of data entry / analysis is transferable, as are skills in lab work, modeling, mapping / gis, and grant writing / policy. marketing and communications or outreach might also be an option if you're more socially inclined. hopefully that's somewhat helpful? wishing you luck finding a job

thank you its nice to know i can change Something Eventually
21 notes
·
View notes
Text
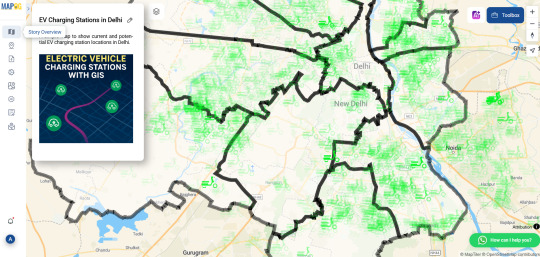
Mapping Electric Vehicle Charging Stations Using GIS
As cities embrace cleaner transportation, the demand for electric vehicle (EV) charging infrastructure is surging. Yet while EVs gain popularity, many urban areas are still figuring out where to place charging stations most effectively. Without careful planning, some neighborhoods end up with clusters of chargers while others are left underserved. That’s where Geographic Information Systems (GIS) come in—offering a smarter, data-driven way to visualize and plan for EV needs.

How GIS Makes the Network Smarter GIS lets you see beyond the street level. By uploading spatial data like traffic density, residential zones, and current EV station locations, urban planners can create layered maps that highlight gaps and overlaps. You can also add custom fields like “charger type” or “station usage” to analyze performance and capacity.
One powerful technique is spatial buffering—drawing influence zones around each station to visualize coverage. Combine this with cross-layer analysis, and you can pinpoint underserved areas based on traffic flow, proximity to major roads, or even power grid access. These insights aren’t just helpful for long-term planning—they’re essential for avoiding grid strain and ensuring accessibility across income groups.
Who’s Using It? Governments, transport planners, and sustainability teams are now turning to GIS to guide EV infrastructure rollouts. Private companies use it to select profitable locations. Utility providers rely on spatial analysis to prepare for increased electricity demand. Even environmental groups and tech startups are tapping into GIS tools to support EV adoption through better planning and advocacy.
Simple, Powerful Mapping Tools You don’t need to be a GIS expert to start mapping. Browser-based platforms like MAPOG are lowering the barrier, allowing users to upload Excel files, style data, and analyze spatial relationships without complicated software installs. Want to compare EV charger density across cities? Or see how charger accessibility overlaps with income levels? Tools like these make that kind of insight easy to visualize—and easier to act on.
Charging Toward a Greener Future The road to sustainability is paved with good data. With GIS tools in hand, EV infrastructure planning becomes more equitable, efficient, and transparent. Whether you're part of a government initiative, a startup, or a local community group, these maps can help you answer a simple but powerful question: where should we build next?
Have you tried mapping EV stations in your city? Upload your data, run some spatial analysis, and see the electrified future unfold—one layer at a time.
2 notes
·
View notes
Text
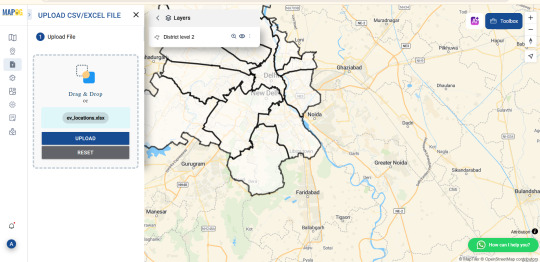
Visualizing Population Density Map by Districts
In many parts of the world, one recurring challenge for urban planners, governments, and researchers is the imbalance of population distribution. Some districts are bursting at the seams, while others remain underpopulated and under-resourced. This uneven spread often leads to strained public transport, overloaded health services, or inefficient infrastructure development. But there's a solution to visualize, understand, and tackle this issue effectively—population density mapping by districts.
Geospatial technology, specifically GIS (Geographic Information Systems), provides a powerful lens to identify where resources are most needed. By analyzing district-level population data on a map, you can spot trends, gaps, and growth zones in a matter of minutes. But how do you actually bring this analysis to life?

What Is a Population Density Map and Why Is It Useful?
A population density map shows how many people live in a given area—often visualized using a choropleth style, where different shades represent population levels. The darker the color, the higher the density. When broken down by administrative districts, such maps reveal precise hotspots and offer insight that spreadsheets simply cannot deliver.
This becomes especially useful when you're trying to:
Allocate public funds for education, healthcare, or transportation.
Predict migration trends and future settlement expansion.
Support emergency response planning by identifying vulnerable zones.
Whether you're working in urban governance, public health, real estate, logistics, or research, understanding population patterns is a strategic advantage.
The GIS Approach: Upload, Style, and Analyze
With modern GIS tools, creating a district-level population map is now easier than ever. You typically start by uploading a vector shapefile that contains district boundaries along with embedded population data. Next, you style it using quantity-based symbology (graduated colors or size) that visualizes varying density levels.
One such platform that allows you to create grid-based or district-level density maps without requiring a steep learning curve is MAPOG. Without getting too technical, it lets you upload your spatial files and customize styles based on population values, helping transform raw data into interactive, readable insights.
You can also layer additional datasets—like infrastructure, healthcare centers, or transportation networks—to see correlations or plan improvements. Think of it as visual storytelling backed by real-time data.

Who Benefits From These Maps?
Population density analysis has applications across multiple industries:
Urban Planners use it to shape future housing projects and avoid overcrowding.
Policy Makers rely on it for smarter fund allocation and resource planning.
Environmentalists assess human pressure on ecosystems and biodiversity.
Retail Brands scout high-footfall districts for new store locations.
NGOs plan intervention strategies in underserved communities.
In essence, population mapping helps bridge the gap between where people are and what they need—be it roads, water, jobs, or public safety.
Closing Thoughts: Making Data Visually Intelligent
Creating a district-wise population density map isn’t just a technical task—it’s a step toward more informed decisions. It gives data a face, tells a story, and reveals patterns that static reports often miss.
If you're ready to take your spatial analysis to the next level, consider exploring platforms that allow you to build these maps intuitively and interactively. Tools like MAPOG make it surprisingly easy to visualize demographic data in a way that’s both functional and visually striking.
#mapog#Population Mapping#spatial analysis#gismapping#data visualization#gis#GISForDevelopment#smartcities#urban planning#mapping
0 notes
Text
How GIS Is Improving Traffic Management and Road Safety
The Growing Urban Traffic Crisis
Traffic congestion and road safety have become major urban issues in cities worldwide. With more vehicles on the road each year, traditional approaches to traffic planning often lag behind the realities on the ground. Poorly timed signals, accident-prone intersections, and missing data on high-risk zones contribute to delays and danger for drivers, cyclists, and pedestrians alike. Addressing these challenges requires more than just street-side observations—this is where Geographic Information Systems (GIS) come into play.

Visualizing Risk with GIS Tools
GIS is transforming the way cities approach traffic safety by turning raw data into spatial intelligence. By layering different types of information—road networks, traffic volume, crash reports, and population density—GIS allows urban planners to see beyond static maps. With tools like Buffer Tool and Vector Files , it’s now possible to identify high-risk zones with pinpoint accuracy.
In my own traffic mapping project, I used vector files to highlight major accident zones across several key intersections. By applying buffer analysis, I could define impact areas surrounding those hotspots and understand how nearby roads, pedestrian paths, and intersections were affected. These layers helped create a visual story of risk that was far more effective than any spreadsheet or report could convey.
Why It Matters: From Data to Safer Streets
The insights gained from GIS analysis aren’t just theoretical—they directly inform real-world actions. Transportation departments use this data to prioritize intersection redesigns, add traffic-calming measures, or optimize signal timing. Public safety officials use GIS to plan for emergency response routes, while urban designers rely on it to avoid placing new schools, hospitals, or bus stops near high-incident zones.

By identifying accident clusters through GIS, resources can be allocated more efficiently. Instead of reacting after the fact, cities can anticipate and prevent problems. It’s proactive planning instead of reactive patchwork.
Who Uses GIS for Road Safety?
Government traffic departments, city planners, and transportation engineers are leading the charge in using GIS for safer roads. But the reach goes beyond institutions. Community groups, researchers, and even independent analysts can use web-based GIS tools to advocate for safety improvements in their neighborhoods. Clear spatial visualizations help communicate traffic issues more effectively to decision-makers.
Smarter Mapping Through Accessible Platforms
What’s exciting is how accessible GIS has become. Web-based platforms now allow users to upload GIS data, overlay Vector Files, and perform spatial analysis directly in the browser—no specialized software or technical background required. Platforms like MAPOG, for example, offer these capabilities in a user-friendly interface that makes it easy to visualize accident hotspots, create buffer zones, and explore traffic flow scenarios. These tools are especially helpful for projects where quick, visual insights are needed.

Conclusion: From Congestion to Clarity
Cities can’t afford to keep guessing when it comes to traffic management and road safety. GIS offers a smarter, clearer, and more data-driven way to understand and solve traffic challenges. By mapping accident trends, simulating traffic changes, and visualizing risk zones, GIS helps create safer roads for everyone.
Whether you're working with a city planning team, leading a research project, or simply curious about local traffic patterns, modern mapping tools—like those offered by platforms such as MAPOG—make it easier than ever to turn spatial data into safer streets.
Have you explored your local traffic data? Try visualizing it with a GIS platform that supports buffer analysis and vector mapping—you might just uncover insights that could prevent the next accident.
2 notes
·
View notes
Text
How Civil Engineering Courses Are Evolving with New Technology
Civil engineering is no longer just about bricks, cement, and bridges. It has become one of the most future-focused fields today. If you are planning to study civil engineering, you must understand how the course has evolved. The best civil engineering colleges are now offering much more than classroom learning.
You now study with technology, not just about it. And this shift is shaping your career in ways that were never possible before.
Technology is Changing the Civil Engineering Classroom
In the past, civil engineering courses relied on heavy theory and basic field training. Today, you learn through software, simulations, and smart labs. At universities like BBDU in Lucknow, classrooms are powered by tools like AutoCAD, Revit, STAAD Pro, and BIM.
These tools help you visualize structures, test designs, and even simulate natural forces.
You work on 3D modeling tools
You test designs virtually before real-world execution
You understand smart city layouts and green construction methods
This means your learning is hands-on, job-ready, and tech-driven.
You Learn What the Industry Actually Uses
Most construction and infrastructure companies now depend on digital tools to plan, design, and execute projects. This is why modern B.Tech Civil Engineering courses include:
Building Information Modelling (BIM)
Geographic Information Systems (GIS)
Remote Sensing Technology
Drones for land surveying
IoT sensors in smart infrastructure
Courses in colleges like BBDU include these topics in the curriculum. You do not just learn civil engineering. You learn the tools that companies expect you to know from day one.
The future of Civil Engineering is Data-Driven
You might not think of civil engineering as a data-heavy field. But now, big data is used to monitor structural health, traffic flow, and resource planning. Many universities have added data analysis and AI basics to help you understand how smart infrastructure works.
By learning how to handle real-time data from buildings or roads, you become more skilled and more employable.
Real-world exposure is Now Part of the Course
Good civil engineering colleges in Uttar Pradesh understand that you need industry exposure. Colleges like BBDU offer:
Internships with construction firms and government bodies
Industry guest lectures and site visits
Capstone projects linked to real problems
You are not just attending lectures. You are solving real-world construction challenges while still in college.
Why Choose BBDU for Civil Engineering?
In Lucknow, BBDU is one of the few private universities offering a modern civil engineering course with world-class infrastructure. You learn in smart labs, access tools used by top firms, and receive career counseling throughout the program.
Here’s what makes BBDU a smart choice:
Advanced labs and smart classrooms
Training in AutoCAD, STAAD Pro, BIM
Live projects and on-site construction learning
Career cell and placement support
Affordable fees and scholarships for deserving students
Civil Engineering is Still One of the Most Stable Careers
Reports show that India will spend over ₹100 lakh crores on infrastructure in the next few years. Roads, smart cities, renewable power plants, metros – all need civil engineers. And companies prefer students trained in construction technology, digital tools, and real-world planning.
So, if you're thinking about joining a course, look at how it prepares you for tomorrow.
The future of civil engineering is digital, and your education should be too. Choose a program that keeps up with the times. Choose a university that helps you build more than just buildings – it helps you build your future.
Apply now at BBDU – one of the most future-focused civil engineering colleges in Uttar Pradesh.
2 notes
·
View notes
Text

Membuat proyek baru di ArcGIS PRO 3 Memulai aplikasi dan membuat proyek baru di ArcGIS PRO 3, baik dengan check pilihan "create a new folder for this project atau tidak" https://youtu.be/ykNRVRZcwTw
0 notes
Text
Enhancing Gas Pipeline Management with GIS: Key Benefits and Applications
In the energy and utilities sector, gas pipeline management is complex, requiring precision, safety, and a clear strategy for both existing infrastructure and future expansion. Geographic Information Systems (GIS) have revolutionized pipeline management by providing a spatially accurate, data-rich view of assets. From asset management and leak detection to route planning and demand forecasting, GIS is becoming indispensable for gas companies. This blog delves into the ways GIS transforms gas pipeline management, delivering benefits across safety, efficiency, cost-saving, and planning.
#benefits of using gis for gas pipelines#ensuring gas pipeline safety with gis tools#gas network analysis#gas pipeline asset management#gas pipeline gis mapping services#gas pipeline leak detection using gis#gas pipeline management in gis#gas pipeline mapping software#gas pipeline monitoring tools#gas pipeline risk assessment#gis applications in energy sector#gis for gas pipeline monitoring#gis for infrastructure management#gis in oil and gas industry#gis pipeline maintenance software#gis pipeline monitoring system#gis pipeline route planning#gis software for gas pipeline route optimization#victoryofgoodoverevil#gis solutions for pipeline maintenance and monitoring#gis-based pipeline integrity management#pipeline data management#pipeline geographic information systems#pipeline management solutions#remote sensing for gas pipelines#spatial analysis for gas pipelines#spatial data for gas pipelines
0 notes