#SpatialAnalysis
Explore tagged Tumblr posts
Visit Tumblr Blog
Explore Tumblr blogs with no restrictions, modern design and the best experience.
Last Seen Tumblr Blogs


Fun Fact
There were a total of 171.5 billion posts on Tumblr in 2019.
Text
How GIS Is Improving Traffic Management and Road Safety
The Growing Urban Traffic Crisis
Traffic congestion and road safety have become major urban issues in cities worldwide. With more vehicles on the road each year, traditional approaches to traffic planning often lag behind the realities on the ground. Poorly timed signals, accident-prone intersections, and missing data on high-risk zones contribute to delays and danger for drivers, cyclists, and pedestrians alike. Addressing these challenges requires more than just street-side observations—this is where Geographic Information Systems (GIS) come into play.

Visualizing Risk with GIS Tools
GIS is transforming the way cities approach traffic safety by turning raw data into spatial intelligence. By layering different types of information—road networks, traffic volume, crash reports, and population density—GIS allows urban planners to see beyond static maps. With tools like Buffer Tool and Vector Files , it’s now possible to identify high-risk zones with pinpoint accuracy.
In my own traffic mapping project, I used vector files to highlight major accident zones across several key intersections. By applying buffer analysis, I could define impact areas surrounding those hotspots and understand how nearby roads, pedestrian paths, and intersections were affected. These layers helped create a visual story of risk that was far more effective than any spreadsheet or report could convey.
Why It Matters: From Data to Safer Streets
The insights gained from GIS analysis aren’t just theoretical—they directly inform real-world actions. Transportation departments use this data to prioritize intersection redesigns, add traffic-calming measures, or optimize signal timing. Public safety officials use GIS to plan for emergency response routes, while urban designers rely on it to avoid placing new schools, hospitals, or bus stops near high-incident zones.

By identifying accident clusters through GIS, resources can be allocated more efficiently. Instead of reacting after the fact, cities can anticipate and prevent problems. It’s proactive planning instead of reactive patchwork.
Who Uses GIS for Road Safety?
Government traffic departments, city planners, and transportation engineers are leading the charge in using GIS for safer roads. But the reach goes beyond institutions. Community groups, researchers, and even independent analysts can use web-based GIS tools to advocate for safety improvements in their neighborhoods. Clear spatial visualizations help communicate traffic issues more effectively to decision-makers.
Smarter Mapping Through Accessible Platforms
What’s exciting is how accessible GIS has become. Web-based platforms now allow users to upload GIS data, overlay Vector Files, and perform spatial analysis directly in the browser—no specialized software or technical background required. Platforms like MAPOG, for example, offer these capabilities in a user-friendly interface that makes it easy to visualize accident hotspots, create buffer zones, and explore traffic flow scenarios. These tools are especially helpful for projects where quick, visual insights are needed.

Conclusion: From Congestion to Clarity
Cities can’t afford to keep guessing when it comes to traffic management and road safety. GIS offers a smarter, clearer, and more data-driven way to understand and solve traffic challenges. By mapping accident trends, simulating traffic changes, and visualizing risk zones, GIS helps create safer roads for everyone.
Whether you're working with a city planning team, leading a research project, or simply curious about local traffic patterns, modern mapping tools—like those offered by platforms such as MAPOG—make it easier than ever to turn spatial data into safer streets.
Have you explored your local traffic data? Try visualizing it with a GIS platform that supports buffer analysis and vector mapping—you might just uncover insights that could prevent the next accident.
2 notes
·
View notes
Text
📌Project Title: Integrated Geo-Spatiotemporal Epidemiological Surveillance and Forecasting System. 🔴
ai-ml-ds-geoepi-forecast-002 Filename: geo_spatiotemporal_epidemiological_surveillance_forecasting.py Timestamp: Mon Jun 02 2025 19:06:02 GMT+0000 (Coordinated Universal Time) Problem Domain:Public Health Informatics, Epidemiology, Geospatial Data Science, Time Series Forecasting. Project Description:This project develops a sophisticated system for monitoring and forecasting infectious…
#DataScience#DiseaseSurveillance#Epidemiology#forecasting#GeoPandas#GeoSpatial#pandas#prophet#PublicHealth#PySAL#python#SpatialAnalysis#TimeSeries
0 notes
Text
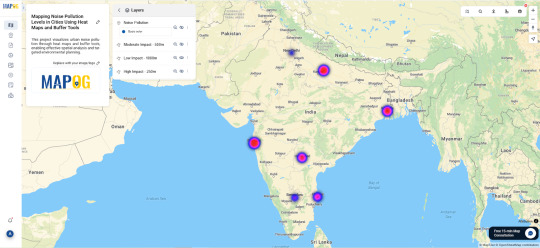
Mapping Urban Noise Pollution Using GIS: Heat Maps and Buffer Analysis
Geographic Information Systems (GIS) provide a powerful lens for visualizing issues we can't see like urban noise pollution. By applying tools such as heat maps and buffer zones, users can capture and interpret sound pollution data from sources like traffic, railways, construction, and industry. This project blends spatial analysis with real-world data, offering valuable insights for professionals and learners aiming to create healthier, data-informed cities.

Why Map Urban Noise?
Noise pollution is a growing concern in urban environments, contributing to stress, sleep disturbances, and long-term hearing loss. Mapping it spatially using GIS allows for the identification of noise hotspots and their proximity to vulnerable locations such as schools and hospitals. These visual insights help guide urban design decisions and enable more targeted mitigation strategies.
Educational and Technical Value of GIS Noise Mapping
Environmental Literacy: Understand how noise affects human health and urban life.
Geospatial Reasoning: Learn how physical layout and infrastructure influence sound patterns.
Hands-On Learning: Work with authentic datasets for real-world relevance.
GIS Proficiency: Gain experience with data input, analysis, and map creation.
Policy Understanding: Explore how mapping informs planning and regulation.
Key Tools and Features
Heat Maps: Visualize noise intensity with color gradients.
Buffer Zones: Define impact ranges (250m, 500m, 1km) around high-noise areas.
Data Import: Upload structured CSV files with spatial attributes.
Interactive Output: Share and embed maps across platforms for broader impact.
Procedure: How to Map Noise Pollution in MAPOG
Start by collecting or simulating noise data from sources like mobile apps or government databases. Your dataset should include location names, geographic coordinates, decibel levels, noise sources, and optional time stamps. Organize the data in a CSV file with clearly labeled columns. Create a new map project, upload your CSV, and match the correct latitude and longitude fields. Open the attribute table and add a column titled “Values in dB,” where you'll manually enter each location's noise level. After validating the entries, use the Buffer Tool to generate circular impact zones: 250 meters for High Impact, 500 meters for Moderate, and 1 kilometer for Low. Then activate the Heat Map layer, set the “Values in dB” column as the intensity input, and apply a color scheme Blue for ≤50 dB, Pink for 51–70 dB, and Red for >70 dB. Finalize your analysis by duplicating this setup across all buffer ranges and sharing the map via a public link or embedded widget.
Use Case: Smart City Development
Noise pollution mapping plays a critical role in designing smart, sustainable cities. Planners and developers can use GIS data to identify high-noise corridors and make informed decisions about zoning, construction, and traffic flow. By integrating this analysis into smart infrastructure systems, cities can proactively monitor noise exposure and adapt accordingly through green barriers, quiet zones, or dynamic routing. These maps become part of the urban feedback loop, supporting data-driven solutions for better living conditions and environmental performance.
Open GIS Tools for Inclusive Innovation
Platforms like MAPOG offer accessible entry points for anyone interested in spatial analysis. With intuitive interfaces and no coding required, these tools support collaborative innovation across disciplines whether in classrooms, planning departments, or civic labs. Users can quickly visualize complex data, share results, and build transparency in urban management.
Conclusion
Using GIS to map noise pollution translates invisible urban challenges into understandable, shareable insights. Whether you're working in urban tech, education, or public policy, these tools foster smarter decision-making and encourage healthier, more adaptive city environments. Join the movement to map your city's soundscape and help shape the future of smart urban living.
#UrbanNoise#NoisePollution#GISMapping#SmartCities#EnvironmentalAwareness#CityPlanning#InteractiveMaps#EdTech#STEMLearning#MapOG#SpatialAnalysis#HealthyCities
1 note
·
View note
Text

ArcGIS Pro Made Easy! Learn GIS Mapping & Analysis with Udemy
🗺️ New to ArcGIS Pro? This course makes learning GIS fun and easy! Gain real-world skills in mapping, spatial analysis, and geospatial data handling with hands-on exercises.
🔥 GET DISCOUNT 48% OFF (ONLY $12.99 FROM $19.99) – LIMITED TIME, ENROLL NOW !
📌 Start today & become a GIS expert in no time!
#GISbeginner#ArcGISProTutorial#SpatialAnalysis#ArcGISProtraining#LearnMapping#GISdata#GeospatialScience#CartographyTips#GISlearning#UdemyGIS🚀
0 notes
Text

Discover how GIS Technology enhance climate research by providing accurate mapping, spatial analysis and real-time environmental monitoring.
0 notes
Text
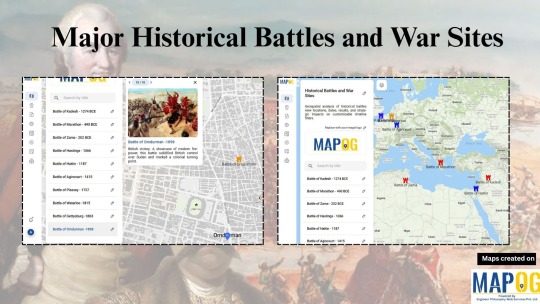
How GIS Is Reimagining Historical Battles and War Sites
History doesn’t just happen, it happens somewhere. Every great battle, from ancient times to modern wars, unfolded across real terrain. And yet, we often learn about war without ever understanding the land that shaped it. That’s where Geographic Information Systems (GIS) step in, offering a way to map the past and see history in a whole new dimension.
Whether it’s the Battle of Thermopylae, Hastings, or Stalingrad, GIS helps us explore not just what happened, but where and why it mattered.
Seeing Strategy Through Space
Using GIS tools, we can now visualize battlefield locations, terrain advantages, movement routes, and areas of control. In one of my recent projects using MAPOG, I plotted a timeline of key battles across ancient, medieval, and modern periods. Each point told a story of strategy, geography, and impact.

I added elevation data to understand why armies chose certain high ground. I layered historical sites with modern maps to trace how landscapes have changed over centuries. The result? A living, visual archive of human conflict across time.
Why It Matters: Turning History into Experience
GIS doesn’t just make maps — it makes arguments visible. It shows:
Why a river crossing changed a war
How a forest slowed an army’s advance
Where supply lines ran thin
Which battlegrounds are now forgotten beneath cities
These aren’t just cool visuals, they help students, educators, and researchers tell more complete and compelling stories about war and human history.
Who Uses GIS to Map War?
Today, GIS is being used by archaeologists, military historians, museum curators, and even students working on school projects. The beauty? You don’t need to be a mapping expert.
Platforms like MAPOG let you drop pins, color-code eras, upload visuals, and organize battles into eras all in a few clicks. You can focus on the storytelling, not the software.
Making It Easy with Tools Of GIS
I used MAPOG List View Map to organize battles chronologically. With symbols for each conflict and color codes for different eras (Red for Ancient, Blue for Medieval, Orange for Modern), the map turned into a timeline across geography.
MAPOG made it easy to:
Add point , add title write description
Add photos, summaries, and custom labels
Explore terrain using satellite overlays
Share the final map with friends, students, or an audience

If you’re into history, this is the kind of project that makes the past feel alive again.
Conclusion: Seeing the Past, Shaping the Future
History isn’t just what happened. It’s where it happened and understanding that can change how we learn, teach, and remember.

With GIS, we’re not just reading about wars, we’re exploring them, walking their paths, and seeing their impact. So if you’ve ever wanted to time-travel through maps, start with a project like this. Use GIS, use MAPOG, and turn names and dates into living stories on the land.
1 note
·
View note
Text
Want to become an ArcGIS Desktop 10.8 expert? 🚀
English Video tutorial, just for $9.99 (NORMAL price $19.9) till 25/02/2025. Get it once and you will get endless access right
This complete guide takes you from beginner to pro, covering essential tools, data management, and spatial analysis techniques. Whether you're a student or a GIS professional, this tutorial will elevate your mapping skills!
✅ Learn hands-on GIS workflows ✅ Master spatial analysis & geoprocessing tools ✅ Create powerful maps & visualizations
0 notes
Text
Alteryx Data & Analytics

Alteryx Data & Analytics Platform: A Comprehensive Report
Alteryx Data & Analytics provide a comprehensive self-service analytics solution that caters to various data blending, preparation, and advanced analytics tasks. It delivers powerful features, predictive modeling, and spatial analysis capabilities. Introduction Alteryx is a powerful and versatile data analytics and automation platform designed to empower businesses to transform raw data into actionable insights. By unifying data preparation, blending, analysis, and visualization capabilities in a user-friendly interface, Alteryx democratizes analytics, enabling both technical and non-technical users to participate in the data-driven decision-making process. Key Components and Features - Alteryx Designer: The core of the platform, Designer offers a drag-and-drop workflow environment with over 300 pre-built tools for data access, preparation, blending, analysis, and output. Its intuitive interface allows users to visually design and automate data workflows without extensive coding knowledge. - Alteryx Server: This component enables the sharing and scheduling of workflows built in Designer, facilitating collaboration and broader access to analytics across the organization. It also enhances performance by leveraging server resources for complex data processing tasks. - Alteryx Analytics Cloud: This cloud-based platform provides a unified environment for data preparation, blending, and advanced analytics. It integrates Designer Cloud powered by Trifacta, offering AI-driven data preparation capabilities and enhanced collaboration features. - Alteryx Machine Learning: This cloud-native solution democratizes machine learning by providing an intuitive interface for building, training, and deploying predictive models. It automates key tasks like feature engineering and model selection, making machine learning accessible to a wider audience. Key Capabilities and Benefits - Data Preparation and Blending: Alteryx excels at simplifying the often complex and time-consuming process of data preparation. It allows users to connect to and integrate data from various sources, cleanse and transform data, and prepare it for analysis. - Advanced Analytics: The platform supports a wide range of analytical techniques, including statistical analysis, predictive modeling, spatial analysis, and text mining. This enables users to uncover deeper insights and make more informed decisions. - Automation and Scalability: Alteryx enables the automation of repetitive data tasks, freeing up analysts to focus on higher-value activities. Its server-based architecture ensures scalability to handle growing data volumes and user demands. - Improved Decision-Making: By providing self-service access to data and analytics, Alteryx empowers users across the organization to make data-driven decisions, leading to improved business outcomes. Use Cases Alteryx finds applications across various industries and departments, including: - Marketing: Customer segmentation, campaign analysis, and marketing performance optimization. - Sales: Sales forecasting, lead scoring, and territory analysis. - Operations: Supply chain optimization, fraud detection, and risk management. - Finance: Financial reporting, budgeting, and forecasting. - Human Resources: Workforce analytics, talent acquisition, and employee retention. Competitive Landscape Alteryx competes with other data analytics and business intelligence platforms, including: - Tableau: Focuses on data visualization and exploration. - Power BI: Microsoft's business intelligence tool with strong integration with other Microsoft products. - Qlik Sense: Offers associative data exploration and visualization capabilities. - Dataiku: Provides a collaborative platform for data scientists and business analysts. Strengths and Weaknesses Strengths: - User-friendly interface with drag-and-drop functionality. - Wide range of pre-built tools for data preparation and analysis. - Strong automation capabilities for repetitive tasks. - Scalable architecture to handle large data volumes. - Extensive community and support resources. Weaknesses: - Can be expensive for smaller organizations or individual users. - Some advanced features require coding knowledge. - Integration with certain data sources can be challenging. Conclusion Alteryx is a comprehensive and powerful data analytics platform that simplifies the process of turning data into actionable insights. Its user-friendly interface, extensive capabilities, and automation features make it a valuable tool for businesses of all sizes. By empowering users across the organization to participate in the data-driven decision-making process, Alteryx helps drive business growth and improve outcomes. Additional Resources: - Alteryx Website: https://www.alteryx.com/ - Alteryx Community: https://community.alteryx.com/ - Alteryx Academy: https://community.alteryx.com/t5/Alteryx-Academy/ct-p/alteryx-academy Read the full article
#Businessintelligence#Datablending#datapreparation#DataScience#ETL#machinelearning#Predictiveanalytics#self-serviceanalytics#spatialanalysis#workflowautomation
0 notes
Text
Happy New Year from Team CyberSWIFT!
As we step into another exciting year, we extend our heartfelt wishes to you and your family for a year filled with joy, success, and new opportunities. May 2025 bring you endless happiness, good health, and prosperity. Let’s continue to innovate, grow, and create incredible moments together!
#HappyNewYear#TeamCyberSWIFT#Welcome2025#NewYearWishes#2025#CyberSWIFT#GISSolutions#GeospatialTechnology#MappingTheFuture#GISInnovation#SmartMapping#SpatialAnalysis#GISForGood#GeoSolutions#GeospatialInsights
0 notes
Text
GIS Services in Canada
GIS services are crucial for RS Solar CAD Group's operations, aiding in site selection, solar panel placement, and infrastructure planning. Our offerings include spatial analysis, data visualization, and custom mapping solutions tailored to meet the unique needs of solar energy projects. With our expertise, RS Solar CAD Group can optimize their designs, minimize environmental impact, and maximize energy production efficiency.
Our Services include Solar Design Services | GIS | CAD/Drafting | BIM | Project management | Civil Engineering | MEP | Permit plan set
To know more contact us Email: [email protected]/ [email protected] or calling / Whatsapp at +919958060424
#gis#geospatial#mapping#geography#cartography#geodata#spatialanalysis#geoinformatics#geospatialintelligence#geospatialtechnology#permit#proposals#engineeringstamp#solar#solarenergy#solarpower#solarinstallation#usa#usajobs#california#washington#oregon#nevada#idaho#montana#arizona#utah#colorado#newmexico#texas
0 notes
Text
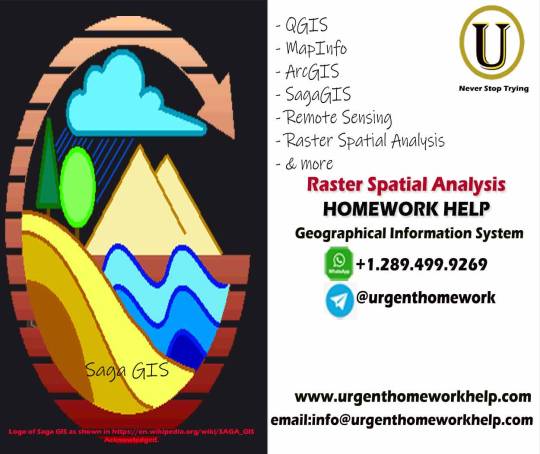
What is Raster Spatial Analysis in GIS? (Geographical Information System)
Raster spatial analysis in #GIS is the process of examining and interpreting information that is stored in a grid format, like pixels in a photograph.
Imagine a map divided into tiny squares, each representing a specific area. These squares hold data, such as temperature, elevation, or land use.
With raster spatial analysis, we can perform various tasks, like identifying patterns, calculating distances, or finding areas with specific characteristics.
For instance, we might use it to determine the slope of a hill, track changes in vegetation over time, or locate regions prone to flooding.
Get help for all types of #SpatialAnalysis homework, assignments and projects in GIS, from top professionals with assured 100% accuarate solutions.
Get in touch with us for help with any GIS application, such as #ArcGIS #QGIS #sagagis and more.
Visit our website for more information: https://www.urgenthomeworkhelp.com/GIS-raster-spatial-analysis.php
#GIShomeworkhelp #GISAssignmentHelp #mapcreation #UrgentHomeworkHelp #24HoursHomeworkHelp
0 notes
Text
Choosing the right GIS software in 2025: ArcGIS Pro vs QGIS 3 Analyzed I have just published a comprehensive comparison of the two leading GIS platforms as they stand in 2025. The age-old battle between proprietary and open-source solutions continues, but with fascinating new developments! Both platforms have evolved dramatically since 2020, with QGIS closing many historical capability gaps while ArcGIS Pro has leaned into enterprise integration and AI. Is your organization making the right choice? Well, the answer depends on your specific needs, budget constraints, and strategic priorities. Check out my full analysis to help navigate this critical decision for your mapping needs! Please do have a look at the post, leave a like and comment your thoughts and your experiences working with these softwares. Also do let me know which software do you think is worth investing for? Since it is the AI revolution, which software can perform tasks with utmost simplicity and efficiently, ArcGIS Pro or QGIS 3? Let's get the conversation and engagement going. Do comment, like, share and subscribe to my blog. Your engagement would mean a lot to me. Let's map the world for a sustainable future with Mapping Tomorrow. 🗺️ Subscribe to my blog website: https://mappingtomorrow.wordpress.com and get started with Mapping Tomorrow. Your one step can change your future. SUBSCRIBE NOW and be updated ahead of everyone. #ArcGISPro #QGIS3 #GISSoftware #GISComparison #GeospatialSoftware #GISTechnology #SpatialData #GISMapping #GeographicInformationSystems #OpenSourceGIS #ProprietaryGIS #GISPlatforms #MapChat #GISCommunity #SpatialAnalysis #GIScience #GeoTech #GISProfessional #GISCareer #GISJobs #GISSkills #GISEducation #GISCertification #EsriUser #QGISCommunity #OpenSourceCommunity #EsriUC #FOSS4G #UrbanPlanning #EnvironmentalGIS #BusinessIntelligence #LocationIntelligence #DataVisualization #TechComparison #SoftwareReview #2025Tech #OpenSource #TechDecisions #SoftwareEvaluation #MappingTomorrow #ProfessionalDevelopment #TechTrends #IndustryInsights #GISTwitter #MapTwitter #TechTwitter #GISLife #MappingCommunity #TechTools #GISResources #GeospatialTechnology #MappingTools
#ai#arcgispro#artificial-intelligence#cartography#education#environment#geographicinformationsystems#geospatialinelligence#geospatialtech2030#gis#gisanalysis#gissoftware#mapping#qgis#technology
0 notes