#InteractiveMap
Explore tagged Tumblr posts
Visit Tumblr Blog
Explore Tumblr blogs with no restrictions, modern design and the best experience.
Last Seen Tumblr Blogs


Fun Fact
Tumblr was the first site to host the blog for President Barack Obama in 2011.
Text
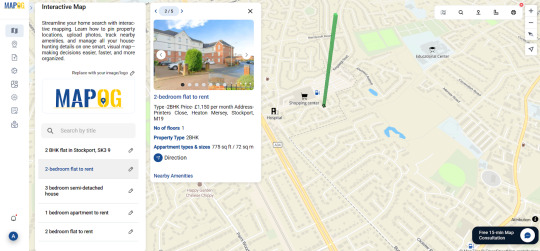
🗺️ How to Organize Your Property Hunt: Pin Live Locations, Add Photos, and Manage All Details on One Interactive Map
Let’s be honest: house hunting can feel like detective work... with no map. You're deep in 10 browser tabs, cross-referencing rent, commute, and where the closest grocery store is—only to forget which home had the big kitchen and which one backed onto a train track.

Here’s a smarter way: turn your property search into an Interactive Property Hunt Map.
Using a tool like MAPOG, you can plot your shortlisted homes, layer in the stuff that actually matters (like schools, markets, transport links), and organize everything into one, beautiful, zoomable canvas. No more clutter. Just location-driven decision-making.
🧭 The GIS Logic Behind It
As someone who works in GIS, this approach makes total sense. Maps aren’t just for navigation—they’re decision tools. And when you're choosing where to live, spatial context is everything.
With MAPOG, you can:
Pin properties you're interested in
Attach rent, area size, and custom notes to each point
Add photos so you actually remember what the place looked like
Layer in amenities (schools, hospitals, shops) to assess proximity
Share it all with family or your agent in one simple link
It’s the difference between “I think I liked that flat?” and “This one’s 12 minutes from work, near two parks, and has the best layout.”
🏡 Where This Works Beautifully in the UK
This isn’t just a cool idea—it’s practical. Especially in urban areas where choices are dense and time matters.
Try it in places like:
📍 Stockport (Greater Manchester) Fast trains to the city, great for families Explore: Marple, Davenport, Heaton Chapel
📍 Sheffield Schools, green space, and walkable neighborhoods
📍 Birmingham See regeneration zones and new builds with urban convenience
📍 Manchester City Centre If you’re into condos, quick access to hospitals, nightlife, and coffee shops
💬 Final Take (from a map nerd)
If you’re going to spend thousands on a new place (or maybe your first!), why not bring spatial awareness into your decision process? Mapping your home search is efficient, empowering, and honestly—it makes the process feel way less chaotic.
With tools MAPOG, you’re not just house hunting. You’re story mapping your next move—literally.
1 note
·
View note
Text
Discovering the World's Great Rivers: An Interactive MapStory
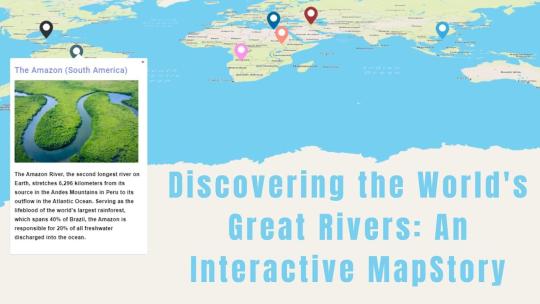
Introduction
Let's dive into the stories of some of the world’s most famous rivers using Story by MAPOG! We’ll look at the Nile, Amazon, Yangtze, Congo, Mississippi, Volga, and Danube rivers. These rivers are more than just water—they’ve shaped cultures, supported wildlife, and influenced history. With MapStory, you’ll get to see how these amazing rivers connect with our world.

The Rivers and Their Stories
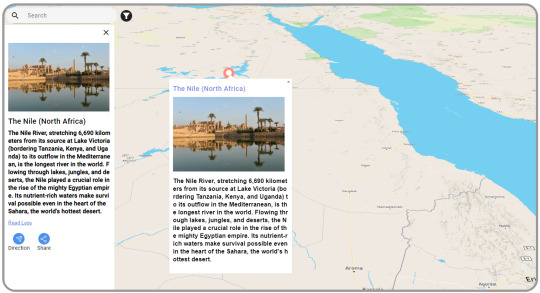
The Nile (North Africa)
The Nile is the longest river in the world. It stretches from East Africa to the Mediterranean Sea. For thousands of years, it’s been crucial for life in North Africa. The Nile provides water for farming and has helped build cities and cultures along its path.
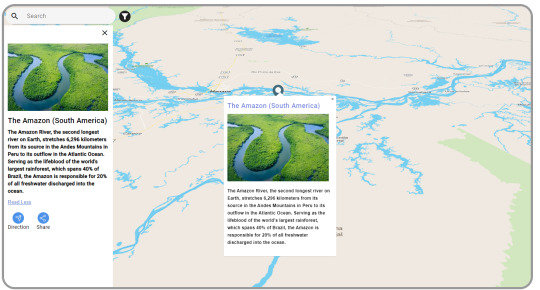
The Amazon (South America)
The Amazon is the largest river by volume. It runs through the Amazon rainforest, known for its incredible wildlife. The Amazon is vital for many plants and animals and plays a big role in regulating the Earth’s weather.
The Yangtze (China)
The Yangtze is the longest river in China. It starts in the Tibetan Plateau and flows to the East China Sea. It’s essential for farming, industry, and millions of people. The Yangtze is deeply connected to Chinese life and culture.

The Congo (Central Africa)
The Congo is Africa’s second-longest river. It’s famous for its rainforests and rich wildlife, like gorillas and elephants. The Congo is key for transportation and trade in Central Africa and helps keep local cultures vibrant.

The Mississippi (North America)
The Mississippi River runs from Minnesota to the Gulf of Mexico. It’s a big part of American history, influencing trade, transportation, and culture. The Mississippi has shaped the lives of many people in the U.S. and inspired music and traditions.

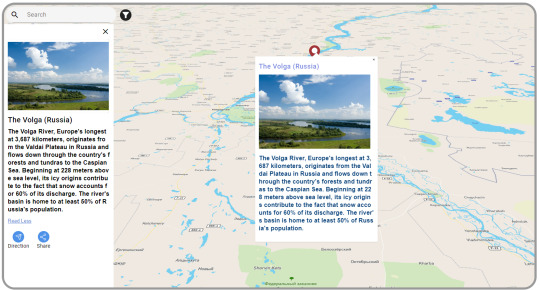
The Volga (Russia)
The Volga is Europe’s longest river. It flows through central Russia and is crucial for farming, energy, and transport. The Volga is important in Russian culture, inspiring many songs and stories.
The Danube (Central and Eastern Europe)
The Danube flows through ten countries, offering stunning views and historic cities like Vienna and Budapest. It’s been a major trade route for centuries and supports diverse wildlife. The Danube helps connect different cultures and economies.

Tool Used: MapStory
We’re using Story by MAPOG to learn about these rivers. It’s not just a map—it’s a way to tell the stories of these rivers and show what makes them unique.
How MapStory Helps
Shows Information: MapStory helps us bring together different details to highlight what makes each river special.
Engages Users: Telling stories through maps makes it easy and enjoyable to learn about the rivers’ history and importance.
Adds Photos: We can include pictures to make the stories about the rivers come to life.
Interactive Map: You can click on the map to find out more about different places and features along each river.
Customizable Stories: Each river’s story can be adjusted to fit various themes and interests, making each map unique.
Who Can Benefit
Story by MAPOG is useful for many areas. Whether you’re interested in environmental studies, education, tourism, cultural preservation, or urban planning, Story by MAPOG offers valuable insights and engaging content. It’s a great tool for anyone curious about these major rivers.
Conclusion
Learning about the world’s great rivers with Story by MAPOG is a fun way to see their beauty and importance. By combining maps with stories, Story by MAPOG helps us connect more with these rivers. For more information or to start your own MapStory journey, visit MAPOG or reach out to us at [email protected].
#GreatRivers#MapStory#MAPOG#NileRiver#AmazonRiver#YangtzeRiver#CongoRiver#MississippiRiver#VolgaRiver#DanubeRiver#InteractiveMap#CulturalHeritage#Wildlife#History#Geography#EducationalTools#Storytelling#Mapping#GlobalRivers#EnvironmentalAwareness#Tourism
1 note
·
View note
Link
Calling all captains, scallywags, and strategy enthusiasts! Brace yourselves for a tidal wave of excitement as Thunderful Games raises the anchor on SteamWorld Heist 2. This highly anticipated sequel to the critically acclaimed turn-based strategy title sets a course for uncharted waters, swapping the confines of spaceships for the open seas. Mark your calendars, because SteamWorld Heist 2 is scheduled to land on PC, PlayStation 5, PS4, Xbox Series X/S, Xbox One, and Nintendo Switch on August 8th, 2024! From Space to Sea: SteamWorld Heist 2 Charts a New Course While the original SteamWorld Heist captivated players with its zero-gravity antics and tactical shootouts within spaceships, SteamWorld Heist 2 takes a dramatic shift in scenery. This sequel dives headfirst into a world inspired by the swashbuckling lore of the Caribbean. Prepare to explore a vibrant world teeming with salty pirates, treacherous waters, and hidden treasures. SteamWorld Heist 2 Sets Sail The iconic steampunk aesthetic that's become synonymous with the SteamWorld franchise gets a swashbuckling makeover in SteamWorld Heist 2. Imagine towering, piston-powered ships battling it out on the high seas, all rendered in the series' signature charm. This unique blend of Victorian-era technology and pirate lore promises a visually stunning and thematically refreshing experience for veterans and newcomers alike. Ahoy There! Prepare for Strategic Turn-Based Battles on the High Seas At its core, SteamWorld Heist 2 retains the strategic turn-based combat that fans adored in the first game. Players will meticulously plan each move, utilizing cover, environmental hazards, and the environment itself to outwit their enemies. The series' signature ricochet mechanic, where bullets can be cleverly bounced around corners to take down foes, makes a triumphant return, adding another layer of depth and strategy to the combat. However, SteamWorld Heist 2 isn't content with simply rehashing a winning formula. The developers promise to introduce new mechanics that will further enhance the strategic gameplay. While details remain under wraps, these additions have the potential to add a fresh layer of complexity and tactical options to the already engaging combat system. Assemble Your Crew and Customize for Victory One of the most exciting additions in SteamWorld Heist 2 is the emphasis on crew customization. Players will be able to assemble a ragtag band of robot pirates, each with unique abilities and upgrade paths. This newfound depth in character development promises to add a whole new dimension to strategic planning. Imagine crafting a crew specifically designed for boarding actions, while another might excel at long-range ship-to-ship combat. The possibilities for customization seem vast, allowing players to tailor their crew to their preferred playstyle. Beyond the Booty: Unveiling the Depths of SteamWorld Heist 2's Story While the original SteamWorld Heist focused primarily on thrilling gameplay, SteamWorld Heist 2 promises to delve deeper into storytelling. The game centers around a mysterious water crisis that threatens the very existence of the robot pirates. Players will take on the role of Captain Leeway, a swashbuckling leader tasked with uncovering the source of this crisis and saving his kind. The narrative promises to be filled with humor, heart, and the quirky charm that's become a hallmark of the SteamWorld series. Whether you're a seasoned SteamWorld veteran or a newcomer to the franchise, SteamWorld Heist 2's story has the potential to captivate and entertain. Setting Sail on the Interactive High Seas: Unveiling the New Ship Exploration System Another exciting addition to SteamWorld Heist 2 is the introduction of a new interactive world map. This map will serve as your hub for exploration, allowing you to navigate the vast ocean, chart your course, and uncover hidden secrets. More importantly, the map will be the stage for thrilling ship-to-ship battles. Imagine strategically maneuvering your vessel, unleashing a barrage of cannon fire, and boarding enemy ships in real-time skirmishes. This dynamic addition to the gameplay promises to add a whole new layer of excitement and challenge to the SteamWorld Heist 2 experience. FAQs: Q: What platforms will SteamWorld Heist 2 be available on? A: SteamWorld Heist 2 is set to release on PC, PlayStation 5, PS4, Xbox Series, Xbox One, and Nintendo Switch. Q: What can players expect from the gameplay of SteamWorld Heist 2? A: Players can look forward to strategic turn-based gameplay, innovative mechanics, deeper storytelling, and enhanced customization options. Q: When is the release date for SteamWorld Heist 2? A: SteamWorld Heist 2 is scheduled to launch on August 8, 2024. Q: What inspired the setting of SteamWorld Heist 2? A: The setting of SteamWorld Heist 2 draws inspiration from the vibrant locales of the Caribbean, promising players an immersive and exotic experience. Q: Will SteamWorld Heist 2 feature multiplayer options? A: While specific details about multiplayer features have not been disclosed, Thunderful may reveal more information closer to the release date.
#crewcustomization#interactivemap#newmechanics#nintendoswitch#PC#pirates#playstation5#PS4#releasedate#shiptoshipbattles#steampunk#SteamWorldHeist2#SteamWorldHeist2SetsSail#story#turnbasedstrategy#XboxOne#XboxSeriesXS
0 notes
Text
Map Smart: Solve Real-World Challenges with Free GIS Tools for Students & Researchers

In today’s data-driven world, free GIS mapping tools empower students and researchers to visualize, analyze, and solve spatial problems with confidence. Using online platforms, geographic data becomes a dynamic resource for educational planning, strategic development, and community-based research.
Why Use GIS to Plan Real-World Infrastructure Like Hospitals? Understanding both spatial access and service gaps is essential in planning hospitals, especially in underserved or high-density regions. GIS tools simplify complex decisions and help users explore key questions like:
Which areas lack access to nearby healthcare facilities?
What’s the travel time for patients during emergencies?
Which zones meet criteria for safety, accessibility, and land use?
By layering data (roads, population, terrain, land use) and applying tools like buffers, isochrones, and clip operations, planners can make smart, data-backed site choices.
Key Benefits of GIS Mapping in Education and Research 🔍 Spatial Awareness – Understand how geography influences access to healthcare. 📊 Data Analysis Skills – Work with real datasets to uncover service gaps. 🌍 Cross-Disciplinary Learning – Apply GIS across public health, planning, and urban studies. 🛠️ Practical Tools – Use no-code features like buffer zones and travel-time maps. 📚 Applied Research – Simulate hospital planning scenarios to guide real decisions.
How to Create a Smart Mapping Project
Start a new story and load the GIS data layers: “Transportation: airport,” “Land Use: land,” and “Industrial: warehouse.” Choose your area of interest by navigating from country to state to district. Use the Buffer Tool under the process data menu to create 5 km zones around airports, labeling them as “Airport Proximity Zones.” Next, apply the Isochrone Tool under the process data to highlight regions accessible within 60 minutes via the road network and name them “Travel Zones.” Then, use the Clip Tool under the process data to identify areas where these two zones intersect and save the output as “Overlapped Zones.” Within these zones, select 5 warehouse locations using the Add Points feature, and include attributes like name, area (in sq. ft.), an image, and the measured distance to the nearest airport using the Measure Tool. Customize each point with appropriate icons and labels. Finally, publish and share your completed interactive map for use in education or research.

Open Tools, Real Applications Free GIS platforms like MAPOG bring professional-level tools to students, educators, and civic planners. With drag-and-drop layers and visual editing, they’re ideal for:
Public healthcare facility planning
Emergency service accessibility analysis
Civic tech and classroom use
Group-based student research
Educational Impact and Use Case This kind of mapping activity brings theory to life. Students build:
Real-world spatial thinking and planning skills
Familiarity with GIS tools used in healthcare services
Portfolio-worthy projects in applied research
GIS becomes a powerful connector across domains from public health and geography to urban planning and social impact.
Conclusion Free GIS tools transform complex public health planning problems like selecting new hospital sites into clear, data-informed strategies. By integrating layered data with spatial tools and practical workflows, students and researchers can tackle urgent, real-world questions with purpose.
🌐 Ready to plan smarter? Try a GIS platform for your research project and start building your hospital site selection project today.
#GISMapping#EducationTools#DataVisualization#FreeGIS#MAPOG#UrbanPlanning#StudentProjects#InteractiveMaps#GeospatialTech#EdTech
0 notes
Text
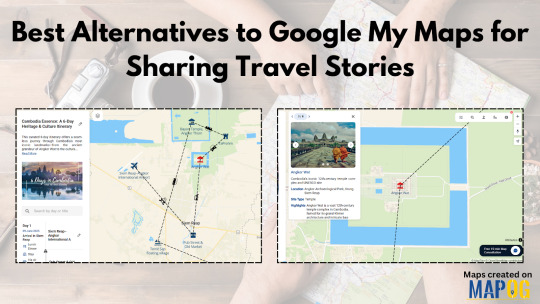
Best Alternatives to Google My Maps for Sharing Travel Stories
For many travelers, documenting and sharing itineraries visually has become just as important as the journey itself. But with Google My Maps reaching its limits in terms of customizability and collaboration, users are increasingly searching for more flexible, GIS-powered alternatives. The challenge is clear: how can one create rich, day-by-day travel narratives that are both interactive and informative without being restricted by basic plotting tools? That’s where modern story mapping solutions come in.
Why Traditional Mapping Tools Fall Short
Google My Maps is simple, but that simplicity can also be a limitation. When planning multi-day international trips like a week in any place, users often want more than just pins. They want to plot detailed locations, organize travel days, upload photos, write personal notes, and even collaborate with others—all without cluttering the map. Tools that rely purely on basic markers and labels can't deliver the depth required for serious travel storytelling.
GIS in Travel Storytelling
Geographic Information Systems (GIS) bring depth and structure to map-based storytelling. Unlike static maps, GIS-powered platforms allow travelers to create layered narratives by combining spatial data with multimedia elements. From tourism boards creating national heritage trails to travel bloggers curating personalized city walks, GIS has revolutionized the way stories are told through location. Not only does it enhance visualization, but it also allows a more organized, attribute-rich approach to storytelling.
Industries like ecotourism, cultural preservation, travel journalism, and local tourism boards are already embracing GIS to create immersive, shareable travel content. When paired with tools that support real-time collaboration, role-based access, and custom attributes (like accommodation type or transport mode), GIS becomes a storytelling engine, not just a map.
What Makes a Modern Story Mapping Tool Stand Out?
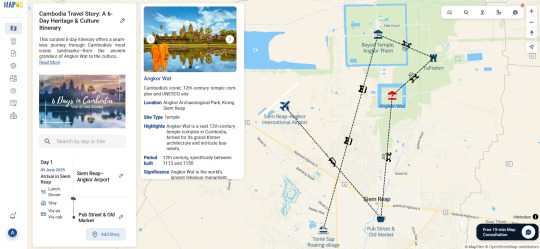
Imagine planning a Cambodia itinerary where each day is mapped with purpose. You begin by manually searching for addresses, dropping custom markers for landmarks like Angkor Wat, Phnom Penh markets, or Kampot’s riverside. You label them with titles like "Day 2 - Sunrise at Angkor," add brief descriptions, images from your camera roll, and even tag them with categories like "food stop" or "hiking trail."
Now imagine being able to preview the entire map as a story, share it through a private link, embed it in a blog, or even collaborate with a friend as a contributor or editor. That level of freedom isn’t science fiction anymore. Some platforms are quietly enabling exactly this kind of intuitive travel storytelling.

A Platform Worth Exploring
One such platform worth checking out is MAPOG. It allows users to plot travel journeys day-by-day, attach images and descriptions, and assign custom attributes that help you track every detail—from hotel check-ins to scenic routes. For bloggers and teams, the ability to share editable versions or simply allow viewers to explore your story map makes it a well-rounded alternative to Google My Maps. Though not mentioned often, it’s quietly making travel mapping far more intuitive.
In short, as the need for immersive travel sharing grows, switching to a more GIS-centered, customizable, and story-first platform can turn your trip into something not just remembered, but experienced by others.
0 notes
Text
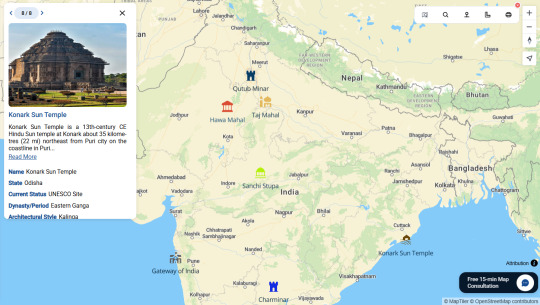
Mapping India's Heritage: Visualizing Monuments with Interactive Story Maps
India’s heritage isn't just about monuments—it's about the stories they hold, the cultures they represent, and the histories they embody. While traditional lists or brochures provide basic information, they often lack the depth and context that bring monuments truly to life. This is where interactive story maps come into play, transforming how we explore and understand cultural heritage.

Why Interactive Monument Mapping Matters
Interactive monument maps created through platforms like MAPOG visually communicate heritage data, turning static points into vibrant narratives. By plotting monuments geographically and enriching each site with images, histories, and architectural details, stakeholders—from travelers to historians—can easily explore regional patterns and cultural insights. These maps reveal not just where monuments are located, but why they matter.
The Limitations of Traditional Heritage Documentation
Standard methods like text-based documents or simple listings miss critical geographic and contextual details. They fail to capture how monuments relate to their surroundings, historical eras, or architectural styles. Interactive mapping bridges this gap, offering dynamic insights that traditional documents simply can’t deliver.
Benefits Across Different Stakeholders
Story maps of monuments offer significant advantages:
Tourism Professionals: Visualize heritage routes and plan engaging travel itineraries.
Educators and Students: Create immersive, interactive learning experiences that contextualize history.
Conservationists and Researchers: Highlight at-risk monuments and prioritize preservation efforts.
Content Creators and Bloggers: Embed rich, interactive maps to enhance storytelling and user engagement.
From Visual Narratives to Cultural Action
Interactive monument mapping doesn’t just visualize data—it inspires action. Clear, accessible maps help communities, tourists, educators, and policymakers better appreciate and advocate for cultural heritage.
True appreciation and conservation of India's monuments start by understanding their stories in context—and there's no better storyteller than a well-crafted interactive map.
1 note
·
View note
Text
Enhance Your Travel Experience with Wanderboat AI
Wanderboat AI is a revolutionary platform that uses artificial intelligence to enhance the way you plan and explore your travels. From personalized itineraries and tailored recommendations to real-time updates and seamless bookings, Wanderboat AI has everything you need to make your travel experiences unforgettable.
Core Functionality: Wanderboat AI offers personalized travel planning and real-time updates, ensuring that users enjoy a stress-free, customized travel experience from start to finish.
Key Features:
Personalized Itineraries: Generate custom travel plans based on your preferences, interests, and budget.
AI-Powered Recommendations: Receive tailored suggestions for destinations, activities, accommodations, and dining options.
Real-Time Updates: Stay informed with live updates on weather, local events, and travel advisories.
Interactive Maps: Use detailed maps to navigate your travel destinations with ease.
Booking Integration: Book flights, hotels, and activities directly through the platform without the hassle.
Travel Budget Management: Manage your expenses with budgeting tools and cost tracking.
Community Insights: Leverage insights and reviews from other travelers to enrich your experience.
Multi-Language Support: Access the platform in multiple languages, making it accessible to travelers worldwide.
Benefits:
Enhanced Travel Experience: Personalized itineraries and recommendations create an enjoyable and tailored experience.
Time-Saving: Comprehensive travel plans and easy booking options save time and effort.
Informed Decisions: Real-time updates and community reviews help users make well-informed travel choices.
Cost-Effective: Budget management tools help you find the best deals and manage expenses efficiently.
Convenient Navigation: Interactive maps make exploring new destinations a breeze.
Global Accessibility: Multi-language support caters to travelers from all regions.
Stress-Free Planning: Integrates every aspect of travel into one platform, simplifying the entire planning process.
Ready to transform the way you travel? Try Wanderboat AI today and plan your perfect getaway effortlessly!
#WanderboatAI#TravelPlanning#AITravel#PersonalizedItineraries#TravelTech#InteractiveMaps#TravelRecommendations#BookingIntegration#StressFreeTravel#ExploreMore
0 notes
Text
Building Your Dream Blog with WordPress Themes:

WordPress themes like Ashe and Travelify, your partners in wanderlust-fueled storytelling. Imagine your breathtaking travel photography taking center stage in elegant galleries, each image whispering tales of sun-drenched beaches and ancient ruins. Interactive maps become your canvas, plotting your course and inviting readers to virtually embark on your expeditions.
0 notes
Video
youtube
Elementor Tutorial: Designing a Full-Width Google Map with Hover Animation
In today's Elementor video, we're going to show you how to create an awesome live Google Map. We'll make the map full-width and add hover effects for user interaction. Having a live Google Map adds interest and helps customers find you easily. It's simple using the Elementor Google Map widget. At the end, we'll show you how to code it and reverse colors for a night mode. Elementor also offers filters to match your website's styling. Follow along to create a full-width live Google Map for your Elementor website!
Unlock the potential of your website with Elementor, the ultimate page builder. In this video series, we delve into the numerous benefits of using Elementor for your web design projects. From its intuitive drag-and-drop interface to its extensive library of customizable widgets, Elementor empowers you to create stunning, professional-looking websites with ease. Say goodbye to tedious coding and hello to seamless design freedom with Elementor. Join us as we explore the key advantages of this powerful tool and learn how it can revolutionize your web development process. Whether you're a seasoned web designer or a beginner, Elementor is the perfect solution for bringing your creative visions to life.
#youtube#ElementorTutorial FullWidthMap HoverAnimation WebDesign GoogleMapWidget ElementorDesign WebsiteDevelopment InteractiveMap ElementorPlugin Ma
0 notes
Photo

original url http://www.geocities.com/interactivemapping/ last modified 2008-09-12 15:29:44
5 notes
·
View notes
Photo

🔍 Level Up Your Adventures in RuneScape: Dragonwilds! 🌟 Ready to explore Ashenfall like never before? IGN's new interactive map for RuneScape: Dragonwilds is your ultimate guide! Whether you're diving into quests or tracking rare resources, this map has it all. 🗺️ **Interactive Map Features:** - Track quests and collectibles to master your journey. - Find resources like Anima-Infused Bark and Blightwood Root. - Locate Chests, NPCs, and Crafting Materials easily. **Maximize** your gameplay with this essential tool! Visit the map to match every quest step and resource location seamlessly. 🎮 Got your own tips or discoveries? Share them with our community! How do _you_ plan to conquer Ashenfall? Let us know! ⬇️ #RuneScapeDragonwilds #InteractiveMap #GamingTools #AshenfallAdventures #Quests #GameGuides #ResourceHunting #MMO #FantasyGaming #IGN #PlayerTips
0 notes
Text
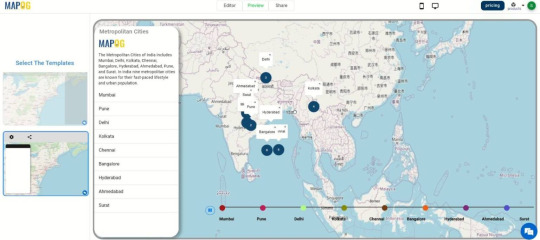
Exploring India’s Metropolitan Cities: MapStories
Introduction
Welcome to our interactive journey through India’s Metropolitan Cities using MapStory! Our goal is to create an engaging, detailed map that highlights the unique stories of India’s major urban centers. We will be exploring cities like Mumbai, Delhi, Bangalore, Chennai, and Kolkata, uncovering their rich cultures, fascinating histories, and dynamic landscapes. With story by MAPOG, we're not just mapping these cities; we're delving into the narratives that make each one special. From bustling markets and iconic landmarks to historical events and cultural traditions, our interactive map will bring the essence of these cities to life.
Tool Used: MapStory
Story by MAPOG is our companion in this exploration. It’s more than just a mapping tool; it’s a platform that blends maps with storytelling. It helps us create interactive narratives that bring to life the essence of India’s metropolitan cities.
How MapStory is Helpful
MapStory allows us to:
Visualize Data: Integrate various data sets to create dynamic maps that reveal cultural diversity, historical landmarks, and urban development.
Engage Audiences: Through storytelling, connect people with the cities, making history and culture more accessible and compelling.
Add Multimedia Elements: Incorporate photos to enrich the storytelling experience and provide a deeper understanding of each city’s unique attributes.
Interactive Features: Users can interact with the map, clicking on different points to learn more about specific locations, events, and cultural highlights.
Customizable Stories: Tailor the appearance and content of each story to fit specific themes and objectives, ensuring that each map is unique and relevant.
Domains That Can Benefit
Story by MAPOG is versatile and can be applied across various domains. Whether it's urban planning, tourism, real estate, environmental studies, transportation, education, cultural preservation, or economic development, MapStory provides valuable insights and engaging content. Its interactive and customizable features make it a powerful tool for professionals, educators, students, and anyone interested in exploring and understanding the dynamic aspects of urban environments.
Conclusion
Exploring India’s metropolitan cities through Story by MAPOG offers a captivating way to understand their dynamic nature and historical roots. By combining mapping with storytelling, MapStory enriches our connection to these cities, making it an invaluable tool across various industries. For more information or to start your own MapStory journey, visit MAPOG or contact [email protected].
#InteractiveMaps#MapStory#IndiaMetropolitanCities#UrbanExploration#Mumbai#Delhi#Bangalore#Chennai#Kolkata#CulturalMapping#HistoricalNarratives#DynamicLandscapes#GeospatialStorytelling#MAPOG#CityStories#UrbanCulture#MappingHistory#EngagingMaps#DataVisualization#MultimediaMapping#UrbanPlanning#Tourism#RealEstate#EnvironmentalStudies#Transportation#Education#CulturalPreservation#EconomicDevelopment#ExploreIndia
1 note
·
View note
Text
Discover the diverse landscapes of America with interactive maps! #ExploreAmerica #InteractiveMaps https://mapsius.com/
0 notes
Text
Top Heritage Spots on a Map: A Country-Wise UNESCO Guide

UNESCO World Heritage Sites represent the highest achievements of cultural excellence and natural beauty around the world. Mapping these sites by country provides valuable insights into global heritage while promoting responsible tourism, increasing public awareness, and supporting conservation efforts. The integration of GIS technology with heritage data creates an engaging and educational experience, allowing users to explore these remarkable places through immersive storytelling.
Why Use GIS to Map UNESCO World Heritage Sites?
UNESCO World Heritage Sites are recognized for their “outstanding universal value,” encompassing architectural, historical, and ecological importance. GIS transforms these static listings into interactive maps that connect people to heritage spatially and emotionally. This approach enriches education, preserves cultural continuity, and bolsters environmental resilience—critical amid growing modern challenges. By mapping UNESCO sites, users gain accessible knowledge and a deeper appreciation of our shared global legacy.
Key Benefits of UNESCO Heritage Site Mapping
Cultural Preservation: Protect ancient monuments and traditions that shape national identity and maintain links between past and present.
Environmental Protection: Safeguard vulnerable ecosystems and biodiversity, contributing to global climate resilience.
Education and Awareness: Provide dynamic educational tools emphasizing cultural and ecological significance.
Sustainable Tourism: Encourage responsible travel that supports local economies and conservation.
International Cooperation: Foster cross-border collaboration in research, funding, and protection strategies.
Scientific Research: Support interdisciplinary studies in history, ecology, architecture, and climate science.
How to Map UNESCO Sites Using GIS on MAPOG
Mapping UNESCO World Heritage Sites on MAPOG begins with selecting cultural, natural, or mixed sites from the official UNESCO list. Precise geographic coordinates and metadata such as country, inscription year, and site type are collected. Then, use the Create New Story button to launch a project titled “Top Heritage Spots on a Map: A Country-Wise UNESCO Guide.” Each site is added manually via Add Story under the “UNESCO Site” location type, including details like site type, nearest airport, and descriptions. The map is styled with color coding and labels for clarity. Finally, publish and share the interactive map to enable easy exploration and learning.

Use Case: Academic Research and Curriculum Development
This GIS-based map is an excellent resource for scholars, educators, and students engaged in cultural studies, environmental science, and geography. It provides a spatial framework for analyzing heritage distribution and promotes interdisciplinary learning. Educators can integrate the interactive map into curricula, enhancing lessons with real-world examples that foster critical thinking and global awareness among students.
Open-Source GIS Tools for Heritage Mapping
Platforms like MAPOG offer accessible, no-code platforms for heritage professionals, educators, and enthusiasts to build, style, and share interactive maps. These tools encourage collaboration, storytelling, and easy embedding on websites and educational platforms, making GIS mapping approachable for users of all skill levels and bringing global heritage closer to diverse audiences.
Conclusion
Mapping UNESCO World Heritage Sites with GIS transforms how people engage with cultural and natural wonders. These interactive maps invite users to explore history, ecology, and culture spatially, promoting preservation and appreciation. Beyond simple maps, they serve as bridges connecting communities to their shared heritage.
Ready to foster stewardship and celebrate global heritage? Create your interactive UNESCO map on MAPOG today—one site at a time.
#UNESCO#GISforEducation#CulturalPreservation#InteractiveMaps#GlobalHeritage#SustainableTourism#MAPOG#GeoStorytelling#EducationInnovation
1 note
·
View note
Text
Best GIS Tools for Analyzing Healthcare Services
Healthcare uses Geographic Information Systems to help professionals analyze spatial data that provides clear views of places and events. GIS technology helps healthcare professionals make better decisions by showing them disease tracking data and hospital planning choices. In this article, we explore some of the best GIS tools, including how certain features can transform healthcare analysis.

Key Features to Look for in GIS Tools for Healthcare
Data Visualization: You can detect trends by showing healthcare data together with environmental and population information on a map.
Customizable Maps: You can make custom maps that show hospital spots along with places residents live and transportation.
Interactivity: Interactive tools let stakeholder groups actively explore and use the available data.
Examples of Healthcare Applications
Mapping Disease Outbreaks: GIS technology lets us find disease outbreaks more quickly so we can start urgent treatment sooner.
Accessibility Analysis: Determine how well communities can reach healthcare services by finding areas with limited access.
Resource Allocation: GIS tools help show where healthcare resources are placed so everyone receives equal access to medical services.
How Specific GIS Tools Help in Healthcare
For problem solving cases in healthcare, There are several tools available, One such tool worth exploring is MAPOG, which provides several features ideal for healthcare mapping:
Interactive Story Maps: Healthcare services can be better explained to stakeholders once we arrange the needed visual layers about facilities, target audiences, and service areas through this tool. For example, mapping vaccination sites alongside population density can identify gaps.

Add on Map: By accessing MAPOG's vast dataset we can insert any needed map layers and begin working right away. For example, we can create a hospital map that shows transportation networks for accessibility analysis.
Feature Tools: Apply multiple feature tools including Isochrones, filter tool, Buffer Tool, Spatial join and others to perform your analysis. We can identify the at-risk hospitals through the buffer tool.

Base Map Options: Switch between satellite and road views to analyze terrain accessibility.
Why Use GIS for Healthcare?
GIS technology helps us see important details in difficult situations while making choices based on actual data. When disaster teams merge patient location data with hospital capacity maps they can direct their response operations better.
Conclusion
GIS apps turn medical information into clear visual maps that help healthcare professionals and their teams make better decisions. These advantages make professional healthcare decisions dependent upon reliable data analysis. When looking for GIS tools select products that let you work with ease and provide user-friendly interfaces. MAPOG helps professionals and everyone else easily make maps through its platform.
0 notes
Photo

Art Week Des Moines is still in full swing! The website has a handy map with all the events, color-coded by day -- each marker has some info about each event (location, time, description). Attend one and attend all events, it's worth it! . . . #artweekdsm2021 #map #interactivemap #desmoines #desmoinesartfestival #IowaCulture #IowaCreates #iacgrantee #iowaarts https://www.instagram.com/p/CQbHVsdDz1p/?utm_medium=tumblr
#artweekdsm2021#map#interactivemap#desmoines#desmoinesartfestival#iowaculture#iowacreates#iacgrantee#iowaarts
1 note
·
View note