#Visual data analysis
Explore tagged Tumblr posts
Visit Tumblr Blog
Explore Tumblr blogs with no restrictions, modern design and the best experience.
Last Seen Tumblr Blogs


Fun Fact
130K people were victims of a chain letter scam that affected Tumblr in May 2011.
Text
How Vision AI is Personalizing the Customer Experience
In today’s rapidly evolving digital landscape, customer experience has become a crucial differentiator for businesses. Traditional methods of personalization, such as targeted emails and tailored product recommendations, are now standard practice. However, the advent of Vision AI (Artificial Intelligence) is transforming how businesses interact with customers, offering unprecedented levels of personalization and engagement. Vision AI, which involves the use of machine learning and computer vision to interpret and understand visual data, is enabling businesses to create highly individualized experiences that cater to the unique preferences and behaviors of each customer.
Understanding Vision AI
Vision AI refers to technologies that enable machines to gain high-level understanding from digital images or videos. It encompasses various techniques such as image recognition, object detection, facial recognition, and scene interpretation. By mimicking human vision, Vision AI can analyze visual data in real time, making it a powerful tool for personalizing the customer experience across multiple industries.
Enhancing Retail Experiences
One of the most significant applications of Vision AI in retail is in creating immersive and personalized shopping experiences. Traditional retail has been revolutionized by e-commerce, but Vision AI is bridging the gap between online and offline shopping by offering enhanced customer experiences.
Personalized In-Store Assistance
Vision AI-powered cameras and sensors can track customer movements and behaviors in real time. By analyzing this data, stores can offer personalized assistance and recommendations. For instance, when a customer spends a significant amount of time in a particular section, Vision AI can alert store associates to offer help or suggest related products, enhancing the shopping experience.
Smart Mirrors and Virtual Try-Ons
Smart mirrors equipped with Vision AI allow customers to virtually try on clothes and accessories. These mirrors use augmented reality (AR) to overlay products onto the customer’s reflection, providing a personalized fitting experience without the need for physical trials. This technology not only improves customer satisfaction but also reduces return rates, as customers can make more informed purchasing decisions.
Customer Behavior Analysis
Vision AI can analyze customer behavior patterns to offer personalized promotions and discounts. By understanding which products customers frequently interact with or purchase, retailers can tailor their marketing strategies to individual preferences. This level of personalization can significantly boost customer loyalty and increase sales.

Revolutionizing Online Shopping
E-commerce platforms are leveraging Vision AI to provide highly personalized and engaging online shopping experiences. The ability to analyze visual content in real-time enables online retailers to understand and predict customer preferences more accurately than ever before.
Visual Search
Traditional text-based searches can sometimes be limiting for customers who are unsure how to describe what they are looking for. Vision AI enables visual search functionality, allowing customers to upload images of desired products and find similar items instantly. This feature not only enhances the user experience but also increases the likelihood of conversion by making the search process more intuitive and efficient.
Personalized Recommendations
Vision AI can analyze customers’ visual preferences based on their browsing history and interactions with images and videos. By understanding color preferences, style choices, and visual aesthetics, AI can offer highly personalized product recommendations. For example, if a customer frequently browses floral patterns, the AI can prioritize showing them products that match this preference.
Dynamic Content Customization
E-commerce platforms can use Vision AI to dynamically customize content for each user. By analyzing visual data and user behavior, websites can display personalized banners, advertisements, and product suggestions. This ensures that each customer has a unique and relevant shopping experience, increasing engagement and conversion rates.
Transforming Customer Service
Vision AI is also revolutionizing customer service by enabling more efficient and personalized interactions. The ability to analyze visual data in real-time can significantly enhance the quality of customer support and improve overall satisfaction.
Facial Recognition for Personalized Interactions
Facial recognition technology can identify customers and retrieve their purchase history, preferences, and previous interactions with the brand. This allows customer service representatives to offer highly personalized assistance, addressing the customer by name and providing relevant information quickly. Such personalized interactions can enhance the customer’s perception of the brand and foster loyalty.
Visual Customer Support
Vision AI can be used to provide visual customer support, enabling customers to share images or videos of issues they are facing. Support agents can then analyze this visual data to diagnose problems and offer precise solutions. For example, if a customer is having trouble assembling a product, they can share a video of the issue, and the AI can guide them through the steps to resolve it. This reduces resolution times and improves the overall customer experience.
Automated Support with Visual Data
Chatbots and virtual assistants equipped with Vision AI can handle customer queries that involve visual data. For instance, customers can upload images of damaged products, and the AI can assess the damage and process returns or replacements automatically. This level of automation streamlines customer service processes and ensures quick and efficient resolutions.
Elevating the Entertainment Industry
The entertainment industry is another sector where Vision AI is making significant strides in personalizing the customer experience. By analyzing visual data from videos and images, AI can offer tailored content recommendations and enhance user engagement.
Personalized Content Recommendations
Streaming platforms use Vision AI to analyze viewers’ watching habits and preferences. By understanding the visual elements that resonate with each user, such as genre, actors, and cinematography, AI can recommend personalized content. This not only enhances the viewing experience but also keeps users engaged by continuously offering relevant and appealing suggestions.
Interactive and Immersive Experiences
Vision AI is also enabling more interactive and immersive experiences in entertainment. For example, augmented reality (AR) and virtual reality (VR) applications use computer vision to create personalized and engaging experiences. Users can interact with virtual environments tailored to their preferences, making entertainment more immersive and enjoyable.
Enhancing Social Media Engagement
Social media platforms leverage Vision AI to analyze user-generated content and interactions. By understanding the visual preferences and behaviors of users, these platforms can personalize content feeds, advertisements, and recommendations. This ensures that users see content that is most relevant and engaging to them, enhancing their overall experience on the platform.
Improving Healthcare Services
In the healthcare sector, Vision AI is transforming patient care by offering personalized medical services and improving diagnostic accuracy. The ability to analyze visual data in real-time is enabling healthcare providers to deliver more precise and tailored treatments.
Personalized Treatment Plans
Vision AI can analyze medical images such as X-rays, MRIs, and CT scans to identify specific conditions and recommend personalized treatment plans. By comparing visual data from numerous patients, AI can identify patterns and suggest the most effective treatments for individual patients. This level of personalization can significantly improve patient outcomes.
Remote Patient Monitoring
Vision AI is also enhancing remote patient monitoring by analyzing visual data from wearable devices and home monitoring systems. This technology can detect changes in a patient’s condition in real-time and alert healthcare providers to take immediate action. Personalized alerts and recommendations ensure that patients receive timely and appropriate care, even from a distance.
Enhancing Telemedicine
Telemedicine services are benefiting from Vision AI’s ability to analyze visual data during virtual consultations. Doctors can use AI-powered tools to examine patients remotely, ensuring accurate diagnoses and personalized treatment recommendations. This improves the quality of care and makes healthcare more accessible to a broader population.
Conclusion
Vision AI is revolutionizing the way businesses personalize the customer experience across various industries. By leveraging the power of visual data, companies can create highly individualized and engaging interactions that cater to the unique preferences and behaviors of each customer. From retail and e-commerce to customer service, entertainment, and healthcare, Vision AI is enabling businesses to offer more relevant, efficient, and satisfying experiences. As this technology continues to evolve, its potential to transform the customer experience and drive business success will only grow, making it an essential tool for any forward-thinking organization.
Source: https://inferencelabs.blogspot.com/2024/06/how-vision-ai-personalizing-customer-experience.html
#Compute Vision#Customer experience#Inference Labs#Vision AI#Vision AI technology#Visual data analysis#Visual search
0 notes
Text
Presenting the results of my latest hyperfixation
Tam Lin is a Scottish folktale, usually presented in ballad form, dating back to at least the 16th Century. It has been summarized and re-told by different people over the years, including Overly Sarcastic Productions. It is the subject of a one-act opera, and was the inspiration for a 1970 movie that updated the story to the present day.

The fairy queen yells at Tam Lin in every version analyzed except for the Anais Mitchell version. Her version is an outlier in many respects, since the entire parade is left out, Janet simply grabs hold of Tam Lin mid-conversation.
Another oddity is Pentangle's version, which was written for the movie and consists of a jumble of images meant to complement scenes from the film, without a coherent narrative.
The biggest surprise to me is how few versions mention Janet seeking an abortion, something that I had always thought of as a central part of the story.
One thing I wish I could have looked at in more depth is the balance between versions that describe Tam Lin's transformations before he goes through them, and versions that describe them as they happen. As they happen is more common, but some songs will do the entire sequence twice.


Going into this, I had two versions prominent in my mind: Anais Mitchell's pop-folk version that leaves out much of the story, and Anne Briggs' very traditional (and very long) version. Because of this, I thought perhaps we would see a decrease in the complexity of the story over the years, but that's not the case, it's basically flat. I think a better comparison might be to separate into traditional and revised versions, although that is something of a judgment call.

There were so many minor discrepancies I couldn't even keep track of them all, but these four stood out because they are so oddly specific. Even the main character's name and the setting aren't consistent across versions, if they're even mentioned at all. Some versions don't even give the main character a name!
My data collection process leaves a lot to be desired, as well as the way in which I decided which events were major or minor, and which things to leave out altogether. This was mainly just a fun way to explore different versions of my favorite folktale, listen to a lot of different people sing different versions of the ballad, and rotate the whole thing in my brain.
280 notes
·
View notes
Text
About Reblog Graphs
Have you ever clicked on the "reblog graph" button of a post? I think they're one of the... well, maybe not greatest features on tumblr ever (polls are probably better), but they're still pretty darn neat.

I want to show some cool patterns I noticed on some recent posts of mine, but first I'll explain how reblog graphs work so you can more easily follow along.
This is pretty long with a bunch of pictures, so click the cut to read more.
How reblog graphs work
If you've never done so before, I invite you to click the notes button on this or any other post and then the icon with four circles. You will then see a bunch of dots connected by lines.
For example, if you click the graph for the "blorbo in Elvish" post, you get something like this:

Now, let's zoom in a bit. You can do this by using the mouse wheel and clicking and dragging around the graph until it's showing what you want. (I don't know how it works on mobile, but presumably it's similar to using Google maps?)
This next screenshot is the bit in the lower right of the graph shown above. However, the graph may not always display in the same way because reblog graphs are re-generated each time you click the "reblog graph" button.
Here you can see that I'm viewing the root post, which is the original post made by me. It's indicated by a circle with a dot inside. You can also see that six people reblogged that post. Each reblog shows as a dot with a line connecting it to the post it was reblogged from.

Now here's a cool thing about reblog graphs: they're interactive! You can click on any dot and see the post it represents and the reblog chain that led to it.
For example, clicking this dot that has several lines emanating out from it shows that it is "2 reblogs deep" and was posted by @cycas.

Got it? Close enough? Cool, now let me show you some neat things I noticed. :D
The Swedish Chef poll and very popular bloggers
My polls tend to average between 500 and 2000 votes, depending on subject matter. The Swedish Chef poll, however, took off and eventually garnered over 22,000 votes. How did that happen? A very popular blog reblogged it about five days in.
Initially, the graph looked like this. (This is the first 200 reblogs.) There's nothing unusual here. You can see that the root post had several reblogs, and that there's another cluster developing around a post by @zagreus. There are also several reblog chains where just one person reblogs someone else's reblog. Some of these chains peter out, while others find their way onto the dash of more popular bloggers, creating clusters.

A quick note about "popularity"
Yes, yes, it's all about "popular." However, it's not just about having a bunch of followers. What's more important is that the "popular" person reblogging your post has followers who are specifically interested in your post.
For instance, if I, @sillylotrpolls, make a poll about LazyTown, it's probably not going to get very many reblogs because my followers aren't here for that. However, if @silly-lazytown-polls reblogs the poll, that reblog might then get quite a lot of reblogs itself. It's not that silly-lazytown-polls has more followers than sillylotrpolls, it's that it has more followers specifically interested in LazyTown content. Make sense?
Back to the Swedish Chef poll
The poll eventually got over 5,000 reblogs. Since you can only add 200 reblogs to the graph at a time, you can roughly see how a post spread over time.
With 600 reblogs loaded, a new cluster bursts onto the scene. This is @bunjywunjy, who reblogged the post from @beecreeper who reblogged it from @soggypotatoes who reblogged the original.
Bunjywunjy didn't add any tags or comments, so I didn't even notice at first because it didn't show in my activity feed. However, I did notice a sudden uptick in notes on the post, which caused me to investigate. It had been five days since I posted the poll, and usually polls that are going to take off do so sooner than that.

By continuing to click the "load more reblogs" button I can see how the post further spread, especially from bunjywunjy's post.
When the post reached @beggars-opera (whose icon I am somewhat proud to announce I identified on sight), they added a screenshot of @stylishanachronism 's tags which said:
# all of these are incorrect it's the 'meat's back on the menu boys!' scene
This would become the dominant version of the post as it further spread. Interestingly, this was the only reblog of stylishanachronism's reblog. Literally thousands of people loved their tags and agreed with them, but they quite plausibly never saw it unless they specifically went looking.
By 3,200 reblogs, you can see even bigger clusters developing. @thebibliosphere shows up 10 reblogs deep, and leads to yet another cluster via @teaboot (12 reblogs deep).

Eventually, with all 5,371 reblogs loaded, the reblog graph looks like this:

Like I said: neat. :D
Cool, but if you've seen one, you've seen them all - right?
So what prompted this (extremely long) post was actually the reblog graph for my poll on inspirational LotR quotes.
Here's the reblog graph with 200 reblogs loaded:

And here's the graph with all 1,890 reblogs loaded:

It's just one big cluster around the root post. I've never seen that before!! Almost everyone reblogging this post saw it either because they follow this blog, saw it in the #lotr tags, or because their non-influencer friend reblogged it. (Or maybe it was in some kind of algorithm/the explore feed, but I have nearly zero experience with those.)
And this wasn't just a small post. This poll got over 15,000 votes and more than 4,000 notes. That puts it in the top 10 polls for this blog.
What does it mean? I have no idea. I would really like to know! But really, I got nothing. If you have a theory for why this particular poll should result in a reblog graph like this, I would very much like to hear it.
Orphan clusters
To round things off, I'd like to show another interesting facet of reblog graphs: orphan clusters.
This blog's current undisputed poll champion is the fmk wheel poll. That's not really a surprise, as it combined sex with a fun game where you just had to tell everyone what you got, which meant either a reply or a reblog. So it spread pretty far.
However, if you look at the graph, there's something odd going on.
This is with just 200 reblogs loaded:

Notice how some of the dots don't connect to the root post? That's because somewhere along the chain, a reblog was deleted.
This cluster in the bottom left got pretty big! This screenshot is at 800 reblogs loaded. The missing link is from a blog called @gendertaliban that doesn't exist anymore, as near as I can tell. That makes it impossible to trace the full path of any of these reblogs.

In conclusion
This concludes today's deep dive into a tumblr feature you probably never paid any attention to. Admittedly, there's not a huge use for it outside of determining which of your mutuals is an "influencer," and they get quite difficult to navigate after loading about 1000 reblogs, but I hope you enjoyed staring at dots and lines with me. :)
#data analysis#tumblr#reblog graphs#data visualization#not a poll#admin#yes I KNOW I keep saying I'm going to come up with a proper 'misc' tag#there will come a day when I properly categorize and tag my 'admin' posts#today is not that day
51 notes
·
View notes
Text

A map of every single band on the Metal Archives as of March 1st of this year, using the same dataset I used for this site. Each individual dot represents a single band, and each line indicates that two bands have a member in common.

A closeup, showing the lines in a bit more detail.
There are around 177k bands on the Metal Archives, and, of them, about two-thirds can be connected to one another by common members.
#metal#metalarchives#data visualization#social networks#heavy metal#fun fact if you make a graph with 177 thousand nodes the graph visualization software will shit itself and die#so if I wanna visualize any sort of analysis I'm probably gonna need to figure out how I can pare this whole mess down#but I think this kinda looks cool
17 notes
·
View notes
Note
can I ask what ur summer research was about?!!! :0 (u absolutely don't have to answer if ur not comfortable, I'm just a giant nerd and loves to hear about research dhdnfjdmdjfng)
Of course!!! I’d be glad to talk about it!!

In short, my research over the summer was putting mice in mazes and looking at how well they remember mazes, how quickly they learn the maze, and how learning one maze can help them learn other mazes faster. More detailed under the read more!
Previous maze studies with mice have shown that mice can actually learn very quickly when they’re learning behaviors that are in line with their own evolutionary advantages rather than arbitrary associations. It’s the difference between telling a mouse “go around these tunnels and try to find water to survive” vs telling it “do these very specific and completely useless 5 things and then you’ll get water”. Maze navigation for mice is already a natural complex behavior: mice are burrowing rodents and already have the predisposition for running around tunnels. We set up a maze and cameras and infrared lights around it to record it doing its thing, so that we can look at its natural behaviors with no human interference.
The unique thing about this project is less the behavior and rapid learning of the mouse and more the maze that we use for the study, called the Manhattan Maze. I think my mentor created it but I’m not too certain? But the basic concept of it, as shown in the figure above, is that there are two boxes of parallel tunnels and one layer of acrylic in the middle. Through holes in the acrylic, the mouse can climb between the two layers and make a “turn”. Essentially, this maze is the most reconfigurable setup for studying mouse behavior in mazes possible, because the middle layer of acrylic, which we call a mask, can be changed 2^(n^2) ways (n being the number of channels in a layer) to make completely different mazes. For the figure above, a 4x4 Manhattan maze, we have 2^16 possible different configurations, but we were actually running it on an 11x11 maze, so there were 2^121 different possible configurations! This way, we can look at the mouse in tons of different mazes without actually having to make a new maze altogether and transfer the mouse every time.
And they learn extremely fast! The mazes we used were pretty much linear paths with small dead ends that weren’t far off from the main path, and required 9 turning decisions to get from starting point to end point. There were 3 of these different masks, and after training for one day on one of them, the next day, almost all mice that completed the training managed to learn completely new 9-decision masks in 3 hours or less!
#I was kind of a menial work goblin over the summer lmao which was to be expected#I am an undergrad after all#but yeah most of my work entailed cleaning up after the mice and putting the mice in the mazes and taking them out at the end of the day#and then bits of data processing to make the data usable for analysis later#but yeah very interesting stuf!!#it’s a bit of a departure from what I did last year which was eye tracking to study implicit visual processing#but I think working with animals in a psychology lab setting was a very good experience#also the mice were very cute.#I enjoyed them a lot#you hold them by the base of the tail to not harm them and they’re kind of disgruntled about it
85 notes
·
View notes
Text
Coursera - Data Analysis and Interpretation Specialization
I have chosen Mars Craters for my research dataset! Research question: How Do Crater Size and Depth Influence Ejecta Morphology in Mars Crater Data?
Topic 2: How Do Crater Size and Depth Influence Ejecta Morphology and the Number of Ejecta Layers in Martian Impact Craters?
Abstract of the study:
Ejecta morphology offers a window into the impact processes and surface properties of planetary bodies. This study leverages a high-resolution Mars crater dataset comprising over 44,000 entries among 380k entries with classified ejecta morphologies, focusing on how crater diameter and depth influence ejecta type. Crater size and rim-to-floor depth are examined whether they serve as reliable predictors of ejecta morphology complexity. Using statistical methods, we assess the relationship between crater dimensions and the occurrence of specific ejecta morphologies and number of layers.
Research Papers Referred:
Nadine G. Barlow., "Martian impact crater ejecta morphologies as indicators of the distribution of subsurface volatiles"
R. H. Hoover1 , S. J. Robbins , N. E. Putzig, J. D. Riggs, and B. M. Hynek. "Insight Into Formation Processes of Layered Ejecta Craters onMars From Thermophysical Observations"
2 notes
·
View notes
Text
For anyone currently in school or recently in school

I am doing a few guest lectures at some of the universities in my state and working on my presentation. Curious if anyone has any recommendations of topics they really enjoyed from a past guest speaker that isn't major/field-specific?
#college#college student#studying#studyblr#school#university#accounting#finance#consulting#data analytics#data analysis#data visualization#big data#data
22 notes
·
View notes
Text
Online Data Science Courses
IIM Skills offers a variety of online data science courses designed to develop essential skills for the field. The course cover various topics statistics, machine learning, data visualization, and Python programming. The courses is designed in such a manner that a learner gets a theoretical knowledge and also a practical applications, often including hands-on projects. IIM Skills also emphasizes career support and mentorship, making it a suitable choice for both beginners and those looking to enhance their data science expertise.
2 notes
·
View notes
Text
From Zero to Hero: Mastering Data Analytics for Transformation
The concept of "data" has enormous significance in the modern digital world. The enormous amount of information produced every day has revolutionized the way we view the world and move through it. The data analytics industry is one of the major players in this revolution. Let's set out on an adventure to discover the fundamentals of data analytics, consider their importance, and understand how they affect different facets of our lives.
Understanding Data Analytics Analyzing massive data sets to find hidden patterns, correlations, trends, and insights is at the heart of data analytics. It's like sorting through a gold mine of knowledge to find the gold nuggets that will help you make decisions and solve problems. Data analytics isn't just about statistics and figures; it's about turning raw data into compelling narratives that encourage informed decisions.
Why Data Analysis Is Important
The capacity to make sense of all the data in the globe has changed the game. Data analytics enables companies, groups, and people to comprehend their operations, clients, and environments more thoroughly. Here are a few main arguments in favor of data analytics:
Making Informed Decisions: Data-driven insights allow for more precise and knowledgeable decision-making. Companies might modify their tactics in light of current developments and customer preferences.
Enhanced Efficiency: Data analytics uncovers bottlenecks and inefficiencies in processes and operations, allowing for focused changes.
Predictive Skills: By analyzing past data, predictive models can predict future patterns and aid organizations in becoming ready for the future.
Customer insights: Data analytics reveals the preferences and habits of customers, enabling more individualized interactions and higher levels of customer satisfaction.
Risk Management: Identifying potential risks and fraud patterns is made easier with data analytics, reducing vulnerabilities and losses.
Scientific Discoveries: In fields like healthcare and research, data analytics aids in uncovering groundbreaking insights and advancements.
The Data Analytics Process

Data analytics involves a systematic approach that follows several key steps:
Defining Objectives: Clearly state the objectives and issues you hope to resolve through data analysis.
Data Collection: Collect pertinent data from a variety of sources, making sure it is reliable and representative. Data Cleaning: Involves altering it to ensure accurate analysis.
Exploratory Analysis: Investigate the data in depth to find patterns, trends, and early insights.
Modeling: Building statistical models or algorithms to forecast outcomes or comprehend correlations in the data is known as modeling.
Interpretation: Draw conclusions from your analysis's findings and connect them to your original goals.
Visualization: To make your findings easier to understand, present them using visual tools like charts, graphs, and dashboards.
Action: Implement the learnings from data analysis to inspire positive changes and actions.
Data analytics has become an effective means for turning data into useful insights. By bridging the gap between information overload and useful knowledge, it facilitates decision-making, ignites innovation, and opens doors. A fascinating and fruitful trip may be had by anyone interested in learning more about data analytics, whether they are a business owner, researcher, or just curious. So, take part in uncovering the secrets of the data and grasp the power of data analytics to transform. If you need help implementing data analytics in your organization or if you want to learn more, you should consult professionals or sign up for specialized courses. For instance, the ACTE Institute offers comprehensive data analytics training courses that can provide you the knowledge and skills you need.
7 notes
·
View notes
Text
Mastering Data Analytics: Your Path to Success Starts at Corpus Digital Hub
Corpus Digital Hub is more than just a training institute—it's a hub of knowledge, innovation, and opportunity. Our mission is simple: to empower individuals with the skills and expertise needed to thrive in the fast-paced world of data analytics. Located in the vibrant city of Calicut, our institute serves as a gateway to endless possibilities and exciting career opportunities.
A Comprehensive Approach to Learning
At Corpus Digital Hub, we believe that education is the key to unlocking human potential. That's why we offer a comprehensive curriculum that covers a wide range of topics, from basic data analysis techniques to advanced machine learning algorithms. Our goal is to provide students with the tools and knowledge they need to succeed in today's competitive job market.
Building Strong Foundations
Success in data analytics begins with a strong foundation. That's why our courses are designed to provide students with a solid understanding of core concepts and principles. Whether you're new to the field or a seasoned professional, our curriculum is tailored to meet your unique needs and aspirations.
Hands-On Experience
Theory is important, but nothing beats hands-on experience. That's why we place a strong emphasis on practical learning at Corpus Digital Hub. From day one, students have the opportunity to work on real-world projects and gain valuable experience that will set them apart in the job market.
A Supportive Learning Environment
At Corpus Digital Hub, we believe that learning is a collaborative effort. That's why we foster a supportive and inclusive learning environment where students feel empowered to ask questions, share ideas, and explore new concepts. Our experienced faculty members are dedicated to helping students succeed and are always available to provide guidance and support.
Cultivating Future Leaders
Our ultimate goal at Corpus Digital Hub is to cultivate the next generation of leaders in data analytics. Through our rigorous curriculum, hands-on approach, and supportive learning environment, we provide students with the tools and confidence they need to excel in their careers and make a positive impact on the world.
Join Us on the Journey
Are you ready to take the next step towards a brighter future? Whether you're a recent graduate, a mid-career professional, or someone looking to make a career change, Corpus Digital Hub welcomes you with open arms. Join us on the journey to mastery in data analytics and unlock your full potential.
Contact Us Today
Ready to get started? Contact Corpus Digital Hub to learn more about our programs, admissions process, and scholarship opportunities. Your journey towards success starts here!
Stay connected with Corpus Digital Hub for the latest news, updates, and success stories from our vibrant community of learners and educators. Together, we'll shape the future of data analytics and make a difference in the world!

#data analytics#data science#machinelearning#Data Visualization#Business Intelligence#big data#Data Mining#Business Analytics#Data Exploration#Data Analysis Techniques#Data Analytics Certification#Data Analytics Training#Data Analyst Skills#Data Analytics Careers#Data Analytics Jobs#Data Analytics Industry
2 notes
·
View notes
Text
Understanding IHD with Data Science
Ischemic Heart Disease (IHD), more commonly recognized as coronary artery disease, is a profound health concern that stems from a decreased blood supply to the heart. Such a decrease is typically due to fatty deposits or plaques narrowing the coronary arteries. These arteries, as vital conduits delivering oxygen-rich blood to the heart, play a paramount role in ensuring the heart's efficient functioning. An obstruction or reduced flow within these arteries can usher in adverse outcomes, with heart attacks being the most dire. Given the gravity of IHD, the global medical community emphasizes the essence of early detection and prompt intervention to manage its repercussions effectively.
A New Age in Healthcare: Embracing Data Science
As we stand on the cusp of the fourth industrial revolution, technology's intertwining with every domain is evident. The healthcare sector is no exception. The integration of data science in healthcare is not merely an augmentation; it's a paradigm shift. Data science, with its vast array of tools and methodologies, is fostering new avenues to understand, diagnose, and even predict various health conditions long before they manifest pronounced symptoms.
Machine Learning: The Vanguard of Modern Medical Research
Among the myriad of tools under the vast umbrella of data science, Machine Learning (ML) shines exceptionally bright. An essential offshoot of artificial intelligence, ML capitalizes on algorithms and statistical models, granting computers the capability to process vast amounts of data and discern patterns without being explicitly programmed.
In the healthcare realm, the applications of ML are manifold. From predicting potential disease outbreaks based on global health data trends to optimizing patient flow in bustling hospitals, ML is progressively becoming a linchpin in medical operations. One of its most lauded applications, however, is its prowess in early disease prediction, and IHD detection stands as a testament to this.
Drawn to the immense potential ML holds, I ventured into a research project aimed at harnessing the RandomForestClassifier model's capabilities. Within the medical research sphere, this model is celebrated for its robustness and adaptability, making it a prime choice for my endeavor.
Deep Dive into the Findings
The results from the ML model were heartening. With an accuracy rate of 90%, the model’s prowess in discerning the presence of IHD based on an array of parameters was evident. Such a high accuracy rate is pivotal, considering the stakes at hand – the very health of a human heart. 9 times out of 10 the model is correct at its predictions.
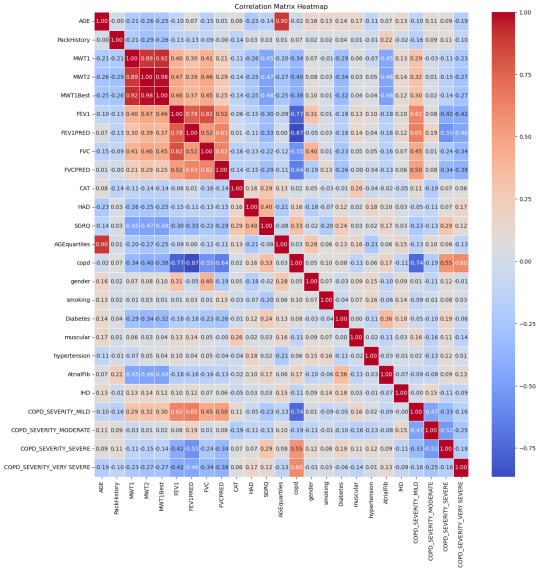
Breaking down the data, some correlations with IHD stood out prominently:
Moderate COPD (Chronic Obstructive Pulmonary Disease) – 15%: COPD's inclusion is noteworthy. While primarily a lung condition, its linkage with heart health has been a topic of numerous studies. A compromised respiratory system can inadvertently strain the heart, underscoring the interconnectedness of our bodily systems.
Diabetes – 18%: The correlation between diabetes and heart health isn't novel. Elevated blood sugar levels over extended periods can damage blood vessels, including the coronary arteries.
Age (segmented in quarterlies) – 15%: Age, as an immutable factor, plays a significant role. With age, several bodily systems gradually wear down, rendering individuals more susceptible to a plethora of conditions, IHD included.
Smoking habits – 14%: The deleterious effects of smoking on lung health are well-documented. However, its impact extends to the cardiovascular system, with nicotine and other chemicals adversely affecting heart functions.
MWT1 and MWT2 (indicators of physical endurance) – 13% and 14% respectively: Physical endurance and heart health share an intimate bond. These metrics, gauging one's physical stamina, can be precursors to potential heart-related anomalies.
Redefining Patient Care in the Machine Learning Era
Armed with these insights, healthcare can transcend its conventional boundaries. A deeper understanding of IHD's contributors empowers medical professionals to devise comprehensive care strategies that are both preventive and curative.
Moreover, the revelations from this study underscore the potential for proactive medical interventions. Instead of being reactive, waiting for symptoms to manifest, healthcare providers can now adopt a preventive stance. Patients exhibiting the highlighted risk factors can be placed under more meticulous observation, ensuring that potential IHD developments are nipped in the bud.
With the infusion of machine learning, healthcare is on the cusp of a personalized revolution. Gone are the days of one-size-fits-all medical approaches. Recognizing the uniqueness of each patient's health profile, machine learning models like the one employed in this study can pave the way for hyper-personalized care regimens.
As machine learning continues to entrench itself in healthcare, a future where disease predictions are accurate, interventions are timely, and patient care is unparalleled isn't merely a vision; it's an impending reality.
#heart disease#ihd#ischemic heart disease#programming#programmer#python#python programming#machine learning#data analysis#data science#data visualization#aicommunity#ai#artificial intelligence#medical research#medical technology
3 notes
·
View notes
Text
**Waves some jedi ninja hand sigils:
"These ARE the data you are looking for!"
the phantom of the opera and the hunchback of notre dame? opposite ends of same spectrum
#lotr#lord of the rings#jrr tolkien#tmnt#saruman#minas ithil#phantom of the opera#the hunchback of notre dame#geometry#graphs#visual data#statistics#statistical analysis#rigorous analysis#these are the data you are looking for#beauty and the beast#fairy tales#Gabrielle-Suzanne Barbot de Villeneuve#whatthefolklore#jedi#naruto
189K notes
·
View notes
Text
youtube
0 notes
Text
Unlock the Secret Language of Business Storytelling
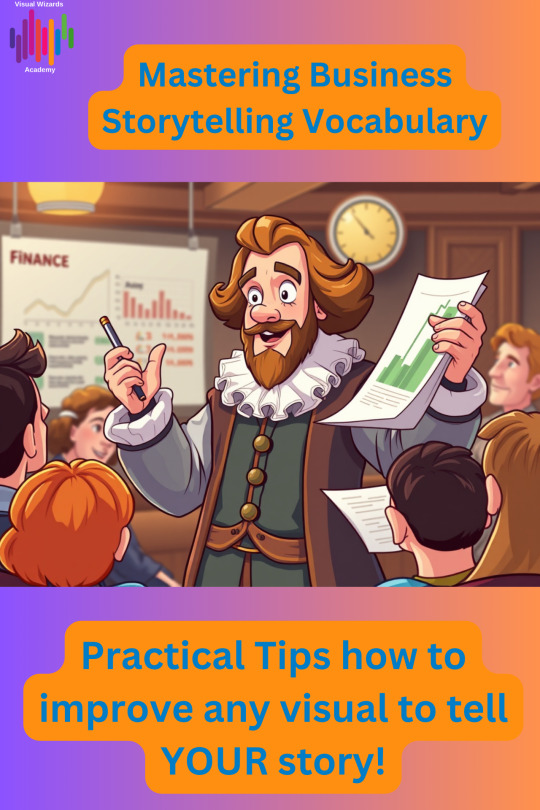
Ever listened to a presentation that felt flat—or read a report that left you wanting more? The difference between “just the facts” and a story that sticks often comes down to the words you choose. That’s right: vocabulary is your secret weapon for making your business ideas unforgettable.
Why Business Storytelling Vocabulary Matters
Whether you’re pitching an idea, presenting data, or rallying your team, the words you use shape how your message is heard—and remembered. Great business storytellers don’t just share information; they use vivid language, emotional triggers, and powerful analogies to connect with their audience and drive action.
Key Phrases That Make Your Stories Pop
Here are a few storytelling phrases and strategies you can use right away: • “Once upon a time…” — Yes, even in business! This classic opener grabs attention and signals the start of a journey. • “Picture this…” — Invite your audience to visualize the scenario, making your story more immersive and relatable. • “In the face of adversity…” — Highlight challenges and resilience, adding drama and inspiration to your message. • “To cut a long story short…” — Keep your story focused and impactful, especially when time is tight. • “To wrap up…” — Signal the end and reinforce your key takeaway.
How to Build Your Storytelling Toolkit
1. Spot Stories Everywhere: Look for real-life moments—both successes and challenges—that illustrate your point. 2. Use Emotional Language: Words like “passion,” “determination,” and “dream” make your stories more engaging and human. 3. Practice, Practice, Practice: The more you use these phrases and techniques, the more natural they’ll become—and the more your audience will connect with your message. Mastering business storytelling vocabulary isn’t just about sounding good—it’s about making your ideas stick, inspiring action, and standing out in a crowded world. Whether you’re a marketer, analyst, leader, or creative, these skills will help you communicate with clarity and confidence.
Ready to level up your storytelling?
👉 Read the full article here and start mastering your vocabulary today
0 notes
Text
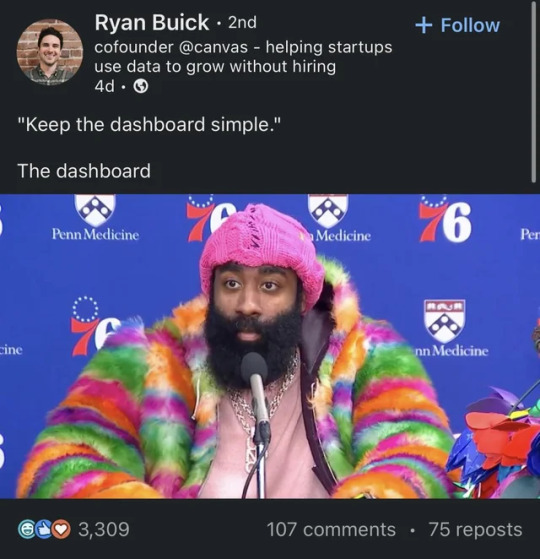
#Finance#Business#Work Meme#Work Humor#Excel#Hilarious#funny meme#funny#accounting#office humor#consulting#big data#data analysis#data visualization#data analytics#data#dashboard commentary#tableau#power bi
13 notes
·
View notes
Text
Drive Smarter Decisions with the Best Data Visualization Online in Detroit – CDATAINSIGHTS
In a digital-first economy, data is everywhere—but insight is rare. As businesses across North America face growing volumes of complex information, the need for effective data visualization has never been more critical. At CDATAINSIGHTS, we deliver the best data visualization online in Detroit, helping organizations unlock deeper meaning from their data and make confident, insight-driven decisions.
What Sets CDATAINSIGHTS Apart?
Our advanced data visualization services go beyond static charts. We provide interactive, dynamic visuals that bring your KPIs, forecasts, and operations into full view. Whether you're in healthcare, manufacturing, finance, or logistics, our team builds solutions tailored to your goals.
With our extension into Canada, we’ve become a top choice for businesses looking for top data analysis and visualization in Mississauga—and now, we’re bringing that same level of excellence to Detroit’s thriving business community, all online.
Solutions We Offer
Real-Time Dashboards: Visualize operational metrics as they happen
Geospatial Mapping: Add a location-based dimension to your insights
Executive Reporting: Custom presentations for leadership teams
Predictive Visualization: Forecast trends and risks visually
Data Storytelling: Combine visuals with narratives to drive strategy
Seamless Online Delivery for Detroit Businesses
At CDATAINSIGHTS, we specialize in delivering enterprise-grade solutions fully online. Whether you're a startup or Fortune 500 company, our experts guide you through the visualization journey—from strategy to execution—with zero disruption to your operations.
So if you're looking for the best data visualization online in Detroit, you don’t need to look any further. Our virtual services bring quality, precision, and innovation straight to your screen.
Trusted Across North America
From startups to established corporations, businesses trust CDATAINSIGHTS for accurate, meaningful, and visually engaging dashboards. Our reputation as a leader in top data analysis and visualization in Mississauga speaks to our deep commitment to excellence and results.
Ready to See Your Data Differently?
Your data holds the answers. Let us help you find them.
📈 Explore our data visualization services today and discover why CDATAINSIGHTS is the preferred partner for businesses in Detroit and beyond.
🔗 Visit: https://cdatainsights.com 📧 Get in touch: [email protected]
#best data visualization online in Detroit#top data visualization services in Toronto#top data analysis and visualization in Mississauga#data visualization services
0 notes