#Waterways
Photo
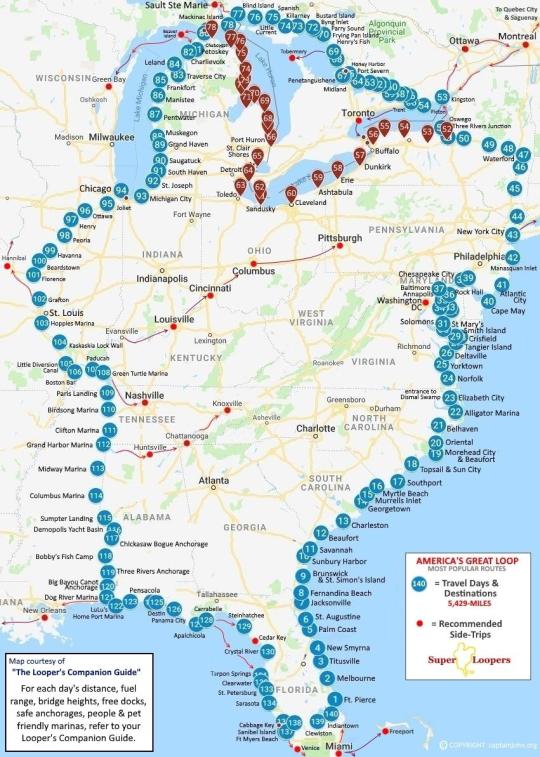
The Great Loop is a continuous waterway that mariners can travel that includes part of the Atlantic, Gulf Intracoastal Waterways, the Great Lakes, Canadian Heritage Canals, and the inland rivers of America's heartland.
2K notes
·
View notes
Text
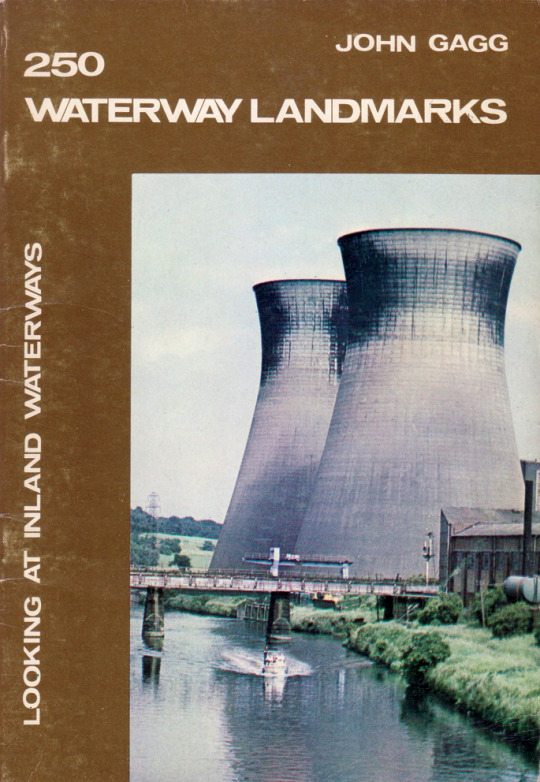
250 Waterway Landmarks by John Gagg (1976)
#geography#waterways#cooling towers#canal#book cover#united kingdom#1970s#70s design#typography#1976
359 notes
·
View notes
Text
🤣🤣🤣👉🐙
#ocean animals#ocean view#ocean life#octopus#ocean#sea animals#sea creatures#sea#under water photography#waterlife#waterways#watercolor#water#nature#nature photography#photography#lifestyle#plants#animal planet#animal#animals#funny content#funny stuff#funny memes#funny
289 notes
·
View notes
Text
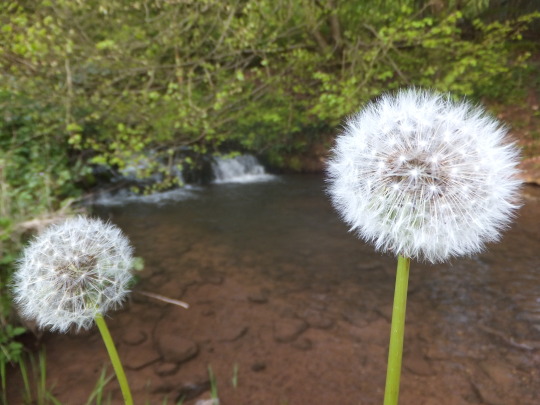
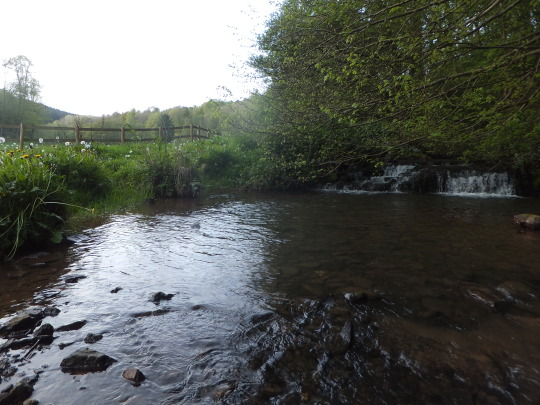
Dandelion Pom-Poms at the Dipping Pool
May 2023
#emeraldscrapbook#own photo#scrapbookphoto#forest#lensblr#original photographers#woods#green#dandelion#dandelion seeds#may#spring#spring aesthetic#summer#dipping#water#pool#swimming#nature#woodland#countryside#rural#fields#waterways#stream#river#waterfall#photographers on tumblr#original photography
63 notes
·
View notes
Text

The Barge Inn
54 notes
·
View notes
Photo
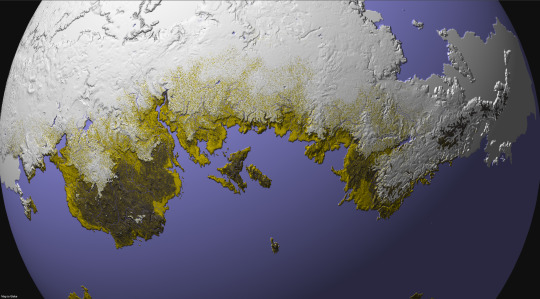
Some months ago, I created a series of maps and diagrams for @iguanodont‘s Birdbug worldbuilding project, representing the planet inhabited by their original species and its planetological data. This isn’t the first time I mapped out this planet, as I was also commissioned by Ripley back in 2020 back when I didn’t have nearly as much experience and knowledge as I do now. Two years later, I’ve been commissioned once again to revisit this world and its peculiarities.
This first map (in Equirectangular projection and poles-centered perspective) depicts the elevation for this planet, with a color gradient applied to the data.
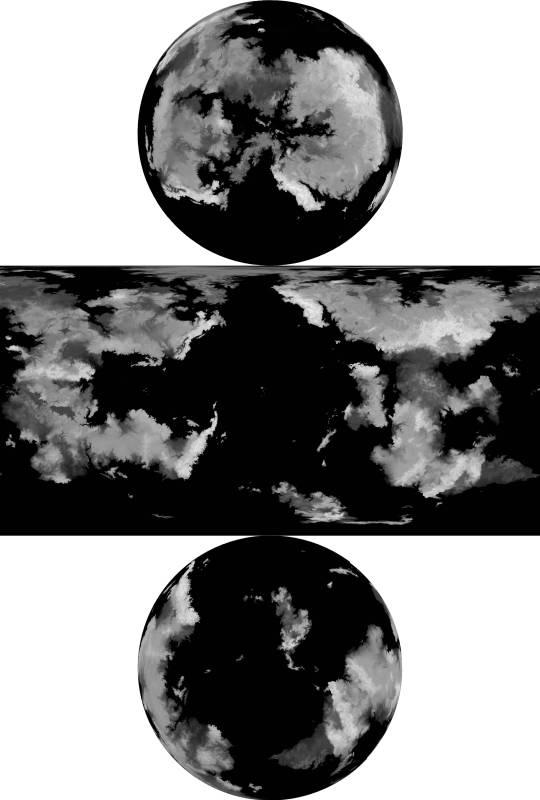
Here is the same elevation data, presented without the color gradient.
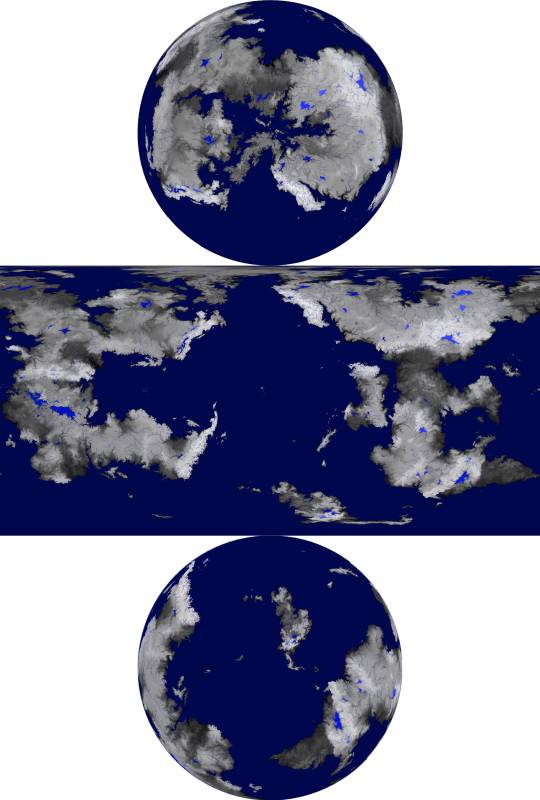
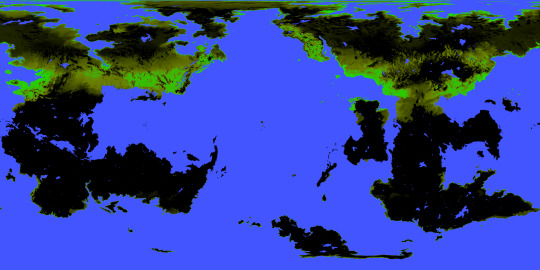
This time, the elevation is presented with bodies of liquid water included, such as rivers, oceans, and lakes.
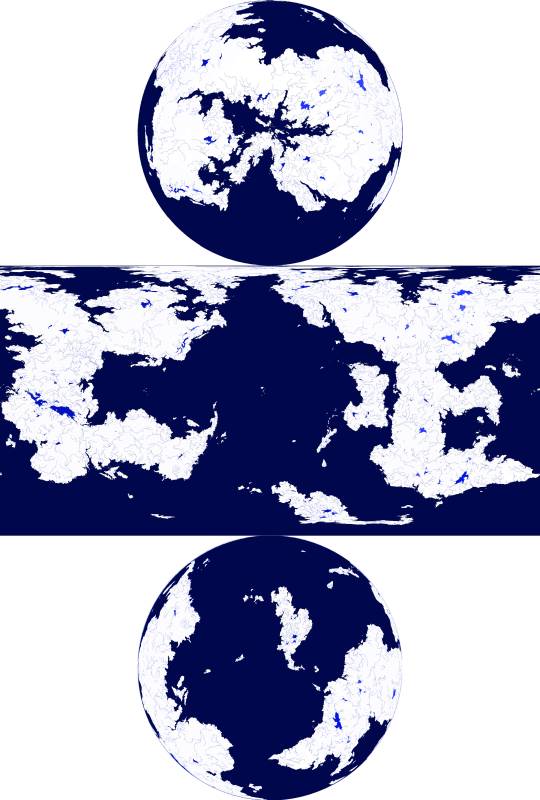
and in this one, the water is isolated from the other data, against a white background
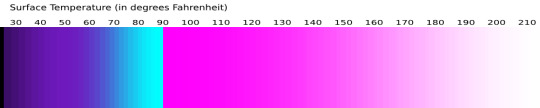
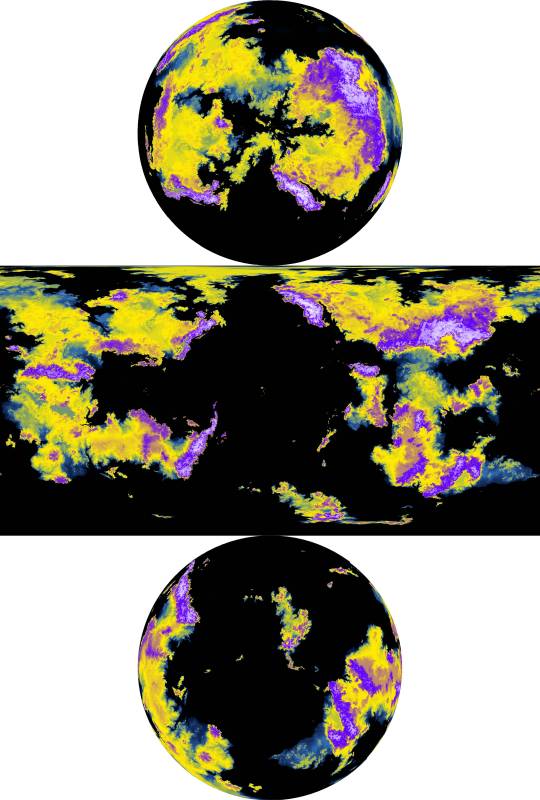
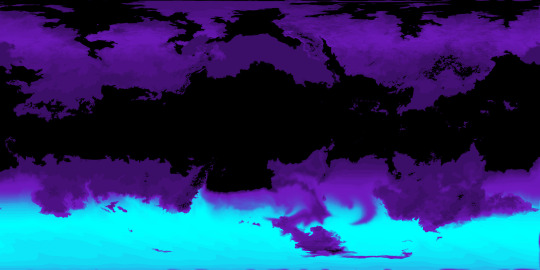
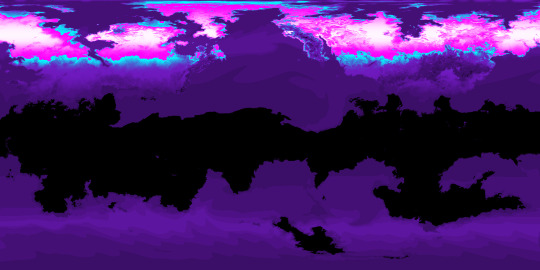
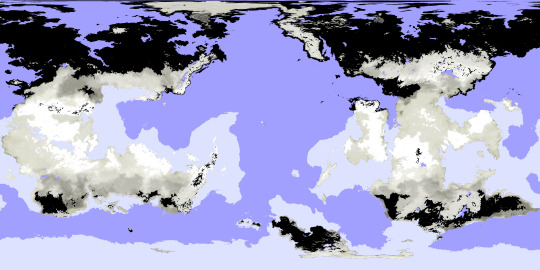
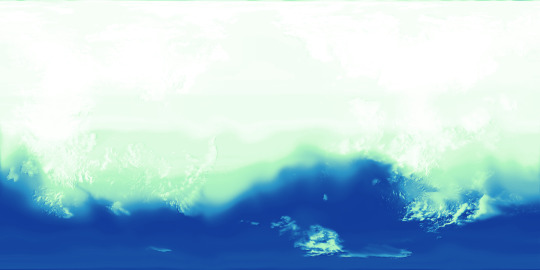
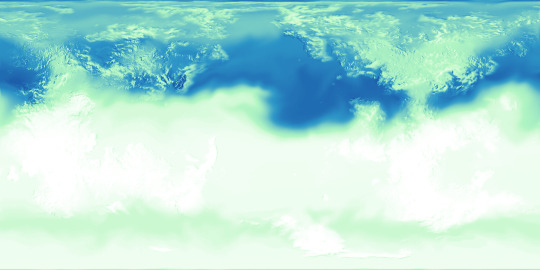
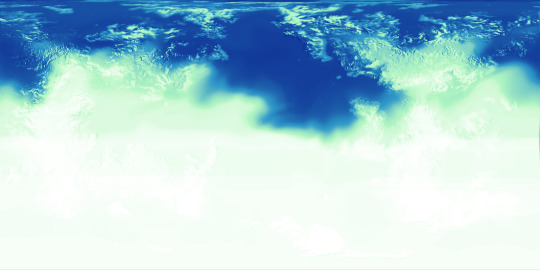
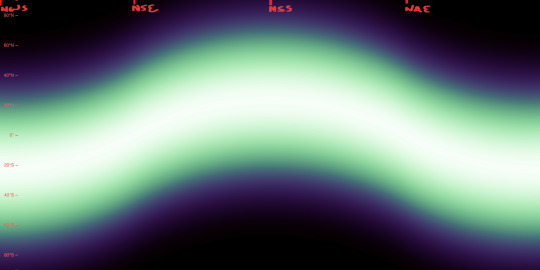
Next, there are the surface temperatures that occur on this planet, the key to which is shown above. The four maps below show the seasonal temperatures for land and sea, in order of Northern Spring Equinox, Northern Summer Solstice, Northern Autumn Equinox, and Northern Winter Solstice.
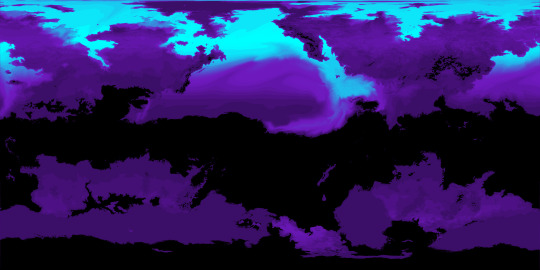
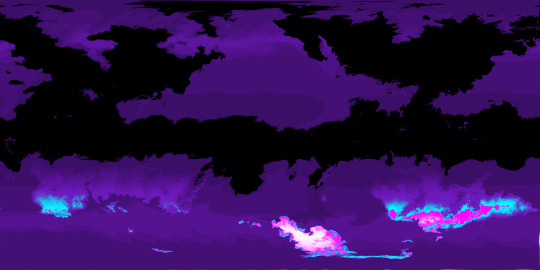
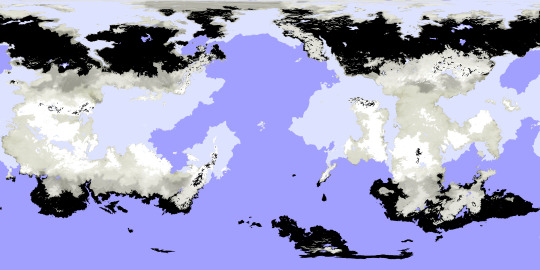
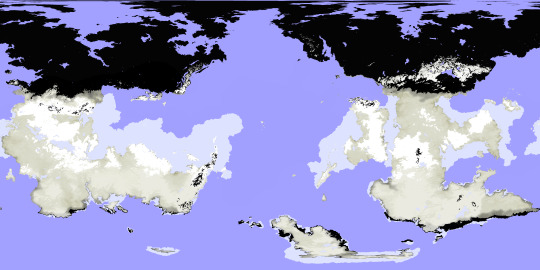
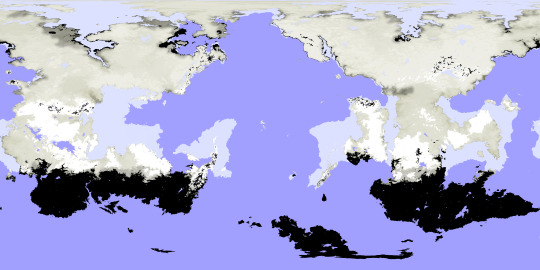
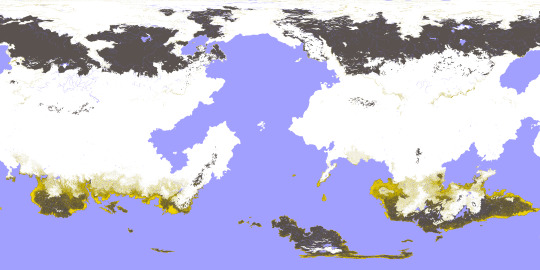
Correlating closely to the above data is the snow and ice cover, which is fairly extensive on this planet owing to its high obliquity and distance from its star. Land ice only occurs where the snow falls and is compacted year-round, but snow and sea ice can be much more seasonal.
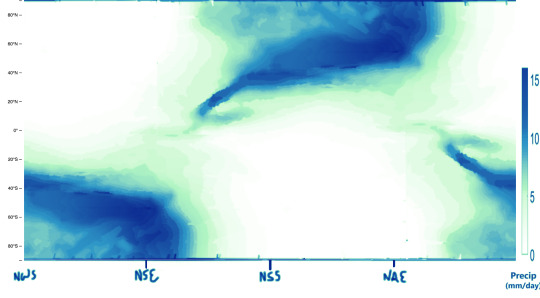
Seasonal precipitation levels were another important phase of this project, and the below diagram shows those levels for a given latitude (y-axis) on a given date (x-axis), with a key attached.
My reference for creating the above graphic is the figure below, which comes from a 2019 paper by A.H. Lobo and S. Bordoni titled “Atmospheric Dynamics of High Obliquity Planets”, and shows Earth’s precipitation levels compared to those of a planet with an 85° obliquity.
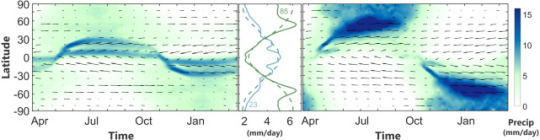
The following maps can now be better understood in light of these diagrams and keys.
-Northern Spring Equinox
-Northern Summer Solstice
-Northern Autumn Equinox

-Northern Winter Solstice
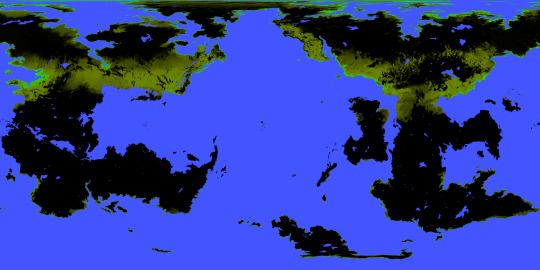
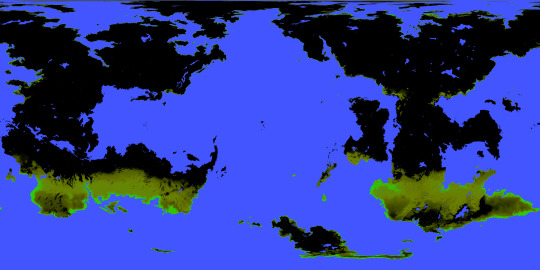
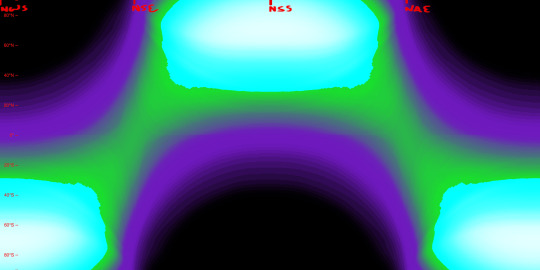
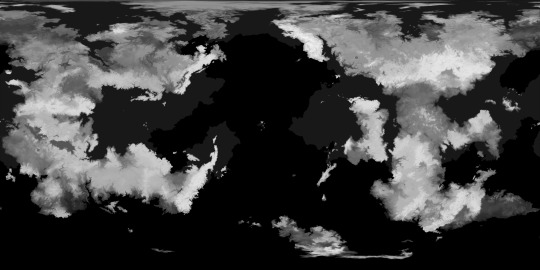
I was also tasked with mapping out the extent and density of this planet’s vegetation (or at least its alien equivalent), and from this you can see how wildly it varies by season, with very few year-round holdings. Precipitation is a major factor in where it is possible for plants to flourish, but snow cover and the extreme temperature swings limit it too. Near either pole, for example, within the space of a year temperatures soar far above Earth’s upper limits and also plummet below freezing; if either extreme were to be the annual norm for a region, some plants might adapt to those conditions, but because of the wild fluctuation any adaptations to one extreme would leave plants especially vulnerable to the other. These regions, then, remain barren regardless of rainfall or brief windows of mild temperatures, while areas with less wide temperature ranges allow for at least brief periods of flourishing.

Determining the surface temperatures for this planet required a lot of background work. The first piece of the puzzle for this was knowing the number of daily hours of sunlight for a given latitude and date, which is exemplified first in this diagram for Earth:
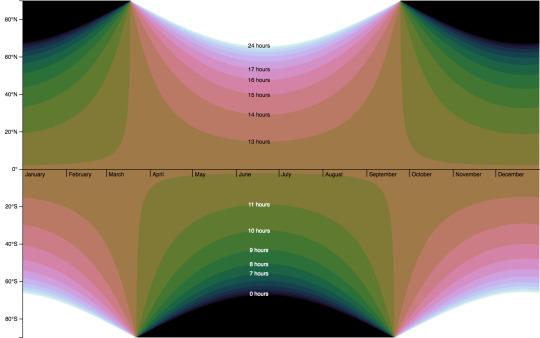
and then for the Birdbug planet, below. Since this planet rotates on an axis of 60 degrees, there are many more latitudes within range of either pole that experience periods of sunlight and darkness lasting longer than a day. The higher the latitude, the longer this period lasts, with the poles themselves experiencing either condition for half a year at a time.
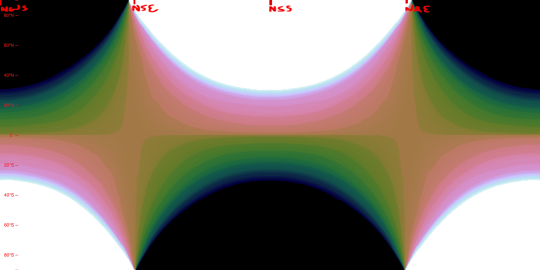
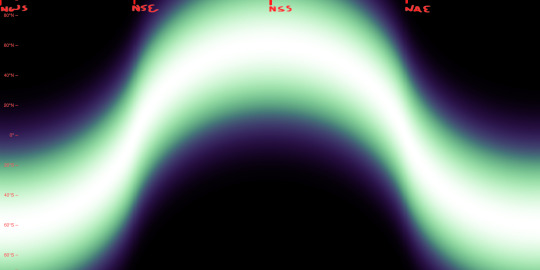
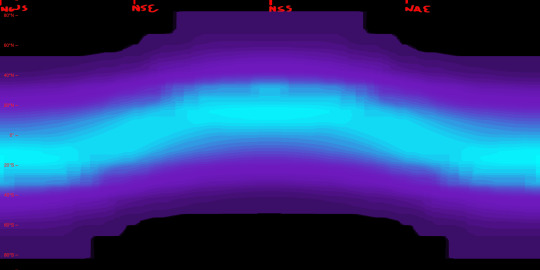
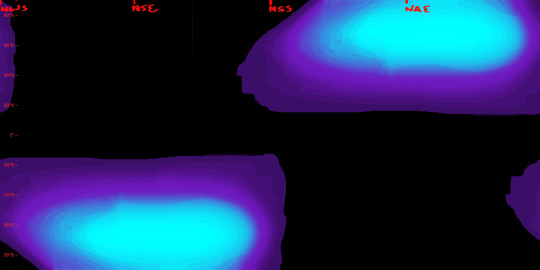
Another important factor is the height to which the sun is seen to rise (more scientifically, the angle at which the sun’s light hits parts of the planet’s surface), seen here first for Earth and then for the Birdbug planet. In these diagrams, white represents the sun reaching the zenith of the sky (meeting the surface at a 90° angle), and black represents the sun failing to appear above the horizon (meeting at an angle of 0° or below), while shades of green and purple stand in for angles between those extremes. For Earth and the Birdbug planet alike, the sun reaches the zenith within the bounds of either planet’s Tropic circles of latitude, and fails to rise at all only within the Polar circles of latitude; the difference in obliquity means that the Birdbug planet’s key circles of latitude are flipped compared to Earth’s.
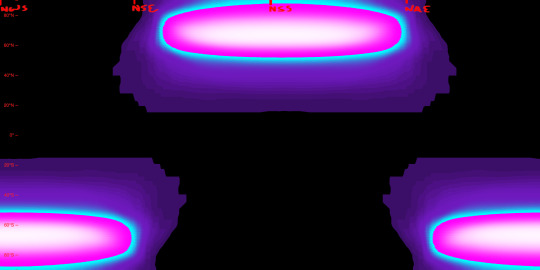
The duration of sunlight and the angle at which that sunlight is reaches the planet’s surface determine a planet’s Insolation, that is, the amount of solar energy it receives. The first image below is a preexisting diagram of Earth’s Insolation, where it is measured in watts per square meter. The next two images are my own attempts at replicating this data for Earth, and then for the Birdbug planet.
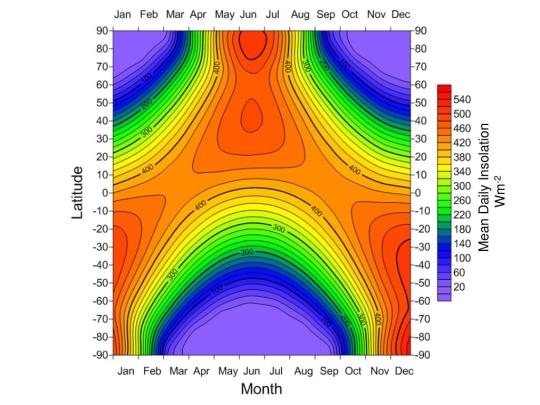
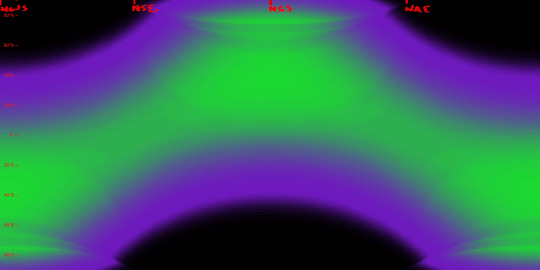
As seen in the diagrams above, Insolation on the Birdbug planet differs from Earth not only in its latitudinal distribution, but also in its sheer intensity at the higher latitudes. Compared to Earth there are twice as many latitudes for which the sun is shining longer than one rotational period, and many of those latitudes see the sun shine at a direct or nearly direct angle, whereas the Polar circles of latitude on Earth see the sun shine much more obliquely.
Below, we can see the data that all the above figures were instrumental in finding: that is, surface temperatures. The first image is a preexisting figure that measures Earth’s mean surface temperatures by date and latitude, and below that is my attempt at replicating the data by my own process.
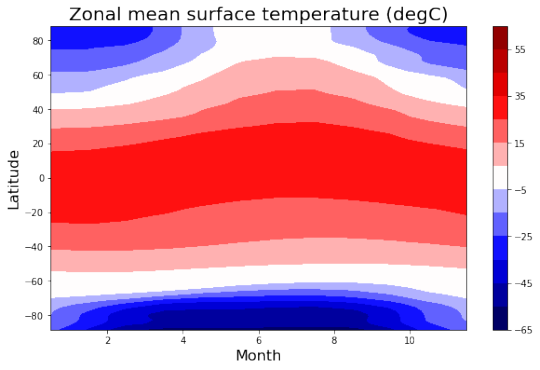
This is done not by just copying the seasonal Insolation data, but by also factoring in the yearly average for each latitude.
Above, we see the temperatures of the land by date and latitude, and below, we see the temperatures at the surface of the sea, which lag behind the land temperatures and remain comparatively mild.
Lastly, here’s an image I created to combine the snow and ice cover as well as the vegetation extent and density, as of the Northern Spring Equinox. This, along with the elevation map also seen here, is what I uploaded to maptoglobe.com in order to produce the screenshot at the top of this post.
These maps and figures (except for the preexisting ones) were all created in Photopea. Higher resolution versions of many of these images can be seen in my dedicated Reddit posts, linked below:
reddit post one, reddit post two
2022
#mapmaking#imaginary maps#worldbuilding#major project#imaginary planetology#elevation#waterways#river systems#surface temperatures#ice and snow cover#sea ice#precipitation#vegetation#Insolation#high obliquity planets#explanatory diagrams#digital rendering#Photopea#Birdbug worldbuilding project#Birgs#Birgworld#2022#digital painting#extremely long post#Christopher Maida Artwork
616 notes
·
View notes
Text
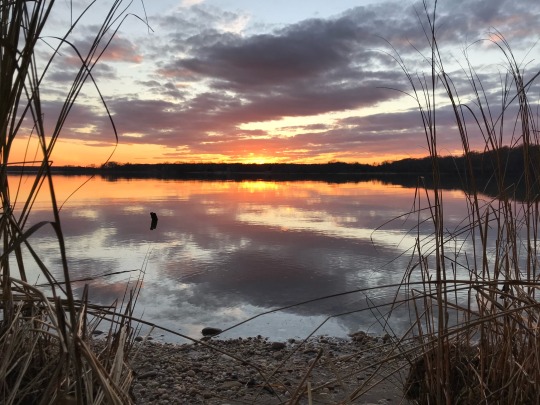
You must live in the present, launch yourself on every wave, find your eternity in each moment. Fools stand on their island of opportunities and look toward another land. There is no other land; there is no other life but this.
#ralph waldo emerson#original photographers#original photography on tumblr#nature#nature photography#forest#landscape#autumn#riverfront#waterways#sunset#quotes#quoteoftheday#book quotes
28 notes
·
View notes
Text
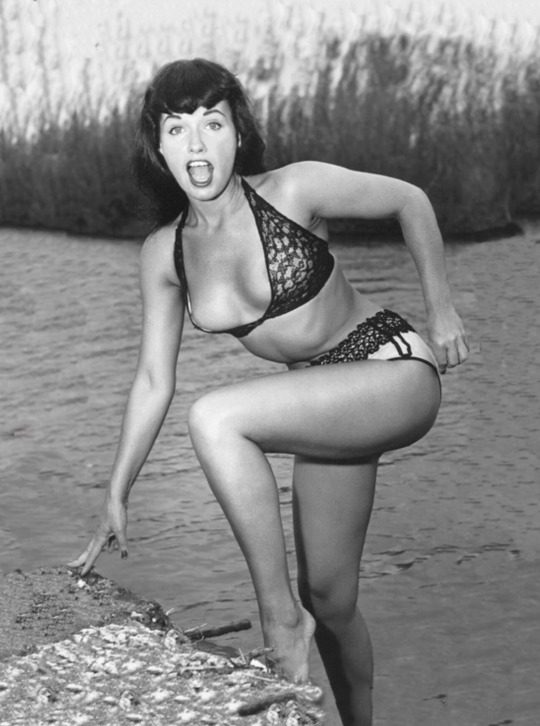
Bettie at the beach
Reposting photographs which Tumblr thought to censor, as you will see, there was no reason for their reaction
#bettie page#bettiepage#sexy#long hair#beautiful smile#long legs#betty page#beautiful face#beautiful eyes#beach#waterways#intercoastal
96 notes
·
View notes
Text
Elon Musk's Boring Company wants to dump 142,500 gallons of wastewater A DAY directly into the Colorado River and onto 63 acres of grassland via irrigation
Space Karen’s company, Gapped Bass LLC, applied for this controversial permit and it went to public meeting this week
My vote is Elon for the upcoming Ides of March sacrifice
#elon musk#muskrat#elongated muskrat#enviromental#environment#conservation#wastewater#politics#Caesar#the ides of march#ides of march#julius caesar#march 15th#march 15#beware the ides of march#polluters#polluted water#protect our wildlife#protect our earth#waterways#environmental issues#environmental pollution#environmentalism#space karen#fuck elon musk#fuck elon#elon musty#elongated man#brutus#ancient rome
179 notes
·
View notes
Photo

Map of the Netherlands showing all its waterways.
219 notes
·
View notes
Text
Huge but Inocent Eye's 🐳
#ocean animals#ocean and sky#ocean view#ocean life#oceancore#stone ocean#ocean#sea art#sea animals#sea creatures#sea#under water photography#waterfall#water#waterways#waterlife#nature#nature photography#landscape#photography#plants#sunset#flower#flowers#insects#nature photo art#national geographic#animal planet
78 notes
·
View notes
Text
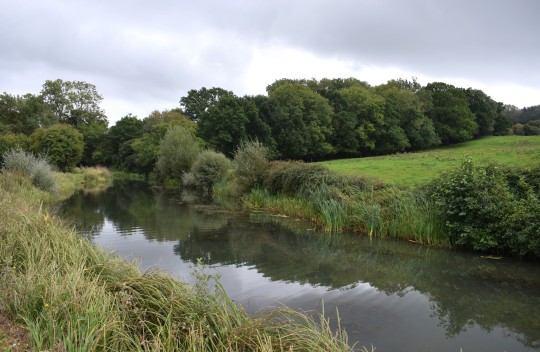
Old canal: Wiltshire
97 notes
·
View notes
Text
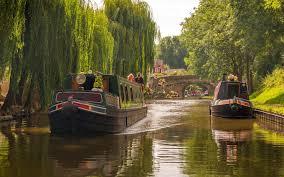

Why loiter on motorways when you can see Britain on her waterways
#canal boats#barge cruising#scenery#English pub#romantic#canal network#riverboats#waterways#British canals#UK
66 notes
·
View notes
Text
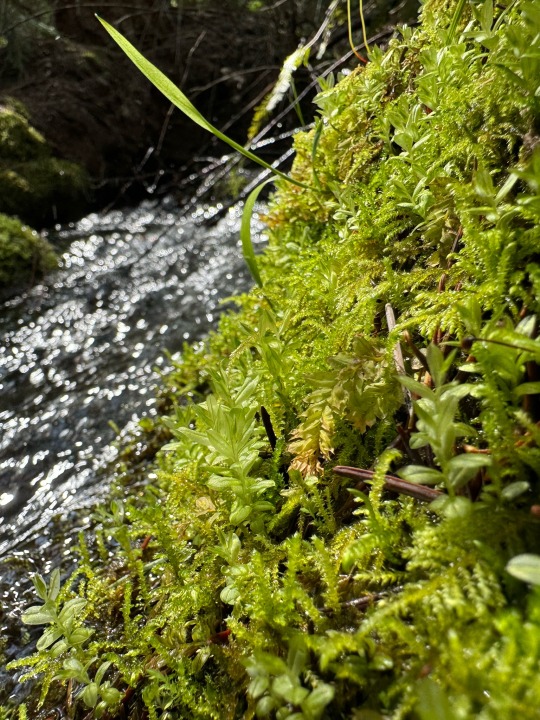
Waterfront property.
Oregon, 2024.
#original photographers#original photography on tumblr#nature#nature photography#forest#landscape#pnwonderland#pnw#waterways#creek#moss
30 notes
·
View notes
Text

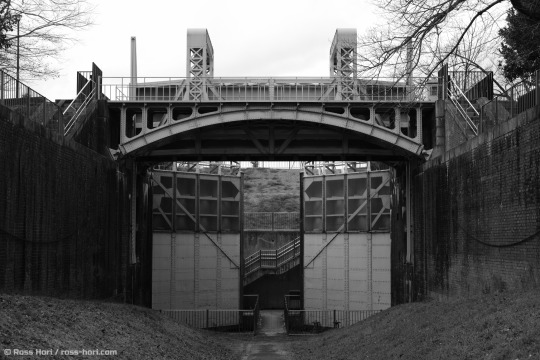


I stumbled across this forgotten lock whilst walking along the Okawa river. It's a tributary of the Yodogawa, and I'm not entirely sure why it's here.
It's one of those bits of industrial heritage scattered across the city that the tourist never seem to find.
#photography#japan#fujifilm#original photographers#black and white#monochrome#osaka#Industrial#waterways#history#abandoned
15 notes
·
View notes
Last Seen Blogs


transsteveharrington
thank your lucky stars

aimeecurameng
Aimee V. Curameng

sahilchawla
Untitled

solitudeofsunna
Hiraeth