#aggregate functions in sql server
Explore tagged Tumblr posts
Visit Tumblr Blog
Explore Tumblr blogs with no restrictions, modern design and the best experience.
Last Seen Tumblr Blogs


Fun Fact
70% of Tumblr users say the Dashboard is their favorite place to spend time online.
Text
Mastering Aggregate Functions in SQL: A Comprehensive Guide
Introduction to SQL: In the realm of relational databases, Structured Query Language (SQL) serves as a powerful tool for managing and manipulating data. Among its many capabilities, SQL offers a set of aggregate functions that allow users to perform calculations on groups of rows to derive meaningful insights from large datasets.

Learn how to use SQL aggregate functions like SUM, AVG, COUNT, MIN, and MAX to analyze data efficiently. This comprehensive guide covers syntax, examples, and best practices to help you master SQL queries for data analysis.
#aggregate functions#sql aggregate functions#aggregate functions in sql#aggregate functions in dbms#aggregate functions in sql server#aggregate functions in oracle#aggregate function in mysql#window function in sql#aggregate functions sql#best sql aggregate functions#aggregate functions and grouping#aggregate functions dbms#aggregate functions mysql#aggregate function#sql window functions#aggregate function tutorial#postgresql aggregate functions tutorial.
0 notes
Text
Finding the Maximum Value Across Multiple Columns in SQL Server
To find the maximum value across multiple columns in SQL Server 2022, you can use several approaches depending on your requirements and the structure of your data. Here are a few methods to consider: 1. Using CASE Statement or IIF You can use a CASE statement or IIF function to compare columns within a row and return the highest value. This method is straightforward but can get cumbersome with…
View On WordPress
#comparing multiple columns SQL#SQL CROSS APPLY technique#SQL Server aggregate functions#SQL Server date comparison#SQL Server maximum value
0 notes
Text
Cross-Mapping Tableau Prep Workflows into Power Query: A Developer’s Blueprint
When migrating from Tableau to Power BI, one of the most technically nuanced challenges is translating Tableau Prep workflows into Power Query in Power BI. Both tools are built for data shaping and preparation, but they differ significantly in structure, functionality, and logic execution. For developers and BI engineers, mastering this cross-mapping process is essential to preserve the integrity of ETL pipelines during the migration. This blog offers a developer-centric blueprint to help you navigate this transition with clarity and precision.
Understanding the Core Differences
At a foundational level, Tableau Prep focuses on a flow-based, visual paradigm where data steps are connected in a linear or branching path. Power Query, meanwhile, operates in a functional, stepwise M code environment. While both support similar operations—joins, filters, aggregations, data type conversions—the implementation logic varies.
In Tableau Prep:
Actions are visual and sequential (Clean, Join, Output).
Operations are visually displayed in a flow pane.
Users rely heavily on drag-and-drop transformations.
In Power Query:
Transformations are recorded as a series of applied steps using the M language.
Logic is encapsulated within functional scripts.
The interface supports formula-based flexibility.
Step-by-Step Mapping Blueprint
Here’s how developers can strategically cross-map common Tableau Prep components into Power Query steps:
1. Data Input Sources
Tableau Prep: Uses connectors or extracts to pull from databases, Excel, or flat files.
Power Query Equivalent: Use “Get Data” with the appropriate connector (SQL Server, Excel, Web, etc.) and configure using the Navigator pane.
✅ Developer Tip: Ensure all parameters and credentials are migrated securely to avoid broken connections during refresh.
2. Cleaning and Shaping Data
Tableau Prep Actions: Rename fields, remove nulls, change types, etc.
Power Query Steps: Use commands like Table.RenameColumns, Table.SelectRows, and Table.TransformColumnTypes.
✅ Example: Tableau Prep’s “Change Data Type” ↪ Power Query:
mCopy
Edit
Table.TransformColumnTypes(Source,{{"Date", type date}})
3. Joins and Unions
Tableau Prep: Visual Join nodes with configurations (Inner, Left, Right).
Power Query: Use Table.Join or the Merge Queries feature.
✅ Equivalent Code Snippet:
mCopy
Edit
Table.NestedJoin(TableA, {"ID"}, TableB, {"ID"}, "NewColumn", JoinKind.Inner)
4. Calculated Fields / Derived Columns
Tableau Prep: Create Calculated Fields using simple functions or logic.
Power Query: Use “Add Column” > “Custom Column” and M code logic.
✅ Tableau Formula Example: IF [Sales] > 100 THEN "High" ELSE "Low" ↪ Power Query:
mCopy
Edit
if [Sales] > 100 then "High" else "Low"
5. Output to Destination
Tableau Prep: Output to .hyper, Tableau Server, or file.
Power BI: Load to Power BI Data Model or export via Power Query Editor to Excel or CSV.
✅ Developer Note: In Power BI, outputs are loaded to the model; no need for manual exports unless specified.
Best Practices for Developers
Modularize: Break complex Prep flows into multiple Power Query queries to enhance maintainability.
Comment Your Code: Use // to annotate M code for easier debugging and team collaboration.
Use Parameters: Replace hardcoded values with Power BI parameters to improve reusability.
Optimize for Performance: Apply filters early in Power Query to reduce data volume.
Final Thoughts
Migrating from Tableau Prep to Power Query isn’t just a copy-paste process—it requires thoughtful mapping and a clear understanding of both platforms’ paradigms. With this blueprint, developers can preserve logic, reduce data preparation errors, and ensure consistency across systems. Embrace this cross-mapping journey as an opportunity to streamline and modernize your BI workflows.
For more hands-on migration strategies, tools, and support, explore our insights at https://tableautopowerbimigration.com – powered by OfficeSolution.
0 notes
Text
Master SQL in 2025: The Only Bootcamp You’ll Ever Need

When it comes to data, one thing is clear—SQL is still king. From business intelligence to data analysis, web development to mobile apps, Structured Query Language (SQL) is everywhere. It’s the language behind the databases that run apps, websites, and software platforms across the world.
If you’re looking to gain practical skills and build a future-proof career in data, there’s one course that stands above the rest: the 2025 Complete SQL Bootcamp from Zero to Hero in SQL.
Let’s dive into what makes this bootcamp a must for learners at every level.
Why SQL Still Matters in 2025
In an era filled with cutting-edge tools and no-code platforms, SQL remains an essential skill for:
Data Analysts
Backend Developers
Business Intelligence Specialists
Data Scientists
Digital Marketers
Product Managers
Software Engineers
Why? Because SQL is the universal language for interacting with relational databases. Whether you're working with MySQL, PostgreSQL, SQLite, or Microsoft SQL Server, learning SQL opens the door to querying, analyzing, and interpreting data that powers decision-making.
And let’s not forget—it’s one of the highest-paying skills on the job market today.
Who Is This Bootcamp For?
Whether you’re a complete beginner or someone looking to polish your skills, the 2025 Complete SQL Bootcamp from Zero to Hero in SQL is structured to take you through a progressive learning journey. You’ll go from knowing nothing about databases to confidently querying real-world datasets.
This course is perfect for:
✅ Beginners with no prior programming experience ✅ Students preparing for tech interviews ✅ Professionals shifting to data roles ✅ Freelancers and entrepreneurs ✅ Anyone who wants to work with data more effectively
What You’ll Learn: A Roadmap to SQL Mastery
Let’s take a look at some of the key skills and topics covered in this course:
🔹 SQL Fundamentals
What is SQL and why it's important
Understanding databases and tables
Creating and managing database structures
Writing basic SELECT statements
🔹 Filtering & Sorting Data
Using WHERE clauses
Logical operators (AND, OR, NOT)
ORDER BY and LIMIT for controlling output
🔹 Aggregation and Grouping
COUNT, SUM, AVG, MIN, MAX
GROUP BY and HAVING
Combining aggregate functions with filters
🔹 Advanced SQL Techniques
JOINS: INNER, LEFT, RIGHT, FULL
Subqueries and nested SELECTs
Set operations (UNION, INTERSECT)
Case statements and conditional logic
🔹 Data Cleaning and Manipulation
UPDATE, DELETE, and INSERT statements
Handling NULL values
Using built-in functions for data formatting
🔹 Real-World Projects
Practical datasets to work on
Simulated business cases
Query optimization techniques
Hands-On Learning With Real Impact
Many online courses deliver knowledge. Few deliver results.
The 2025 Complete SQL Bootcamp from Zero to Hero in SQL does both. The course is filled with hands-on exercises, quizzes, and real-world projects so you actually apply what you learn. You’ll use modern tools like PostgreSQL and pgAdmin to get your hands dirty with real data.
Why This Course Stands Out
There’s no shortage of SQL tutorials out there. But this bootcamp stands out for a few big reasons:
✅ Beginner-Friendly Structure
No coding experience? No problem. The course takes a gentle approach to build your confidence with simple, clear instructions.
✅ Practice-Driven Learning
Learning by doing is at the heart of this course. You’ll write real queries, not just watch someone else do it.
✅ Lifetime Access
Revisit modules anytime you want. Perfect for refreshing your memory before an interview or brushing up on a specific concept.
✅ Constant Updates
SQL evolves. This bootcamp evolves with it—keeping you in sync with current industry standards in 2025.
✅ Community and Support
You won’t be learning alone. With a thriving student community and Q&A forums, support is just a click away.
Career Opportunities After Learning SQL
Mastering SQL can open the door to a wide range of job opportunities. Here are just a few roles you’ll be prepared for:
Data Analyst: Analyze business data and generate insights
Database Administrator: Manage and optimize data infrastructure
Business Intelligence Developer: Build dashboards and reports
Full Stack Developer: Integrate SQL with web and app projects
Digital Marketer: Track user behavior and campaign performance
In fact, companies like Amazon, Google, Netflix, and Facebook all require SQL proficiency in many of their job roles.
And yes—freelancers and solopreneurs can use SQL to analyze marketing campaigns, customer feedback, sales funnels, and more.
Real Testimonials From Learners
Here’s what past students are saying about this bootcamp:
⭐⭐⭐⭐⭐ “I had no experience with SQL before taking this course. Now I’m using it daily at my new job as a data analyst. Worth every minute!” – Sarah L.
⭐⭐⭐⭐⭐ “This course is structured so well. It’s fun, clear, and packed with challenges. I even built my own analytics dashboard!” – Jason D.
⭐⭐⭐⭐⭐ “The best SQL course I’ve found on the internet—and I’ve tried a few. I was up and running with real queries in just a few hours.” – Meera P.
How to Get Started
You don’t need to enroll in a university or pay thousands for a bootcamp. You can get started today with the 2025 Complete SQL Bootcamp from Zero to Hero in SQL and build real skills that make you employable.
Just grab a laptop, follow the course roadmap, and dive into your first database. No fluff. Just real, useful skills.
Tips to Succeed in the SQL Bootcamp
Want to get the most out of your SQL journey? Keep these pro tips in mind:
Practice regularly: SQL is a muscle—use it or lose it.
Do the projects: Apply what you learn to real datasets.
Take notes: Summarize concepts in your own words.
Explore further: Try joining Kaggle or GitHub to explore open datasets.
Ask questions: Engage in course forums or communities for deeper understanding.
Your Future in Data Starts Now
SQL is more than just a skill. It’s a career-launching power tool. With this knowledge, you can transition into tech, level up in your current role, or even start your freelance data business.
And it all begins with one powerful course: 👉 2025 Complete SQL Bootcamp from Zero to Hero in SQL
So, what are you waiting for?
Open the door to endless opportunities and unlock the world of data.
0 notes
Text
Karenderia Multiple Restaurant System Nulled Script 1.1.8

Karenderia Multiple Restaurant System Nulled Script – Ultimate Solution for Online Food Ordering If you're looking to launch a professional, multi-restaurant food ordering platform without spending a fortune, the Karenderia Multiple Restaurant System Nulled Script is your perfect starting point. This powerful and feature-rich PHP-based script is designed for entrepreneurs and developers who want to build scalable food delivery systems like UberEats, DoorDash, or Grubhub—with full control and customization options at your fingertips. What is Karenderia Multiple Restaurant System Nulled Script? The Karenderia Multiple Restaurant System Nulled Script (KMRS) is a comprehensive food ordering and delivery platform created using PHP and MySQL. With its intuitive admin panel, responsive design, and robust set of features, it enables users to manage multiple restaurants, accept orders, and oversee every aspect of their online food business. This nulled version provides you with all premium functionalities unlocked—for free. Technical Specifications Script Type: PHP Web Application Database: MySQL Responsive Layout: Fully Mobile-Friendly Admin Panel: Advanced Admin Dashboard with Full Control Third-Party Integration: Supports SMS Gateways, Payment APIs, Google Maps Multilingual Support: Yes License: Nulled – All Premium Features Available Top Features and Benefits Multi-Restaurant Capability: Manage unlimited restaurants from a single dashboard. Real-Time Order Management: Receive, accept, or reject orders in real-time with notification support. Customer and Merchant Panels: Separate and secure login areas for both customers and restaurant owners. Flexible Payment Methods: Includes PayPal, Stripe, cash on delivery, and more. Google Maps Integration: Seamless delivery area mapping and customer location tracking. Promo & Coupons: Easily create marketing campaigns using discounts and promo codes. Advanced Reporting: Track sales, performance, and analytics with detailed reports. Why Choose Karenderia Multiple Restaurant System Nulled Script? By choosing the Karenderia Multiple Restaurant System Nulled Script, you gain access to a premium solution without the premium price tag. It's ideal for startups and developers looking to test, deploy, or scale their food ordering businesses fast and affordably. Plus, it allows you to keep 100% of the profit—no monthly subscription fees or hidden costs. Use Cases Food Delivery Startups: Create your own localized delivery service in days, not months. Cloud Kitchen Aggregators: Manage various cloud kitchen brands under a single platform. Restaurant Franchises: Oversee multiple branches with centralized control and performance tracking. How to Install and Use Download the Karenderia Multiple Restaurant System Nulled Script from our secure server. Upload the files to your web hosting environment using FTP or cPanel. Create a MySQL database and import the provided SQL file. Configure the database and site settings in the config files. Access the admin panel, add restaurants, and start accepting orders! Frequently Asked Questions (FAQs) Is the nulled script safe to use? Yes, our version of the Karenderia Multiple Restaurant System Nulled Script is carefully checked and tested to ensure it's free of malware or backdoors. However, always scan with your own antivirus software for added safety. Can I customize the look and feel of the platform? Absolutely! The script is fully open-source, allowing developers to make UI and backend modifications to match your brand and business requirements. Is this suitable for non-technical users? While some basic setup knowledge is required, we provide step-by-step instructions to help even beginners launch the platform with minimal effort. Does it support mobile apps? Yes, Karenderia comes with optional mobile app support (not included in this download), making it even easier for customers to order via Android and iOS. Can I use this script on multiple domains?
Since this is the nulled version, there are no restrictions—you can use it on as many domains as you wish. Get More Nulled Tools Looking to further enhance your WordPress site? Check out our flatsome NULLED theme—one of the best responsive WooCommerce themes available for free on our platform. Want to boost your SEO performance? Download All in One SEO Pack Pro and watch your website traffic grow! Don’t miss the opportunity to launch your food delivery business with the Karenderia Multiple Restaurant System . Download it now and experience the power of premium features—without the premium price!
0 notes
Text
Market Context: Online Food Delivery at Scale
Urbanization, smartphone ubiquity, and shifting consumer behaviors are fueling the global online food delivery market, which was valued at USD 380.43 billion in 2024 and is expected to grow at a 9.0% CAGR through 2030 Grand View Research. In the U.S. alone, major platforms like DoorDash and Uber Eats command over 90 % of market share—67 % and 23 % respectively—highlighting consumer preference for mobile-first, app-driven experiences Deliverect.
Product Overview
Name: Online Restaurant Food Ordering Project in ASP.NET ProjectsforEveryone.com
Platform: ASP.NET MVC (C#), SQL Server Microsoft Learn
Delivery: Instant download with complete source code, database scripts, and remote installation help ProjectsforEveryone.com
Pricing: ₹1,998 (originally ₹3,996) with a 30-day money-back guarantee ProjectsforEveryone.com
Core Features
Fully Responsive Design: Mobile-first layouts ensuring seamless UX on smartphones (over 70 % of orders originate via mobile) Deliverect.
Admin Dashboard:
Menu Management: Add, update, delete categories and items dynamically ProjectsforEveryone.com
Order Processing: View orders by date, update statuses, and track order history in real time ProjectsforEveryone.com
Customer Messaging: In-dashboard chat to handle inquiries without third-party tools ProjectsforEveryone.com
User Module:
Secure Authentication: Signup/login with secret-question password recovery ProjectsforEveryone.com
Shopping Cart & Checkout: Multiple payment options, unique order numbers, and instant confirmations ProjectsforEveryone.com
Order History & Reordering: One-click repeat orders and status tracking ProjectsforEveryone.com
Technical Architecture
ASP.NET MVC Pattern: The Model-View-Controller architecture separates data (Model), UI (View), and application logic (Controller), enhancing maintainability and testability Microsoft Learn.
C# & Visual Studio: Built using C# in Visual Studio (2010–2022), offering powerful debugging, IntelliSense, and integration with Azure services Microsoft Learn.
SQL Server Backend: Relational database support with included SQL scripts; easy deployment via SQL Server Compact or full SQL Server editions Microsoft Learn.
Extensibility: Open source code allows customization of payment gateways, analytics dashboards, loyalty modules, and theming with minimal effort bluebeeweb.com.
Key Benefits
Brand Control & Profitability
Zero commissions on direct orders retain full revenue, improving margins by up to 15 % bluebeeweb.com.
Custom branding from homepage to checkout strengthens customer loyalty.
Operational Efficiency
Real-time order routing to kitchen displays reduces manual errors and speeds service Toast POS.
Automated sales analytics empower data-driven menu and pricing decisions.
Enhanced Customer Experience
24/7 access and repeat-order functionality boost average order values and return rates.
Secure, seamless checkout flow reduces cart abandonment.
Ideal Use Cases
Independent Cafés & Bistros: Launch a professional online portal without custom development overhead.
Cloud Kitchens: Unify orders from aggregators into a single branded interface.
Hotels & Catering Services: Manage event orders, guest preferences, and payments in one system.
Educational Institutes: Full source code serves as a teaching aid for ASP.NET MVC and SQL Server integration.
Getting Started & Call to Action
Empower your restaurant with an enterprise-grade online ordering platform today: 👉 Download the ASP.NET Food Ordering Project ProjectsforEveryone.com
For customization or installation assistance, contact ProjectsForEveryone’s support at +91-8283017879 (10 AM–5 PM IST).
0 notes
Text
SQL Online Course with Certificate | Learn SQL Anytime
Master SQL from the comfort of your home with our comprehensive SQL online course with certificate. Perfect for beginners and professionals alike, this course is designed to equip you with the skills needed to work confidently with databases and data queries. Through step-by-step video tutorials, interactive assignments, and real-world projects, you’ll learn how to retrieve, manipulate, and analyze data using SQL across platforms like MySQL, PostgreSQL, and Microsoft SQL Server. The curriculum covers core concepts including SELECT statements, joins, subqueries, aggregations, and database functions—making it ideal for aspiring data analysts, developers, and business intelligence professionals. Upon completion, you’ll receive an industry-recognized certificate that showcases your expertise and can be added to your resume or LinkedIn profile. With lifetime access, self-paced modules, and expert support, this online SQL course is your gateway to mastering one of the most in-demand data skills today. Enroll now and become SQL-certified on your schedule.
0 notes
Text
Essential Technical Skills for a Successful Career in Business Analytics

If you're fascinated by the idea of bridging the gap between business acumen and analytical prowess, then a career in Business Analytics might be your perfect fit. But what specific technical skills are essential to thrive in this field?
Building Your Technical Arsenal
Data Retrieval and Manipulation: SQL proficiency is non-negotiable. Think of SQL as your scuba gear, allowing you to dive deep into relational databases and retrieve the specific data sets you need for analysis. Mastering queries, filters, joins, and aggregations will be your bread and butter.
Statistical Software: Unleash the analytical might of R and Python. These powerful languages go far beyond basic calculations. With R, you can create complex statistical models, perform hypothesis testing, and unearth hidden patterns in your data. Python offers similar functionalities and boasts a vast library of data science packages like NumPy, Pandas, and Scikit-learn, empowering you to automate tasks, build machine learning models, and create sophisticated data visualizations.
Data Visualization: Craft compelling data stories with Tableau, Power BI, and QlikView. These visualization tools are your paintbrushes, transforming raw data into clear, impactful charts, graphs, and dashboards. Master the art of storytelling with data, ensuring your insights resonate with both technical and non-technical audiences. Learn to create interactive dashboards that allow users to explore the data themselves, fostering a data-driven culture within the organization.
Business Intelligence (BI) Expertise: Become a BI whiz. BI software suites are the command centers of data management. Tools like Microsoft Power BI, Tableau Server, and Qlik Sense act as a central hub, integrating data from various sources (databases, spreadsheets, social media) and presenting it in a cohesive manner. Learn to navigate these platforms to create performance dashboards, track key metrics, and identify trends that inform strategic decision-making.
Beyond the Basics: Stay ahead of the curve. The technical landscape is ever-evolving. Consider exploring cloud computing platforms like Amazon Web Services (AWS), Microsoft Azure, and Google Cloud Platform (GCP) for data storage, management, and scalability. Familiarize yourself with data warehousing concepts and tools like Apache Spark for handling massive datasets efficiently.
.
Organizations Hiring Business Analytics and Data Analytics Professionals:
Information Technology (IT) and IT-enabled Services (ITES):
TCS, Infosys, Wipro, HCL, Accenture, Cognizant, Tech Mahindra (Business Analyst: Rs.400,000 - Rs.1,200,000, Data Analyst: Rs.500,000 - Rs.1,400,000)
Multinational Corporations with Indian operations:
IBM, Dell, HP, Google, Amazon, Microsoft (Business Analyst: Rs.500,000 - Rs.1,500,000, Data Analyst: Rs.600,000 - Rs.1,600,000)
Banking, Financial Services and Insurance (BFSI):
HDFC Bank, ICICI Bank, SBI, Kotak Mahindra Bank, Reliance Life Insurance, LIC (Business Analyst: Rs.550,000 - Rs.1,300,000, Data Analyst: Rs.650,000 - Rs.1,500,000)
E-commerce and Retail:
Flipkart, Amazon India, Myntra, Snapdeal, Big basket (Business Analyst: Rs. 450,000 - Rs. 1,000,000, Data Analyst: Rs. 550,000 - Rs. 1,200,000)
Management Consulting Firms:
McKinsey & Company, Bain & Company, Boston Consulting Group (BCG) (Business Analyst: Rs.700,000 - Rs.1,800,000, Data Scientist: Rs.800,000 - Rs.2,000,000)
By mastering this technical arsenal, you'll be well-equipped to transform from data novice to data maestro. Consider pursuing an MBA in Business Analytics, like the one offered by Poddar Management and Technical Campus, Jaipur. These programs often integrate industry projects and internships, providing valuable hands-on experience with the latest tools and technologies.
0 notes
Text
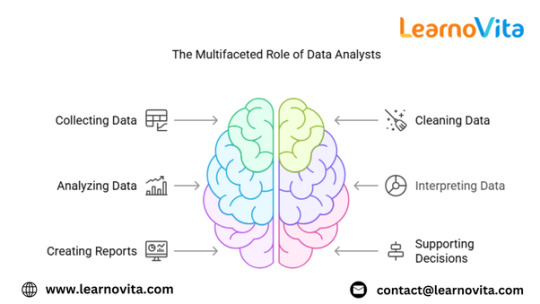
The Essential Tools Every Data Analyst Must Know
The role of a data analyst requires a strong command of various tools and technologies to efficiently collect, clean, analyze, and visualize data. These tools help transform raw data into actionable insights that drive business decisions. Whether you’re just starting your journey as a data analyst or looking to refine your skills, understanding the essential tools will give you a competitive edge in the field from the best Data Analytics Online Training.
SQL – The Backbone of Data Analysis
Structured Query Language (SQL) is one of the most fundamental tools for data analysts. It allows professionals to interact with databases, extract relevant data, and manipulate large datasets efficiently. Since most organizations store their data in relational databases like MySQL, PostgreSQL, and Microsoft SQL Server, proficiency in SQL is a must. Analysts use SQL to filter, aggregate, and join datasets, making it easier to conduct in-depth analysis.
Excel – The Classic Data Analysis Tool
Microsoft Excel remains a powerful tool for data analysis, despite the rise of more advanced technologies. With its built-in formulas, pivot tables, and data visualization features, Excel is widely used for quick data manipulation and reporting. Analysts often use Excel for smaller datasets and preliminary data exploration before transitioning to more complex tools. If you want to learn more about Data Analytics, consider enrolling in an Best Online Training & Placement programs . They often offer certifications, mentorship, and job placement opportunities to support your learning journey.
Python and R – The Power of Programming
Python and R are two of the most commonly used programming languages in data analytics. Python, with libraries like Pandas, NumPy, and Matplotlib, is excellent for data manipulation, statistical analysis, and visualization. R is preferred for statistical computing and machine learning tasks, offering packages like ggplot2 and dplyr for data visualization and transformation. Learning either of these languages can significantly enhance an analyst’s ability to work with large datasets and perform advanced analytics.
Tableau and Power BI – Turning Data into Visual Insights
Data visualization is a critical part of analytics, and tools like Tableau and Power BI help analysts create interactive dashboards and reports. Tableau is known for its ease of use and drag-and-drop functionality, while Power BI integrates seamlessly with Microsoft products and allows for automated reporting. These tools enable business leaders to understand trends and patterns through visually appealing charts and graphs.
Google Analytics – Essential for Web Data Analysis
For analysts working in digital marketing and e-commerce, Google Analytics is a crucial tool. It helps track website traffic, user behavior, and conversion rates. Analysts use it to optimize marketing campaigns, measure website performance, and make data-driven decisions to improve user experience.
BigQuery and Hadoop – Handling Big Data
With the increasing volume of data, analysts need tools that can process large datasets efficiently. Google BigQuery and Apache Hadoop are popular choices for handling big data. These tools allow analysts to perform large-scale data analysis and run queries on massive datasets without compromising speed or performance.
Jupyter Notebooks – The Data Analyst’s Playground
Jupyter Notebooks provide an interactive environment for coding, data exploration, and visualization. Data analysts use it to write and execute Python or R scripts, document their findings, and present results in a structured manner. It’s widely used in data science and analytics projects due to its flexibility and ease of use.
Conclusion
Mastering the essential tools of data analytics is key to becoming a successful data analyst. SQL, Excel, Python, Tableau, and other tools play a vital role in every stage of data analysis, from extraction to visualization. As businesses continue to rely on data for decision-making, proficiency in these tools will open doors to exciting career opportunities in the field of analytics.
0 notes
Text
Course Code: CSE 370
Course Name: Database Systems Semester: Summer 24 Lab 02: SQL Subqueries & Aggregate Functions Activity List ● All commands are shown in the red boxes. ● In the green box, write the appropriate query/answer. ● All new queries should be typed in the command window after mysql> ● Start by connecting to the server using: mysql -u root -p [password: <just press enter>] ● For more MySQL queries, go to…
0 notes
Text
Yes, moving from SAP ECC to SAP HANA can have several impacts on the existing ECC system. Here are the key areas affected:
1. Database Impact
SAP HANA is an in-memory database, whereas ECC traditionally runs on databases like Oracle, SQL Server, or IBM DB2.
You need to migrate from traditional databases to HANA if you move ECC to SAP Business Suite on HANA.
2. Performance Improvements
Faster processing due to in-memory computing.
Real-time analytics and reporting are significantly improved.
Transactions like MRP (Material Requirements Planning) run much faster in HANA.
3. Simplification of Data Structures
SAP HANA eliminates aggregate and index tables (e.g., no need for tables like BSEG, BSIS, BSAS in Finance).
The Universal Journal (ACDOCA) in S/4HANA replaces many traditional FI/CO tables.
4. Custom Code Adjustments (ABAP Impact)
Certain legacy ABAP programs may not work efficiently due to new HANA-optimized processing.
Need to adapt SQL queries for HANA, avoiding "SELECT *", using CDS Views, and enabling code pushdown.
SAP provides S/4HANA Readiness Checks to analyze custom code compatibility.
5. UI and User Experience Changes
ECC traditionally uses SAP GUI, but SAP Fiori is the default UI for S/4HANA.
Transactions are replaced by Fiori apps, enhancing usability.
6. Functional Module Changes
Some modules and transactions in ECC are simplified or removed in S/4HANA (e.g., SD Rebates replaced by Settlement Management).
SAP Business Partner (BP) replaces traditional customer/vendor master records.
7. Integration with Other Systems
SAP HANA integrates better with SAP BTP, IoT, AI, and ML technologies.
Legacy third-party systems may require interface adjustments for optimized performance.
8. Licensing & Cost Considerations
Moving to HANA involves licensing costs, which can be higher than traditional databases.
Total cost depends on whether you choose Suite on HANA (ECC on HANA) or S/4HANA
Call us on +91-84484 54549
Mail us on [email protected]
Website: Anubhav Online Trainings | UI5, Fiori, S/4HANA Trainings

0 notes
Text
Concatenating Row Values into a Single String in SQL Server
Concatenating text from multiple rows into a single text string in SQL Server can be achieved using different methods, depending on the version of SQL Server you are using. The most common approaches involve using the FOR XML PATH method for older versions, and the STRING_AGG function, which was introduced in SQL Server 2017. I’ll explain both methods. Using STRING_AGG (SQL Server 2017 and…
View On WordPress
#FOR XML PATH method#merging SQL rows#SQL Server concatenation#SQL Server text aggregation#STRING_AGG function
0 notes
Text
5 Powerful Programming Tools Every Data Scientist Needs

Data science is the field that involves statistics, mathematics, programming, and domain knowledge to extract meaningful insights from data. The explosion of big data and artificial intelligence has led to the use of specialized programming tools by data scientists to process, analyze, and visualize complex datasets efficiently.
Choosing the right tools is very important for anyone who wants to build a career in data science. There are many programming languages and frameworks, but some tools have gained popularity because of their robustness, ease of use, and powerful capabilities.
This article explores the top 5 programming tools in data science that every aspiring and professional data scientist should know.
Top 5 Programming Tools in Data Science
1. Python
Probably Python is the leading language used due to its versatility and simplicity together with extensive libraries. It applies various data science tasks, data cleaning, statistics, machine learning, and even deep learning applications.
Key Python Features for Data Science:
Packages & Framework: Pandas, NumPy, Matplotlib, Scikit-learn, TensorFlow, PyTorch
Easy to Learn; the syntax for programming is plain simple
High scalability; well suited for analyzing data at hand and enterprise business application
Community Support: One of the largest developer communities contributing to continuous improvement
Python's versatility makes it the go-to for professionals looking to be great at data science and AI.
2. R
R is another powerful programming language designed specifically for statistical computing and data visualization. It is extremely popular among statisticians and researchers in academia and industry.
Key Features of R for Data Science:
Statistical Computing: Inbuilt functions for complex statistical analysis
Data Visualization: Libraries like ggplot2 and Shiny for interactive visualizations
Comprehensive Packages: CRAN repository hosts thousands of data science packages
Machine Learning Integration: Supports algorithms for predictive modeling and data mining
R is a great option if the data scientist specializes in statistical analysis and data visualization.
3. SQL (Structured Query Language)
SQL is important for data scientists to query, manipulate, and manage structured data efficiently. The relational databases contain huge amounts of data; therefore, SQL is an important skill in data science.
Important Features of SQL for Data Science
Data Extraction: Retrieve and filter large datasets efficiently
Data Manipulation: Aggregate, join, and transform datasets for analysis
Database Management: Supports relational database management systems (RDBMS) such as MySQL, PostgreSQL, and Microsoft SQL Server
Integration with Other Tools: Works seamlessly with Python, R, and BI tools
SQL is indispensable for data professionals who handle structured data stored in relational databases.
4. Apache Spark
Apache Spark is the most widely utilized open-source, big data processing framework for very large-scale analytics and machine learning. It excels in performance for handling a huge amount of data that no other tool would be able to process.
Core Features of Apache Spark for Data Science:
Data Processing: Handle large datasets on high speed.
In-Memory Computation: Better performance in comparison to other disk-based systems
MLlib: A Built-in Machine Library for Scalable AI Models.
Compatibility with Other Tools: Supports Python (PySpark), R (SparkR), and SQL
Apache Spark is best suited for data scientists working on big data and real-time analytics projects.
5. Tableau
Tableau is one of the most powerful data visualization tools used in data science. Users can develop interactive and informative dashboards without needing extensive knowledge of coding.
Main Features of Tableau for Data Science:
Drag-and-Drop Interface: Suitable for non-programmers
Advanced Visualizations: Complex graphs, heatmaps, and geospatial data can be represented
Data Source Integration: Database, cloud storage, and APIs integration
Real-Time Analytics: Fast decision-making is achieved through dynamic reporting
Tableau is a very popular business intelligence and data storytelling tool used for making data-driven decisions available to non-technical stakeholders.
Data Science and Programming Tools in India
This led to India's emergence as one of the data science and AI hubs, which has seen most businesses, start-ups, and government organizations take significant investments into AI-driven solutions. The increase in demand for data scientists boosted the adoption rate of programming tools such as Python, R, SQL, and Apache Spark.
Government and Industrial Initiatives Gaining Momentum Towards Data Science Adoption in India
National AI Strategy: NITI Aayog's vision for AI driven economic transformation.
Digital India Initiative: This has promoted data-driven governance and integration of AI into public services.
AI Adoption in Enterprises: The big enterprises TCS, Infosys, and Reliance have been adopting AI for business optimisation.
Emerging Startups in AI & Analytics: Many Indian startups have been creating AI-driven products by using top data science tools.
Challenges to Data Science Growth in India
Some of the challenges in data science growth despite rapid advancements in India are:
Skill Gaps: Demand outstrips supply.
Data Privacy Issues: The emphasis lately has been on data protection laws such as the Data Protection Bill.
Infrastructure Constraint: Computational high-end resources are not accessible to all companies.
To bridge this skill gap, many online and offline programs assist students and professionals in learning data science from scratch through comprehensive training in programming tools, AI, and machine learning.
Kolkata Becoming the Next Data Science Hub
Kolkata is soon emerging as an important center for education and research in data science with its rich academic excellence and growth in the IT sector. Increasing adoption of AI across various sectors has resulted in businesses and institutions in Kolkata concentrating on building essential data science skills in professionals.
Academic Institutions and AI Education
Multiple institutions and private learning centers provide exclusive AI Courses Kolkata, dealing with the must-have programming skills such as Python, R, SQL, and Spark. Hands-on training sessions are provided by these courses about data analytics, machine learning, and AI.
Industries Using Data Science in Kolkata
Banking & Finance: Artificial intelligence-based risk analysis and fraud detection systems
Healthcare: Data-driven Predictive Analytics of patient care optimisation
E-Commerce & Retail: Customized recommendations & customer behavior analysis
EdTech: AI based adaptive learning environment for students.
Future Prospects of Data Science in Kolkata
Kolkata would find a vital place in India's data-driven economy because more and more businesses as well as educational institutions are putting money into AI and data science. The city of Kolkata is currently focusing strategically on technology education and research in AI for future innovations in AI and data analytics.
Conclusion
Over the years, with the discovery of data science, such programming tools like Python and R, SQL, Apache Spark, and Tableau have become indispensable in the world of professionals. They help in analyzing data, building AI models, and creating impactful visualizations.
Government initiatives and investments by the enterprises have seen India adapt rapidly to data science and AI, thus putting a high demand on skilled professionals. As a beginner, the doors are open with many educational programs to learn data science with hands-on experience using the most popular tools.
Kolkata is now emerging as a hub for AI education and innovation, which will provide world-class learning opportunities to aspiring data scientists. Mastery of these programming tools will help professionals stay ahead in the ever-evolving data science landscape.
0 notes
Text
Explore how ADF integrates with Azure Synapse for big data processing.
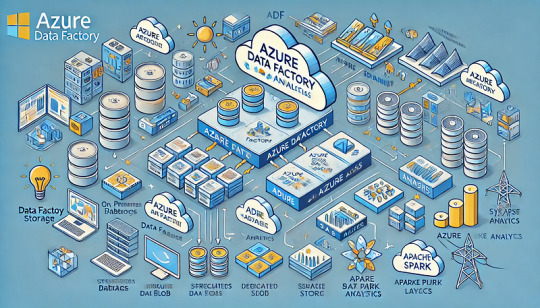
How Azure Data Factory (ADF) Integrates with Azure Synapse for Big Data Processing
Azure Data Factory (ADF) and Azure Synapse Analytics form a powerful combination for handling big data workloads in the cloud.
ADF enables data ingestion, transformation, and orchestration, while Azure Synapse provides high-performance analytics and data warehousing. Their integration supports massive-scale data processing, making them ideal for big data applications like ETL pipelines, machine learning, and real-time analytics. Key Aspects of ADF and Azure Synapse Integration for Big Data Processing
Data Ingestion at Scale ADF acts as the ingestion layer, allowing seamless data movement into Azure Synapse from multiple structured and unstructured sources, including: Cloud Storage: Azure Blob Storage, Amazon S3, Google
Cloud Storage On-Premises Databases: SQL Server, Oracle, MySQL, PostgreSQL Streaming Data Sources: Azure Event Hubs, IoT Hub, Kafka
SaaS Applications: Salesforce, SAP, Google Analytics 🚀 ADF’s parallel processing capabilities and built-in connectors make ingestion highly scalable and efficient.
2. Transforming Big Data with ETL/ELT ADF enables large-scale transformations using two primary approaches: ETL (Extract, Transform, Load): Data is transformed in ADF’s Mapping Data Flows before loading into Synapse.
ELT (Extract, Load, Transform): Raw data is loaded into Synapse, where transformation occurs using SQL scripts or Apache Spark pools within Synapse.
🔹 Use Case: Cleaning and aggregating billions of rows from multiple sources before running machine learning models.
3. Scalable Data Processing with Azure Synapse Azure Synapse provides powerful data processing features: Dedicated SQL Pools: Optimized for high-performance queries on structured big data.
Serverless SQL Pools: Enables ad-hoc queries without provisioning resources.
Apache Spark Pools: Runs distributed big data workloads using Spark.
💡 ADF pipelines can orchestrate Spark-based processing in Synapse for large-scale transformations.
4. Automating and Orchestrating Data Pipelines ADF provides pipeline orchestration for complex workflows by: Automating data movement between storage and Synapse.
Scheduling incremental or full data loads for efficiency. Integrating with Azure Functions, Databricks, and Logic Apps for extended capabilities.
⚙️ Example: ADF can trigger data processing in Synapse when new files arrive in Azure Data Lake.
5. Real-Time Big Data Processing ADF enables near real-time processing by: Capturing streaming data from sources like IoT devices and event hubs. Running incremental loads to process only new data.
Using Change Data Capture (CDC) to track updates in large datasets.
📊 Use Case: Ingesting IoT sensor data into Synapse for real-time analytics dashboards.
6. Security & Compliance in Big Data Pipelines Data Encryption: Protects data at rest and in transit.
Private Link & VNet Integration: Restricts data movement to private networks.
Role-Based Access Control (RBAC): Manages permissions for users and applications.
🔐 Example: ADF can use managed identity to securely connect to Synapse without storing credentials.
Conclusion
The integration of Azure Data Factory with Azure Synapse Analytics provides a scalable, secure, and automated approach to big data processing.
By leveraging ADF for data ingestion and orchestration and Synapse for high-performance analytics, businesses can unlock real-time insights, streamline ETL workflows, and handle massive data volumes with ease.
WEBSITE: https://www.ficusoft.in/azure-data-factory-training-in-chennai/
0 notes
Text
Python Full Stack Development Course AI + IoT Integrated | TechEntry
Join TechEntry's No.1 Python Full Stack Developer Course in 2025. Learn Full Stack Development with Python and become the best Full Stack Python Developer. Master Python, AI, IoT, and build advanced applications.
Why Settle for Just Full Stack Development? Become an AI Full Stack Engineer!
Transform your development expertise with our AI-focused Full Stack Python course, where you'll master the integration of advanced machine learning algorithms with Python’s robust web frameworks to build intelligent, scalable applications from frontend to backend.
Kickstart Your Development Journey!
Frontend Development
React: Build Dynamic, Modern Web Experiences:
What is Web?
Markup with HTML & JSX
Flexbox, Grid & Responsiveness
Bootstrap Layouts & Components
Frontend UI Framework
Core JavaScript & Object Orientation
Async JS promises, async/await
DOM & Events
Event Bubbling & Delegation
Ajax, Axios & fetch API
Functional React Components
Props & State Management
Dynamic Component Styling
Functions as Props
Hooks in React: useState, useEffect
Material UI
Custom Hooks
Supplement: Redux & Redux Toolkit
Version Control: Git & Github
Angular: Master a Full-Featured Framework:
What is Web?
Markup with HTML & Angular Templates
Flexbox, Grid & Responsiveness
Angular Material Layouts & Components
Core JavaScript & TypeScript
Asynchronous Programming Promises, Observables, and RxJS
DOM Manipulation & Events
Event Binding & Event Bubbling
HTTP Client, Ajax, Axios & Fetch API
Angular Components
Input & Output Property Binding
Dynamic Component Styling
Services & Dependency Injection
Angular Directives (Structural & Attribute)
Routing & Navigation
Reactive Forms & Template-driven Forms
State Management with NgRx
Custom Pipes & Directives
Version Control: Git & GitHub
Backend
Python
Python Overview and Setup
Networking and HTTP Basics
REST API Overview
Setting Up a Python Environment (Virtual Environments, Pip)
Introduction to Django Framework
Django Project Setup and Configuration
Creating Basic HTTP Servers with Django
Django URL Routing and Views
Handling HTTP Requests and Responses
JSON Parsing and Form Handling
Using Django Templates for Rendering HTML
CRUD API Creation and RESTful Services with Django REST Framework
Models and Database Integration
Understanding SQL and NoSQL Database Concepts
CRUD Operations with Django ORM
Database Connection Setup in Django
Querying and Data Handling with Django ORM
User Authentication Basics in Django
Implementing JSON Web Tokens (JWT) for Security
Role-Based Access Control
Advanced API Concepts: Pagination, Filtering, and Sorting
Caching Techniques for Faster Response
Rate Limiting and Security Practices
Deployment of Django Applications
Best Practices for Django Development
Database
MongoDB (NoSQL)
Introduction to NoSQL and MongoDB
Understanding Collections and Documents
Basic CRUD Operations in MongoDB
MongoDB Query Language (MQL) Basics
Inserting, Finding, Updating, and Deleting Documents
Using Filters and Projections in Queries
Understanding Data Types in MongoDB
Indexing Basics in MongoDB
Setting Up a Simple MongoDB Database (e.g., MongoDB Atlas)
Connecting to MongoDB from a Simple Application
Basic Data Entry and Querying with MongoDB Compass
Data Modeling in MongoDB: Embedding vs. Referencing
Overview of Aggregation Framework in MongoDB
SQL
Introduction to SQL (Structured Query Language)
Basic CRUD Operations: Create, Read, Update, Delete
Understanding Tables, Rows, and Columns
Primary Keys and Unique Constraints
Simple SQL Queries: SELECT, WHERE, and ORDER BY
Filtering Data with Conditions
Using Aggregate Functions: COUNT, SUM, AVG
Grouping Data with GROUP BY
Basic Joins: Combining Tables (INNER JOIN)
Data Types in SQL (e.g., INT, VARCHAR, DATE)
Setting Up a Simple SQL Database (e.g., SQLite or MySQL)
Connecting to a SQL Database from a Simple Application
Basic Data Entry and Querying with a GUI Tool
Data Validation Basics
Overview of Transactions and ACID Properties
AI and IoT
Introduction to AI Concepts
Getting Started with Python for AI
Machine Learning Essentials with scikit-learn
Introduction to Deep Learning with TensorFlow and PyTorch
Practical AI Project Ideas
Introduction to IoT Fundamentals
Building IoT Solutions with Python
IoT Communication Protocols
Building IoT Applications and Dashboards
IoT Security Basics
TechEntry Highlights
In-Office Experience: Engage in a collaborative in-office environment (on-site) for hands-on learning and networking.
Learn from Software Engineers: Gain insights from experienced engineers actively working in the industry today.
Career Guidance: Receive tailored advice on career paths and job opportunities in tech.
Industry Trends: Explore the latest software development trends to stay ahead in your field.
1-on-1 Mentorship: Access personalized mentorship for project feedback and ongoing professional development.
Hands-On Projects: Work on real-world projects to apply your skills and build your portfolio.
What You Gain:
A deep understanding of Front-end React.js and Back-end Python.
Practical skills in AI tools and IoT integration.
The confidence to work on real-time solutions and prepare for high-paying jobs.
The skills that are in demand across the tech industry, ensuring you're not just employable but sought-after.
Frequently Asked Questions
Q: What is Python, and why should I learn it?
A: Python is a versatile, high-level programming language known for its readability and ease of learning. It's widely used in web development, data science, artificial intelligence, and more.
Q: What are the prerequisites for learning Angular?
A: A basic understanding of HTML, CSS, and JavaScript is recommended before learning Angular.
Q: Do I need any prior programming experience to learn Python?
A: No, Python is beginner-friendly and designed to be accessible to those with no prior programming experience.
Q: What is React, and why use it?
A: React is a JavaScript library developed by Facebook for building user interfaces, particularly for single-page applications. It offers reusable components, fast performance, and one-way data flow.
Q: What is Django, and why should I learn it?
A: Django is a high-level web framework for building web applications quickly and efficiently using Python. It includes many built-in features for web development, such as authentication and an admin interface.
Q: What is the virtual DOM in React?
A: The virtual DOM represents the real DOM in memory. React uses it to detect changes and update the real DOM as needed, improving UI performance.
Q: Do I need to know Python before learning Django?
A: Yes, a basic understanding of Python is essential before diving into Django.
Q: What are props in React?
A: Props in React are objects used to pass information to a component, allowing data to be shared and utilized within the component.
Q: Why should I learn Angular?
A: Angular is a powerful framework for building dynamic, single-page web applications. It enhances your ability to create scalable and maintainable web applications and is highly valued in the job market.
Q: What is the difference between class-based components and functional components with hooks in React?
A: Class-based components maintain state via instances, while functional components use hooks to manage state, making them more efficient and popular.
For more, visit our website:
https://techentry.in/courses/python-fullstack-developer-course
0 notes
Text
Power BI Training | Power BI Online Training in Hyderabad
How to Use DAX in Power BI for Advanced Analytics
Power BI Training is a leading tool in the field of data analytics and visualization, providing businesses with the insights they need to make informed decisions. One of its most powerful features is Data Analysis Expressions (DAX), a formula language that allows users to create advanced calculations and models. This article explores how DAX can be used in Power BI for advanced analytics, unlocking its full potential for data professionals. Power BI Online Training in Hyderabad
Understanding DAX Basics
DAX is specifically designed for data modelling in Power BI, Excel, and SQL Server Analysis Services. It enables users to go beyond basic aggregations by crafting custom calculations. Some key features of DAX include:
Functions: DAX includes a wide range of functions for mathematical, statistical, and text operations.
Context Awareness: DAX formulas work within two contexts—row context and filter context—allowing calculations on both individual rows and filtered data sets.
Custom Calculations: Users can create calculated columns for static results or measures for dynamic, on-the-fly calculations.
These capabilities make DAX essential for building robust and interactive analytics in Power BI Training.
Essential DAX Functions for Advanced Analytics
To perform advanced analytics, it’s important to understand some key DAX functions that are widely used in Power BI projects.
CALCULATE Function
The CALCULATE function is incredibly versatile, enabling users to modify filter contexts dynamically. For instance, you can compute sales for specific time periods or conditions.
FILTER Function
FILTER allows users to narrow down data to meet certain criteria. This is particularly useful when working with subsets of data for detailed analysis.
Time Intelligence Functions
DAX provides built-in time intelligence functions like TOTALYTD (Year-to-Date totals), DATESBETWEEN (for custom date ranges), and PREVIOUSMONTH (to analyze historical trends). These functions make temporal data analysis more straightforward.
RANKX Function
RANKX is used to rank items, such as products or customers, based on specific metrics like sales or profitability. This is especially useful for comparisons and performance evaluations.
Applications of DAX in Advanced Analytics
With a solid understanding of DAX functions, professionals can tackle complex analytical tasks. Here are some practical applications: Power BI Online Training in Hyderabad
Customer Segmentation
DAX allows you to categorize customers into segments based on their purchasing behaviour. For example, customers can be classified as high-value, medium-value, or low-value based on their total spending. This segmentation provides actionable insights for targeted marketing campaigns.
Profitability Analysis
DAX helps businesses calculate profitability metrics dynamically. For instance, by dividing total profit by revenue, companies can monitor profit margins across products, regions, or time periods.
Trend Forecasting
Using rolling averages or moving totals, DAX enables businesses to identify trends and patterns in data. For instance, calculating a 30-day rolling average for sales can reveal performance fluctuations over time.
Best Practices for Using DAX
Understand Contexts
Context plays a critical role in DAX. Filter and row contexts impact how calculations are performed, so understanding these concepts is essential for accurate results.
Optimize Performance
Complex DAX formulas can slow down report performance. It’s best to use efficient functions and keep calculations as streamlined as possible.
Use Variables
Variables, defined using the VAR keyword, can improve formula readability and performance. By storing intermediate results, variables also make troubleshooting easier.
Test Formulas Step-by-Step
When building advanced analytics, test DAX formulas incrementally. This approach ensures accuracy and simplifies debugging.
Conclusion
Mastering DAX in Power BI is essential for unlocking advanced analytics capabilities. Whether it’s customer segmentation, profitability analysis, or trend forecasting, DAX empowers professionals to extract deeper insights and build more interactive dashboards. By learning and applying key DAX functions, understanding contexts, and following best practices, users can take their Power BI skills to the next level.
Start small with basic calculations and gradually progress to more complex scenarios. With consistent practice, you’ll be well on your way to mastering DAX and creating impactful analytics that drive decision-making.
Visualpath is the Leading and Best Institute for learning in Hyderabad. We provide Power BI Course Online. You will get the best course at an affordable cost.
Attend Free Demo
Call on – +91-9989971070
Blog: https://visualpathblogs.com/
What’s App: https://www.whatsapp.com/catalog/919989971070/
Visit: https://www.visualpath.in/powerbi-training.html
#Power BI Training#Power BI Online Training#Power BI Course Online#Power BI Training in Hyderabad#Power BI Training in Ameerpet#Power BI Training Institute in Hyderabad#Power BI Online Training Hyderabad#Power BI Course in Hyderabad
1 note
·
View note