#air pollution data
Text
Worldview Adds New Data Layers from NASA's TEMPO Mission
"NASA Worldview, an interactive mapping and visualization tool, now offers air pollution data imagery layers for North America from NASA's TEMPO mission— including data and imagery for clouds, formaldehyde, nitrogen dioxide, and ozone" #NASAEarthData
#Worldview Adds New Data Layers from NASA's TEMPO Mission#NASA#TEMPO Mission#air pollution data#NASA Earth Data#satellite cloud study#satellite ozone study#satellite dioxide data#air pollution imagery
0 notes
Text
Integration of Air Quality Data in Smart Cities: Transforming Urban Planning through API-driven Monitoring Systems
Introduction:
In an era marked by rapid urbanization, the need for sustainable and healthy urban environments has become paramount. Smart cities are leveraging cutting-edge technologies to address various challenges, and one crucial aspect is monitoring and managing air pollution. This article explores how cities are integrating Air Quality APIs to monitor and manage air pollution, showcasing case studies of successful implementations and the profound impact on urban planning.
Understanding Air Quality APIs and Data:
Before delving into case studies, it's essential to grasp the fundamentals of Air Quality APIs and data. Air Quality APIs provide real-time and historical information on various air pollutants, typically measured using ground-level sensors. These sensors collect data on pollutants such as particulate matter (PM), nitrogen dioxide (NO2), sulfur dioxide (SO2), ozone (O3), and carbon monoxide (CO). The APIs process this data and present it in the form of Air Quality Indices (AQI), offering a comprehensive snapshot of air quality.
The Role of Air Quality Data in Smart Cities:
Smart cities recognize the critical role of air quality data in creating healthier living environments. By integrating Air Quality APIs, city officials gain access to accurate and timely information, enabling them to make informed decisions for public health and urban development. The data empowers cities to identify pollution hotspots, assess the effectiveness of pollution mitigation strategies, and engage in evidence-based policymaking.
Case Studies:
Beijing, China:
Beijing, notorious for its air pollution, has implemented a robust air quality monitoring system driven by APIs. The city employs a network of sensors strategically placed across urban areas. These sensors continuously collect data on pollutants, which is then fed into an Air Quality API. The city's real-time air quality monitoring platform allows residents to access up-to-the-minute information on pollution levels, fostering public awareness.
The impact on urban planning in Beijing has been substantial. The city authorities use the data to enforce strict emission controls, adjust traffic management strategies during peak pollution hours, and optimize green spaces to act as urban lungs. The integration of Air Quality APIs has played a pivotal role in Beijing's transition towards a greener and healthier metropolis.
Copenhagen, Denmark:
Copenhagen exemplifies how a smart city can use Air Quality APIs for proactive urban planning. The city's air quality monitoring system combines data from sensors with environmental factors such as weather conditions and traffic patterns. By integrating this information through an API, Copenhagen can predict pollution levels and take preventive measures.
The impact on urban planning is evident in Copenhagen's emphasis on sustainable transportation. The city uses air quality data to optimize traffic flow, promote cycling, and incentivize electric vehicles. This integration has not only improved air quality but has also influenced the city's overall approach to transportation planning, fostering a more sustainable and resilient urban infrastructure.
Los Angeles, USA:
Los Angeles, grappling with longstanding air quality challenges, has embraced Air Quality APIs as part of its environmental management strategy. The city's extensive monitoring network feeds data into APIs, generating insights into the correlation between air quality and health outcomes.
In terms of urban planning, Los Angeles has used this data to designate low-emission zones, encouraging industries and transportation services to adopt cleaner technologies. Additionally, the city has prioritized green infrastructure projects in areas with high pollution levels, demonstrating a commitment to equitable urban development.
Impact on Urban Planning:
The integration of Air Quality APIs in smart cities has a profound impact on urban planning. Here are key ways in which it transforms the planning process:
Precision in Infrastructure Development: Air quality data allows cities to pinpoint areas with high pollution levels. This precision enables urban planners to design infrastructure projects that prioritize green spaces, implement effective traffic management, and establish emission controls in targeted locations.
Public Health-Oriented Planning: Cities can incorporate air quality data into health impact assessments for proposed developments. This ensures that urban planning decisions prioritize public health, leading to the creation of healthier living environments.
Dynamic Traffic Management: Real-time air quality data facilitates dynamic traffic management. Cities can adjust traffic flow, reroute vehicles during peak pollution hours, and incentivize the use of public transportation or cleaner modes of commuting.
Community Engagement: The availability of air quality data empowers communities to actively engage in urban planning. Informed residents can advocate for sustainable development, participate in decision-making processes, and hold authorities accountable for air quality improvements.
Resilient and Sustainable Cities: Smart cities leveraging Air Quality APIs are better equipped to build resilient and sustainable urban environments. By considering air quality in every aspect of planning, cities can reduce pollution, enhance quality of life, and contribute to a global effort to combat climate change.
Challenges and Future Directions:
While the integration of Air Quality APIs presents significant benefits, challenges persist. These include ensuring data accuracy, addressing sensor calibration issues, and maintaining the security of sensitive information. Additionally, future developments may involve the incorporation of machine learning for more accurate predictive modeling and the expansion of monitoring networks for broader coverage.
Conclusion:
The integration of Air Quality APIs in smart cities marks a transformative shift in urban planning. By harnessing the power of real-time air quality data, cities can create healthier, more sustainable environments for their residents. The case studies of Beijing, Copenhagen, and Los Angeles exemplify the positive impact of API-driven air quality monitoring systems on urban planning. As cities continue to evolve, the integration of such technologies will play a pivotal role in shaping a cleaner and more resilient urban future.
0 notes
Text
So I just won a competition for my research project…
MOM DAD IM A REAL SCIENTIST!!
#pretty crazy but yeah#we were doing a country wide data analysis on breast cancer incidence rates and ambient air pollution#multiple linear regression and what not#I wrote a manuscript and everything it was so cool!#now we present at nationals and have 0 chance of winning#but wtv#the process was more than satisfying!#studyblr#not studyspo#stem academia
54 notes
·
View notes
Text
Q&A: Claire Walsh on how J-PAL’s King Climate Action Initiative tackles the twin climate and poverty crises
New Post has been published on https://thedigitalinsider.com/qa-claire-walsh-on-how-j-pals-king-climate-action-initiative-tackles-the-twin-climate-and-poverty-crises/
Q&A: Claire Walsh on how J-PAL’s King Climate Action Initiative tackles the twin climate and poverty crises

The King Climate Action Initiative (K-CAI) is the flagship climate change program of the Abdul Latif Jameel Poverty Action Lab (J-PAL), which innovates, tests, and scales solutions at the nexus of climate change and poverty alleviation, together with policy partners worldwide.
Claire Walsh is the associate director of policy at J-PAL Global at MIT. She is also the project director of K-CAI. Here, Walsh talks about the work of K-CAI since its launch in 2020, and describes the ways its projects are making a difference. This is part of an ongoing series exploring how the MIT School of Humanities, Arts, and Social Sciences is addressing the climate crisis.
Q: According to the King Climate Action Initiative (K-CAI), any attempt to address poverty effectively must also simultaneously address climate change. Why is that?
A: Climate change will disproportionately harm people in poverty, particularly in low- and middle-income countries, because they tend to live in places that are more exposed to climate risk. These are nations in sub-Saharan Africa and South and Southeast Asia where low-income communities rely heavily on agriculture for their livelihoods, so extreme weather — heat, droughts, and flooding — can be devastating for people’s jobs and food security. In fact, the World Bank estimates that up to 130 million more people may be pushed into poverty by climate change by 2030.
This is unjust because these countries have historically emitted the least; their people didn’t cause the climate crisis. At the same time, they are trying to improve their economies and improve people’s welfare, so their energy demands are increasing, and they are emitting more. But they don’t have the same resources as wealthy nations for mitigation or adaptation, and many developing countries understandably don’t feel eager to put solving a problem they didn’t create at the top of their priority list. This makes finding paths forward to cutting emissions on a global scale politically challenging.
For these reasons, the problems of enhancing the well-being of people experiencing poverty, addressing inequality, and reducing pollution and greenhouse gases are inextricably linked.
Q: So how does K-CAI tackle this hybrid challenge?
A: Our initiative is pretty unique. We are a competitive, policy-based research and development fund that focuses on innovating, testing, and scaling solutions. We support researchers from MIT and other universities, and their collaborators, who are actually implementing programs, whether NGOs [nongovernmental organizations], government, or the private sector. We fund pilots of small-scale ideas in a real-world setting to determine if they hold promise, followed by larger randomized, controlled trials of promising solutions in climate change mitigation, adaptation, pollution reduction, and energy access. Our goal is to determine, through rigorous research, if these solutions are actually working — for example, in cutting emissions or protecting forests or helping vulnerable communities adapt to climate change. And finally, we offer path-to-scale grants which enable governments and NGOs to expand access to programs that have been tested and have strong evidence of impact.
We think this model is really powerful. Since we launched in 2020, we have built a portfolio of over 30 randomized evaluations and 13 scaling projects in more than 35 countries. And to date, these projects have informed the scale ups of evidence-based climate policies that have reached over 15 million people.
Q: It seems like K-CAI is advancing a kind of policy science, demanding proof of a program’s capacity to deliver results at each stage.
A: This is one of the factors that drew me to J-PAL back in 2012. I majored in anthropology and studied abroad in Uganda. From those experiences I became very passionate about pursuing a career focused on poverty reduction. To me, it is unfair that in a world full of so much wealth and so much opportunity there exists so much extreme poverty. I wanted to dedicate my career to that, but I’m also a very detail-oriented nerd who really cares about whether a program that claims to be doing something for people is accomplishing what it claims.
It’s been really rewarding to see demand from governments and NGOs for evidence-informed policymaking grow over my 12 years at J-PAL. This policy science approach holds exciting promise to help transform public policy and climate policy in the coming decades.
Q: Can you point to K-CAI-funded projects that meet this high bar and are now making a significant impact?
A: Several examples jump to mind. In the state of Gujarat, India, pollution regulators are trying to cut particulate matter air pollution, which is devastating to human health. The region is home to many major industries whose emissions negatively affect most of the state’s 70 million residents.
We partnered with state pollution regulators — kind of a regional EPA [Environmental Protection Agency] — to test an emissions trading scheme that is used widely in the U.S. and Europe but not in low- and middle-income countries. The government monitors pollution levels using technology installed at factories that sends data in real time, so the regulator knows exactly what their emissions look like. The regulator sets a cap on the overall level of pollution, allocates permits to pollute, and industries can trade emissions permits.
In 2019, researchers in the J-PAL network conducted the world’s first randomized, controlled trial of this emissions trading scheme and found that it cut pollution by 20 to 30 percent — a surprising reduction. It also reduced firms’ costs, on average, because the costs of compliance went down. The state government was eager to scale up the pilot, and in the past two years, two other cities, including Ahmedabad, the biggest city in the state, have adopted the concept.
We are also supporting a project in Niger, whose economy is hugely dependent on rain-fed agriculture but with climate change is experiencing rapid desertification. Researchers in the J-PAL network have been testing training farmers in a simple, inexpensive rainwater harvesting technique, where farmers dig a half-moon-shaped hole called a demi-lune right before the rainy season. This demi-lune feeds crops that are grown directly on top of it, and helps return land that resembled flat desert to arable production.
Researchers found that training farmers in this simple technology increased adoption from 4 percent to 94 percent and that demi-lunes increased agricultural output and revenue for farmers from the first year. K-CAI is funding a path-to-scale grant so local implementers can teach this technique to over 8,000 farmers and build a more cost-effective program model. If this takes hold, the team will work with local partners to scale the training to other relevant regions of the country and potentially other countries in the Sahel.
One final example that we are really proud of, because we first funded it as a pilot and now it’s in the path to scale phase: We supported a team of researchers working with partners in Bangladesh trying to reduce carbon emissions and other pollution from brick manufacturing, an industry that generates 17 percent of the country’s carbon emissions. The scale of manufacturing is so great that at some times of year, Dhaka (the capital of Bangladesh) looks like Mordor.
Workers form these bricks and stack hundreds of thousands of them, which they then fire by burning coal. A team of local researchers and collaborators from our J-PAL network found that you can reduce the amount of coal needed for the kilns by making some low-cost changes to the manufacturing process, including stacking the bricks in a way that increases airflow in the kiln and feeding the coal fires more frequently in smaller rather than larger batches.
In the randomized, controlled trial K-CAI supported, researchers found that this cut carbon and pollution emissions significantly, and now the government has invited the team to train 1,000 brick manufacturers in Dhaka in these techniques.
Q: These are all fascinating and powerful instances of implementing ideas that address a range of problems in different parts of the world. But can K-CAI go big enough and fast enough to take a real bite out of the twin poverty and climate crisis?
A: We’re not trying to find silver bullets. We are trying to build a large playbook of real solutions that work to solve specific problems in specific contexts. As you build those up in the hundreds, you have a deep bench of effective approaches to solve problems that can add up in a meaningful way. And because J-PAL works with governments and NGOs that have the capacity to take the research into action, since 2003, over 600 million people around the world have been reached by policies and programs that are informed by evidence that J-PAL-affiliated researchers produced. While global challenges seem daunting, J-PAL has shown that in 20 years we can achieve a great deal, and there is huge potential for future impact.
But unfortunately, globally, there is an underinvestment in policy innovation to combat climate change that may generate quicker, lower-cost returns at a large scale — especially in policies that determine which technologies get adopted or commercialized. For example, a lot of the huge fall in prices of renewable energy was enabled by early European government investments in solar and wind, and then continuing support for innovation in renewable energy.
That’s why I think social sciences have so much to offer in the fight against climate change and poverty; we are working where technology meets policy and where technology meets real people, which often determines their success or failure. The world should be investing in policy, economic, and social innovation just as much as it is investing in technological innovation.
Q: Do you need to be an optimist in your job?
A: I am half-optimist, half-pragmatist. I have no control over the climate change outcome for the world. And regardless of whether we can successfully avoid most of the potential damages of climate change, when I look back, I’m going to ask myself, “Did I fight or not?” The only choice I have is whether or not I fought, and I want to be a fighter.
#000#Abdul Latif Jameel Poverty Action Lab (J-PAL)#Africa#agriculture#air#air pollution#Anthropology#approach#Arts#Asia#biggest city#carbon#carbon emissions#career#challenge#change#cities#Cleaner industry#climate#climate change#climate crisis#coal#Collaboration#compliance#crops#cutting#data#deal#Developing countries#development
2 notes
·
View notes
Text
NASA Data Helps Protect US Embassy Staff from Polluted Air
United States embassies and consulates, along with American citizens traveling and living abroad, now have a powerful tool to protect against polluted air, thanks to a collaboration between NASA and the U.S. State Department. Since 2020, ZephAir has provided real-time air quality data for about 75 U.S. diplomatic posts. Now, the public tool includes three-day […]
from NASA https://ift.tt/A4GBrC6
0 notes
Text
Temperatures 1.5C above pre-industrial era average for 12 months, data shows
#temperature#global warming#industrial#data#climate change#pollution#environmental#ausgov#politas#auspol#tasgov#taspol#australia#fuck neoliberals#neoliberal capitalism#anthony albanese#albanese government#co2 emissions#co2#methane#carbon dioxide#pollutants#polluted water#polluters#polluted air#environment#enviroment art#enviromentalism#environmetalists#climate crisis
1 note
·
View note
Text

Reverse Osmosis Plant in Trivandrum
Sewage Treatment company in Trivandrum
#purification#waste management#wastewatertreatment#water purifier#waterpurifier#watercolor#watertreatment#startup#effluent treatment plant#kerala#keralis#water plants#waterfall#air purifier#trivium#zero waste#wastewater data#wasteland#recycling#pollution#environment#sustainable#reverse osmosis#osmosisdreams#sewage water treatment#sewage treatment plant manufacturer#ultrafiltration#ultraviolet#ultraverse
1 note
·
View note
Text
"A century of gradual reforestation across the American East and Southeast has kept the region cooler than it otherwise would have become, a new study shows.
The pioneering study of progress shows how the last 25 years of accelerated reforestation around the world might significantly pay off in the second half of the 21st century.
Using a variety of calculative methods and estimations based on satellite and temperature data from weather stations, the authors determined that forests in the eastern United States cool the land surface by 1.8 – 3.6°F annually compared to nearby grasslands and croplands, with the strongest effect seen in summer, when cooling amounts to 3.6 – 9°F.
The younger the forest, the more this cooling effect was detected, with forest trees between 20 and 40 years old offering the coolest temperatures underneath.
“The reforestation has been remarkable and we have shown this has translated into the surrounding air temperature,” Mallory Barnes, an environmental scientist at Indiana University who led the research, told The Guardian.
“Moving forward, we need to think about tree planting not just as a way to absorb carbon dioxide but also the cooling effects in adapting for climate change, to help cities be resilient against these very hot temperatures.”
The cooling of the land surface affected the air near ground level as well, with a stepwise reduction in heat linked to reductions in near-surface air temps.
“Analyses of historical land cover and air temperature trends showed that the cooling benefits of reforestation extend across the landscape,” the authors write. “Locations surrounded by reforestation were up to 1.8°F cooler than neighboring locations that did not undergo land cover change, and areas dominated by regrowing forests were associated with cooling temperature trends in much of the Eastern United States.”
By the 1930s, forest cover loss in the eastern states like the Carolinas and Mississippi had stopped, as the descendants of European settlers moved in greater and greater numbers into cities and marginal agricultural land was abandoned.
The Civilian Conservation Corps undertook large replanting efforts of forests that had been cleared, and this is believed to be what is causing the lower average temperatures observed in the study data.
However, the authors note that other causes, like more sophisticated crop irrigation and increases in airborne pollutants that block incoming sunlight, may have also contributed to the lowering of temperatures over time. They also note that tree planting might not always produce this effect, such as in the boreal zone where increases in trees are linked with increases in humidity that way raise average temperatures."
-via Good News Network, February 20, 2024
#trees#forests#reforestation#tree planting#global warming#climate change#climate crisis#american south#the south#eastern us#southern usa#conservation#meteorology#global temperature#conservation news#climate news#environment#hope#good news#hope posting#climate action#climate science#climate catastrophe#climate hope
14K notes
·
View notes
Text
Map: Detroit Michigan Air Permit Violations since 2018
by: Shelby Jouppi
Detroit and Wayne County are home to a disproportionately large number of significant sources of air pollution. These facilities are required to have a permit to pollute, and the Michigan Department of Environment, Great Lakes and Energy (EGLE) that routinely inspects them and responds to complaints will issue a violation notice if the facility breaks that permit.
About half…
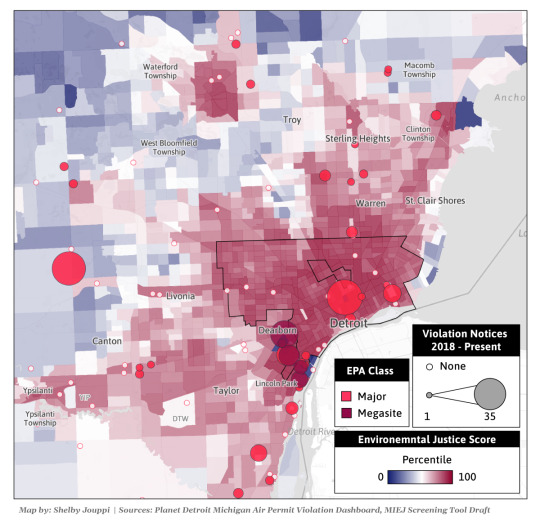
View On WordPress
#air permit#air quality#cartography#data#Detroit#EGLE#environmental justice#geography#map#Michigan#Planet Detroit#pollution#Shelby Jouppi#Wayne County
0 notes
Text
"The story of 'John Doe 1' of the Democratic Republic of the Congo is tucked in a lawsuit filed five years ago against several U.S. tech companies, including Tesla, the world’s largest electric vehicle producer. In a country where the earth hides its treasures beneath its surface, those who chip away at its bounty pay an unfair price. As a pre-teen, his family could no longer afford to pay his $6 monthly school fee, leaving him with one option: a life working underground in a tunnel, digging for cobalt rocks. But soon after he began working for roughly two U.S. dollars per day, the child was buried alive under the rubble of a collapsed mine tunnel. His body was never recovered.
The nation, fractured by war, disease, and famine, has seen more than 6 million people die since the mid-1990s, making the conflict the deadliest since World War II. But, in recent years, the death and destruction have been aided by the growing number of electric vehicles humming down American streets. In 2022, the U.S., the world’s third-largest importer of cobalt, spent nearly $525 million on the mineral, much of which came from the Congo.
As America’s dependence on the Congo has grown, Black-led labor and environmental organizers here in the U.S. have worked to build a transnational solidarity movement. Activists also say that the inequities faced in the Congo relate to those that Black Americans experience. And thanks in part to social media, the desire to better understand what’s happening in the Congo has grown in the past 10 years. In some ways, the Black Lives Matter movement first took root in the Congo after the uprising in Ferguson in 2014, advocates say. And since the murder of George Floyd and the outrage over the Gaza war, there has been an uptick in Congolese and Black American groups working on solidarity campaigns.
Throughout it all, the inequities faced by Congolese people and Black Americans show how the supply chain highlights similar patterns of exploitation and disenfranchisement. ... While the American South has picked up about two-thirds of the electric vehicle production jobs, Black workers there are more likely to work in non-unionized warehouses, receiving less pay and protections. The White House has also failed to share data that definitively proves whether Black workers are receiving these jobs, rather than them just being placed near Black communities. 'Automakers are moving their EV manufacturing and operations to the South in hopes of exploiting low labor costs and making higher profits,' explained Yterenickia Bell, an at-large council member in Clarkston, Georgia, last year. While Georgia has been targeted for investment by the Biden administration, workers are 'refusing to stand idly by and let them repeat a cycle that harms Black communities and working families.'
... Of the 255,000 Congolese mining for cobalt, 40,000 are children. They are not only exposed to physical threats but environmental ones. Cobalt mining pollutes critical water sources, plus the air and land. It is linked to respiratory illnesses, food insecurity, and violence. Still, in March, a U.S. court ruled on the case, finding that American companies could not be held liable for child labor in the Congo, even as they helped intensify the prevalence. ... Recently, the push for mining in the Congo has reached new heights because of a rift in China-U.S. relations regarding EV production. Earlier this month, the Biden administration issued a 100% tariff on Chinese-produced EVs to deter their purchase in the U.S. Currently, China owns about 80% of the legal mines in the Congo, but tens of thousands of Congolese work in 'artisanal' mines outside these facilities, where there are no rules or regulations, and where the U.S. gets much of its cobalt imports.
'Cobalt mining is the slave farm perfected,' wrote Siddharth Kara last year in the award-winning investigative book Cobalt Red: How The Blood of the Congo Powers Our Lives. 'It is a system of absolute exploitation for absolute profit.' While it is the world’s richest country in terms of wealth from natural resources, Congo is among the poorest in terms of life outcomes. Of the 201 countries recognized by the World Bank Group, it has the 191st lowest life expectancy."
3K notes
·
View notes
Text
Sharpening Our View of Climate Change with the Plankton, Aerosol, Cloud, ocean Ecosystem Satellite
As our planet warms, Earth’s ocean and atmosphere are changing.
Climate change has a lot of impact on the ocean, from sea level rise to marine heat waves to a loss of biodiversity. Meanwhile, greenhouse gases like carbon dioxide continue to warm our atmosphere.
NASA’s upcoming satellite, PACE, is soon to be on the case!
Set to launch on Feb. 6, 2024, the Plankton, Aerosol, Cloud, ocean Ecosystem (PACE) mission will help us better understand the complex systems driving the global changes that come with a warming climate.
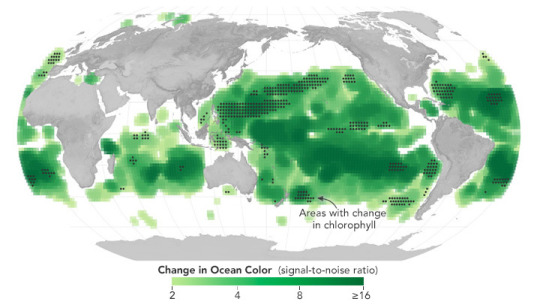
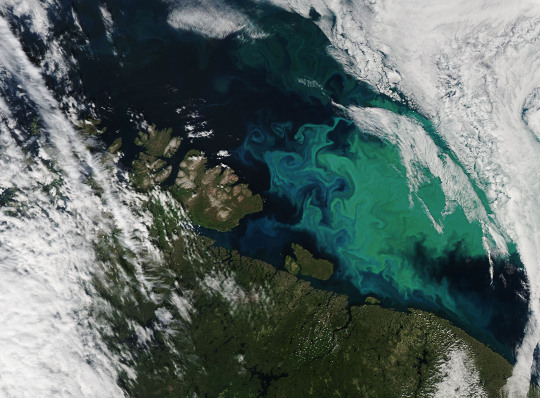
Earth’s ocean is becoming greener due to climate change. PACE will see the ocean in more hues than ever before.
While a single phytoplankton typically can’t be seen with the naked eye, communities of trillions of phytoplankton, called blooms, can be seen from space. Blooms often take on a greenish tinge due to the pigments that phytoplankton (similar to plants on land) use to make energy through photosynthesis.
In a 2023 study, scientists found that portions of the ocean had turned greener because there were more chlorophyll-carrying phytoplankton. PACE has a hyperspectral sensor, the Ocean Color Instrument (OCI), that will be able to discern subtle shifts in hue. This will allow scientists to monitor changes in phytoplankton communities and ocean health overall due to climate change.

Phytoplankton play a key role in helping the ocean absorb carbon from the atmosphere. PACE will identify different phytoplankton species from space.
With PACE, scientists will be able to tell what phytoplankton communities are present – from space! Before, this could only be done by analyzing a sample of seawater.
Telling “who’s who” in a phytoplankton bloom is key because different phytoplankton play vastly different roles in aquatic ecosystems. They can fuel the food chain and draw down carbon dioxide from the atmosphere to photosynthesize. Some phytoplankton populations capture carbon as they die and sink to the deep ocean; others release the gas back into the atmosphere as they decay near the surface.
Studying these teeny tiny critters from space will help scientists learn how and where phytoplankton are affected by climate change, and how changes in these communities may affect other creatures and ocean ecosystems.
Climate models are one of our most powerful tools to understand how Earth is changing. PACE data will improve the data these models rely on.
The PACE mission will offer important insights on airborne particles of sea salt, smoke, human-made pollutants, and dust – collectively called aerosols – by observing how they interact with light.
With two instruments called polarimeters, SPEXone and HARP2, PACE will allow scientists to measure the size, composition, and abundance of these microscopic particles in our atmosphere. This information is crucial to figuring out how climate and air quality are changing.
PACE data will help scientists answer key climate questions, like how aerosols affect cloud formation or how ice clouds and liquid clouds differ.
It will also enable scientists to examine one of the trickiest components of climate change to model: how clouds and aerosols interact. Once PACE is operational, scientists can replace the estimates currently used to fill data gaps in climate models with measurements from the new satellite.

With a view of the whole planet every two days, PACE will track both microscopic organisms in the ocean and microscopic particles in the atmosphere. PACE’s unique view will help us learn more about the ways climate change is impacting our planet’s ocean and atmosphere.
Stay up to date on the NASA PACE blog, and make sure to follow us on Tumblr for your regular dose of sPACE!
1K notes
·
View notes
Text
China’s massive rollout of renewable energy is accelerating, its investments in the sector growing so large that international climate watchdogs now expect the country’s greenhouse-gas emissions to peak years earlier than anticipated—possibly as soon as this year[!!!].
China installed 217 gigawatts worth of solar power last year alone, a 55% increase, according to new government data. That is more than 500 million solar panels and well above the total installed solar capacity of the U.S. [...]
Wind-energy installation additions were 76 gigawatts last year, more than the rest of the world combined. That amounted to more than 20,000 new turbines across the country, including the world’s largest, [...]
The low-carbon capacity additions, which also included hydropower and nuclear, were for the first time large enough that their power output could cover the entire annual increase in Chinese electricity demand [!!!!], analysts say. The dynamic suggests that coal-fired generation—which accounts for 70% of overall emissions for the world’s biggest polluter—is set to decline in the years to come, according to the Paris-based International Energy Agency and Lauri Myllyvirta, the Helsinki-based lead analyst at the Centre for Research on Energy and
Clean Air.[...]
Its rapid emissions growth long provided fodder for critics who said Beijing wasn’t committed to fighting climate change or supporting the Paris accord, the landmark climate agreement that calls for governments to attempt to limit warming to 1.5 degrees Celsius over preindustrial temperatures. Now, analysts and officials say Beijing’s efforts are lending momentum to the Paris process, which requires governments to draft new emissions plans every five years.
“An early peak would have a lot of symbolic value and send a signal to the world that we’ve turned a corner," said Jan Ivar Korsbakken, a senior researcher at the Oslo-based Center for International Climate and Environmental Research.
In 2020, Chinese leader Xi Jinping pledged that the country’s emissions would begin falling before 2030 and hit net zero before 2060, part of its plan prepared under the Paris accord. He also said China would have 1,200 gigawatts of total solar- and wind-power capacity by the end of this decade. The country is six years ahead of schedule: China reached 1,050 gigawatts of wind and solar capacity at the end of 2023, and the China Electricity Council forecast last month that capacity would top 1,300 gigawatts by the end of this year.[...]
Transition Zero, a U.K.-based nonprofit that uses satellite images to monitor industrial activity and emissions in China, says the official data are “broadly aligned and consistent" with theirs.[...]
[M]oving China’s timeline for an overall emissions peak forward could shave off around 0.3 to 0.4 degrees Celsius of projected global warming if emissions started to decline next decade, analysts say.[...]
The most certain variable in the equation is the breakneck pace of China’s renewable-energy rollout, which analysts expect will continue to add 200 to 300 gigawatts of new wind and solar capacity a year. The investments in renewable energy have become a major driver of the Chinese economy. The country’s clean-energy spending totaled $890 billion last year, up 40%. [...]
The adoption of electric vehicles is happening so rapidly that analysts say peak gasoline demand in China was already reached last year[!!!].
10 Feb 24
774 notes
·
View notes
Text
The full extent of the damage in Gaza has not yet been documented, but analysis of satellite imagery provided to the Guardian shows the destruction of about 38-48% of tree cover and farmland.
Olive groves and farms have been reduced to packed earth; soil and groundwater have been contaminated by munitions and toxins; the sea is choked with sewage and waste; the air polluted by smoke and particulate matter.
Researchers and environmental organisations say the destruction will have enormous effects on Gaza’s ecosystems and biodiversity. The scale and potential long-term impact of the damage have led to calls for it to be regarded as “ecocide” and investigated as a possible war crime.
[...]
He Yin, an assistant professor of geography at Kent State University in the US, who studied the damage to agricultural land in Syria during the 2011 civil war, analysed satellite imagery showing that up to 48% of Gaza’s tree cover had been lost or damaged between 7 October and 21 March.
As well as direct destruction from the military onslaught, the lack of fuel has led to people in Gaza having to cut down trees wherever they can find them to burn for cooking or heating.
“It’s whole orchards gone, only soil left; you don’t see a single thing,” Yin says.
Independent satellite analysis by Forensic Architecture (FA), a London-based research group that investigates state violence, found similar results.
Before 7 October, farms and orchards covered about 170 sq km (65 sq miles), or 47% of Gaza’s total land area. By the end of February, FA estimates from satellite data that Israeli military activity had destroyed more than 65 sq km, or 38% of that land.
As well as cultivated land, more than 7,500 greenhouses formed a vital part of the territory’s agricultural infrastructure.
Almost a third have been destroyed entirely, according to FA’s analysis, ranging from up to 90% in the north of Gaza to about 40% around Khan Younis.
514 notes
·
View notes
Text
Scientists find a human “fingerprint” in the upper troposphere’s increasing ozone
New Post has been published on https://thedigitalinsider.com/scientists-find-a-human-fingerprint-in-the-upper-tropospheres-increasing-ozone/
Scientists find a human “fingerprint” in the upper troposphere’s increasing ozone

Ozone can be an agent of good or harm, depending on where you find it in the atmosphere. Way up in the stratosphere, the colorless gas shields the Earth from the sun’s harsh ultraviolet rays. But closer to the ground, ozone is a harmful air pollutant that can trigger chronic health problems including chest pain, difficulty breathing, and impaired lung function.
And somewhere in between, in the upper troposphere — the layer of the atmosphere just below the stratosphere, where most aircraft cruise — ozone contributes to warming the planet as a potent greenhouse gas.
There are signs that ozone is continuing to rise in the upper troposphere despite efforts to reduce its sources at the surface in many nations. Now, MIT scientists confirm that much of ozone’s increase in the upper troposphere is likely due to humans.
In a paper appearing today in the journal Environmental Science and Technology, the team reports that they detected a clear signal of human influence on upper tropospheric ozone trends in a 17-year satellite record starting in 2005.
“We confirm that there’s a clear and increasing trend in upper tropospheric ozone in the northern midlatitudes due to human beings rather than climate noise,” says study lead author Xinyuan Yu, a graduate student in MIT’s Department of Earth, Atmospheric and Planetary Sciences (EAPS).
“Now we can do more detective work and try to understand what specific human activities are leading to this ozone trend,” adds co-author Arlene Fiore, the Peter H. Stone and Paola Malanotte Stone Professor in Earth, Atmospheric and Planetary Sciences.
The study’s MIT authors include Sebastian Eastham and Qindan Zhu, along with Benjamin Santer at the University of California at Los Angeles, Gustavo Correa of Columbia University, Jean-François Lamarque at the National Center for Atmospheric Research, and Jerald Zimeke at NASA Goddard Space Flight Center.
Ozone’s tangled web
Understanding ozone’s causes and influences is a challenging exercise. Ozone is not emitted directly, but instead is a product of “precursors” — starting ingredients, such as nitrogen oxides and volatile organic compounds (VOCs), that react in the presence of sunlight to form ozone. These precursors are generated from vehicle exhaust, power plants, chemical solvents, industrial processes, aircraft emissions, and other human-induced activities.
Whether and how long ozone lingers in the atmosphere depends on a tangle of variables, including the type and extent of human activities in a given area, as well as natural climate variability. For instance, a strong El Niño year could nudge the atmosphere’s circulation in a way that affects ozone’s concentrations, regardless of how much ozone humans are contributing to the atmosphere that year.
Disentangling the human- versus climate-driven causes of ozone trend, particularly in the upper troposphere, is especially tricky. Complicating matters is the fact that in the lower troposphere — the lowest layer of the atmosphere, closest to ground level — ozone has stopped rising, and has even fallen in some regions at northern midlatitudes in the last few decades. This decrease in lower tropospheric ozone is mainly a result of efforts in North America and Europe to reduce industrial sources of air pollution.
“Near the surface, ozone has been observed to decrease in some regions, and its variations are more closely linked to human emissions,” Yu notes. “In the upper troposphere, the ozone trends are less well-monitored but seem to decouple with those near the surface, and ozone is more easily influenced by climate variability. So, we don’t know whether and how much of that increase in observed ozone in the upper troposphere is attributed to humans.”
A human signal amid climate noise
Yu and Fiore wondered whether a human “fingerprint” in ozone levels, caused directly by human activities, could be strong enough to be detectable in satellite observations in the upper troposphere. To see such a signal, the researchers would first have to know what to look for.
For this, they looked to simulations of the Earth’s climate and atmospheric chemistry. Following approaches developed in climate science, they reasoned that if they could simulate a number of possible climate variations in recent decades, all with identical human-derived sources of ozone precursor emissions, but each starting with a slightly different climate condition, then any differences among these scenarios should be due to climate noise. By inference, any common signal that emerged when averaging over the simulated scenarios should be due to human-driven causes. Such a signal, then, would be a “fingerprint” revealing human-caused ozone, which the team could look for in actual satellite observations.
With this strategy in mind, the team ran simulations using a state-of-the-art chemistry climate model. They ran multiple climate scenarios, each starting from the year 1950 and running through 2014.
From their simulations, the team saw a clear and common signal across scenarios, which they identified as a human fingerprint. They then looked to tropospheric ozone products derived from multiple instruments aboard NASA’s Aura satellite.
“Quite honestly, I thought the satellite data were just going to be too noisy,” Fiore admits. “I didn’t expect that the pattern would be robust enough.”
But the satellite observations they used gave them a good enough shot. The team looked through the upper tropospheric ozone data derived from the satellite products, from the years 2005 to 2021, and found that, indeed, they could see the signal of human-caused ozone that their simulations predicted. The signal is especially pronounced over Asia, where industrial activity has risen significantly in recent decades and where abundant sunlight and frequent weather events loft pollution, including ozone and its precursors, to the upper troposphere.
Yu and Fiore are now looking to identify the specific human activities that are leading to ozone’s increase in the upper troposphere.
“Where is this increasing trend coming from? Is it the near-surface emissions from combusting fossil fuels in vehicle engines and power plants? Is it the aircraft that are flying in the upper troposphere? Is it the influence of wildland fires? Or some combination of all of the above?” Fiore says. “Being able to separate human-caused impacts from natural climate variations can help to inform strategies to address climate change and air pollution.”
This research was funded, in part, by NASA.
#agent#air#air pollution#aircraft#America#Art#Asia#atmosphere#Atmospheric chemistry#author#change#chemical#chemistry#climate#climate change#climate science#data#EAPS#earth#Earth and atmospheric sciences#el niño#Emissions#engines#Environment#Environmental#Europe#Events#Exercise#fingerprint#flight
0 notes
Text

“The study, published by emissions data firm Emission Analytics…found that brakes and tires on EVs release 1,850 times more particle pollution compared to modern tailpipes, which have ‘efficient’ exhaust filters, bringing gas-powered vehicles’ emissions to new lows.
As heavy cars drive on light-duty tires — most often made with synthetic rubber made from crude oil and other fillers and additives — they deteriorate and release harmful chemicals into the air, according to Emission Analytics.
Because EVs are on average 30% heavier, brakes and tires on the battery-powered cars wear out faster than on standard cars.
Emission Analytics found that tire wear emissions on half a metric tonne of battery weight in an EV are more than 400 times as great as direct exhaust particulate emissions.”
622 notes
·
View notes
Last Seen Blogs

angelxxlight
Super Interessante Sites e Blogs

swarmishstrangers
It's easier to be an animal than it is to be human

leventpergola
Levent pergola, tente, Extra dünya, Extra mekan, 0532 245 00 78

jolainteractiveusa-blog
Jola Interactive

blackphanto
IDK u tell me...