#be data science course
Explore tagged Tumblr posts
Visit Tumblr Blog
Explore Tumblr blogs with no restrictions, modern design and the best experience.
Last Seen Tumblr Blogs


Fun Fact
130K people were victims of a chain letter scam that affected Tumblr in May 2011.
Text
BE Data Science Course Explore Advanced Learning at BITM Ballari
Discover the BE Data Science course at Ballari Institute of Technology and Management, a comprehensive undergraduate program designed to equip students with in-depth knowledge of data analytics, machine learning, and artificial intelligence. This innovative course emphasizes practical skills, real-world applications, and research opportunities, preparing students for successful careers in top tech industries. With state-of-the-art infrastructure, experienced faculty, and a curriculum aligned with the latest industry standards, the BE Data Science course at BITM offers an ideal environment for aspiring data professionals to thrive and lead in the digital era.
0 notes
Text

it's Pi Day today so i'm posting this Shitty Manip (TM) (affectionate) in a rush to celebrate while i finish tweaking another one where they're even closer and they're actually kissing (but no less Shitty because i do my manips with freaking MS Paint on my laptop's trackpad)
#star trek#tng#ds9#data#julian bashir#NERDS#NOW KISS#playing with jpegs like paperdolls#of course i didn't finish “fixing” the ceiling lights or the science thingies on the workbench why should i#do not ask where Data's right hand's supposed to be
25 notes
·
View notes
Text
youtube
How To Learn Math for Machine Learning FAST (Even With Zero Math Background)
I dropped out of high school and managed to became an Applied Scientist at Amazon by self-learning math (and other ML skills). In this video I'll show you exactly how I did it, sharing the resources and study techniques that worked for me, along with practical advice on what math you actually need (and don't need) to break into machine learning and data science.
#How To Learn Math for Machine Learning#machine learning#free education#education#youtube#technology#educate yourselves#educate yourself#tips and tricks#software engineering#data science#artificial intelligence#data analytics#data science course#math#mathematics#Youtube
21 notes
·
View notes
Text
Python for Beginners: Launch Your Tech Career with Coding Skills
Are you ready to launch your tech career but don’t know where to start? Learning Python is one of the best ways to break into the world of technology—even if you have zero coding experience.
In this guide, we’ll explore how Python for beginners can be your gateway to a rewarding career in software development, data science, automation, and more.
Why Python Is the Perfect Language for Beginners
Python has become the go-to programming language for beginners and professionals alike—and for good reason:
Simple syntax: Python reads like plain English, making it easy to learn.
High demand: Industries spanning the spectrum are actively seeking Python developers to fuel their technological advancements.
Versatile applications: Python's versatility shines as it powers everything from crafting websites to driving artificial intelligence and dissecting data.
Whether you want to become a software developer, data analyst, or AI engineer, Python lays the foundation.
What Can You Do With Python?
Python is not just a beginner language—it’s a career-building tool. Here are just a few career paths where Python is essential:
Web Development: Frameworks like Django and Flask make it easy to build powerful web applications. You can even enroll in a Python Course in Kochi to gain hands-on experience with real-world web projects.
Data Science & Analytics: For professionals tackling data analysis and visualization, the Python ecosystem, featuring powerhouses like Pandas, NumPy, and Matplotlib, sets the benchmark.
Machine Learning & AI: Spearheading advancements in artificial intelligence development, Python boasts powerful tools such as TensorFlow and scikit-learn.
Automation & Scripting: Simple yet effective Python scripts offer a pathway to amplified efficiency by automating routine workflows.
Cybersecurity & Networking: The application of Python is expanding into crucial domains such as ethical hacking, penetration testing, and the automation of network processes.
How to Get Started with Python
Starting your Python journey doesn't require a computer science degree. Success hinges on a focused commitment combined with a thoughtfully structured educational approach.
Step 1: Install Python
Download and install Python from python.org. It's free and available for all platforms.
Step 2: Choose an IDE
Use beginner-friendly tools like Thonny, PyCharm, or VS Code to write your code.
Step 3: Learn the Basics
Focus on:
Variables and data types
Conditional statements
Loops
Functions
Lists and dictionaries
If you prefer guided learning, a reputable Python Institute in Kochi can offer structured programs and mentorship to help you grasp core concepts efficiently.
Step 4: Build Projects
Learning by doing is key. Start small:
Build a calculator
Automate file organization
Create a to-do list app
As your skills grow, you can tackle more complex projects like data dashboards or web apps.
How Python Skills Can Boost Your Career
Adding Python to your resume instantly opens up new opportunities. Here's how it helps:
Higher employability: Python is one of the top 3 most in-demand programming languages.
Better salaries: Python developers earn competitive salaries across the globe.
Remote job opportunities: Many Python-related jobs are available remotely, offering flexibility.
Even if you're not aiming to be a full-time developer, Python skills can enhance careers in marketing, finance, research, and product management.
If you're serious about starting a career in tech, learning Python is the smartest first step you can take. It’s beginner-friendly, powerful, and widely used across industries.
Whether you're a student, job switcher, or just curious about programming, Python for beginners can unlock countless career opportunities. Invest time in learning today—and start building the future you want in tech.
Globally recognized as a premier educational hub, DataMites Institute delivers in-depth training programs across the pivotal fields of data science, artificial intelligence, and machine learning. They provide expert-led courses designed for both beginners and professionals aiming to boost their careers.
Python Modules Explained - Different Types and Functions - Python Tutorial
youtube
#python course#python training#python#learnpython#pythoncourseinindia#pythoncourseinkochi#pythoninstitute#python for data science#Youtube
3 notes
·
View notes
Text
i’ve been cleaning data and training models for too long now. where’s the old man gay porn
#in all seriousness i absolutely love data science but God i’m exhausted and in need of a two-day break#and the academic semester starts on monday <3#anyway. i just started writing a lawrence/bellini/tedesco fic. writing this fic is what i’m gonna do in my (scarce) free time#it’s a very painful one because of course it is#p
6 notes
·
View notes
Text
Unlocking the Power of Data: Essential Skills to Become a Data Scientist

In today's data-driven world, the demand for skilled data scientists is skyrocketing. These professionals are the key to transforming raw information into actionable insights, driving innovation and shaping business strategies. But what exactly does it take to become a data scientist? It's a multidisciplinary field, requiring a unique blend of technical prowess and analytical thinking. Let's break down the essential skills you'll need to embark on this exciting career path.
1. Strong Mathematical and Statistical Foundation:
At the heart of data science lies a deep understanding of mathematics and statistics. You'll need to grasp concepts like:
Linear Algebra and Calculus: Essential for understanding machine learning algorithms and optimizing models.
Probability and Statistics: Crucial for data analysis, hypothesis testing, and drawing meaningful conclusions from data.
2. Programming Proficiency (Python and/or R):
Data scientists are fluent in at least one, if not both, of the dominant programming languages in the field:
Python: Known for its readability and extensive libraries like Pandas, NumPy, Scikit-learn, and TensorFlow, making it ideal for data manipulation, analysis, and machine learning.
R: Specifically designed for statistical computing and graphics, R offers a rich ecosystem of packages for statistical modeling and visualization.
3. Data Wrangling and Preprocessing Skills:
Raw data is rarely clean and ready for analysis. A significant portion of a data scientist's time is spent on:
Data Cleaning: Handling missing values, outliers, and inconsistencies.
Data Transformation: Reshaping, merging, and aggregating data.
Feature Engineering: Creating new features from existing data to improve model performance.
4. Expertise in Databases and SQL:
Data often resides in databases. Proficiency in SQL (Structured Query Language) is essential for:
Extracting Data: Querying and retrieving data from various database systems.
Data Manipulation: Filtering, joining, and aggregating data within databases.
5. Machine Learning Mastery:
Machine learning is a core component of data science, enabling you to build models that learn from data and make predictions or classifications. Key areas include:
Supervised Learning: Regression, classification algorithms.
Unsupervised Learning: Clustering, dimensionality reduction.
Model Selection and Evaluation: Choosing the right algorithms and assessing their performance.
6. Data Visualization and Communication Skills:
Being able to effectively communicate your findings is just as important as the analysis itself. You'll need to:
Visualize Data: Create compelling charts and graphs to explore patterns and insights using libraries like Matplotlib, Seaborn (Python), or ggplot2 (R).
Tell Data Stories: Present your findings in a clear and concise manner that resonates with both technical and non-technical audiences.
7. Critical Thinking and Problem-Solving Abilities:
Data scientists are essentially problem solvers. You need to be able to:
Define Business Problems: Translate business challenges into data science questions.
Develop Analytical Frameworks: Structure your approach to solve complex problems.
Interpret Results: Draw meaningful conclusions and translate them into actionable recommendations.
8. Domain Knowledge (Optional but Highly Beneficial):
Having expertise in the specific industry or domain you're working in can give you a significant advantage. It helps you understand the context of the data and formulate more relevant questions.
9. Curiosity and a Growth Mindset:
The field of data science is constantly evolving. A genuine curiosity and a willingness to learn new technologies and techniques are crucial for long-term success.
10. Strong Communication and Collaboration Skills:
Data scientists often work in teams and need to collaborate effectively with engineers, business stakeholders, and other experts.
Kickstart Your Data Science Journey with Xaltius Academy's Data Science and AI Program:
Acquiring these skills can seem like a daunting task, but structured learning programs can provide a clear and effective path. Xaltius Academy's Data Science and AI Program is designed to equip you with the essential knowledge and practical experience to become a successful data scientist.
Key benefits of the program:
Comprehensive Curriculum: Covers all the core skills mentioned above, from foundational mathematics to advanced machine learning techniques.
Hands-on Projects: Provides practical experience working with real-world datasets and building a strong portfolio.
Expert Instructors: Learn from industry professionals with years of experience in data science and AI.
Career Support: Offers guidance and resources to help you launch your data science career.
Becoming a data scientist is a rewarding journey that blends technical expertise with analytical thinking. By focusing on developing these key skills and leveraging resources like Xaltius Academy's program, you can position yourself for a successful and impactful career in this in-demand field. The power of data is waiting to be unlocked – are you ready to take the challenge?
3 notes
·
View notes
Text

Elevate Your Brand, Rule the Digital Space with Cybrom Technology.
#digital marketing#Social media marketing#Data science#data analytics#data analyst course#seo#search engine optimization#google ads
5 notes
·
View notes
Text
https://appwarstechnologies.com/data-science-training-in-noida/

#data science training#data science course#data science learning#data science certifica#data science institute
2 notes
·
View notes
Text
Data science course in mohali. for more information Contact us : https://seekhodigitalindia.com/our-services/
2 notes
·
View notes
Text
DataMites-data science course in dehradun
DataMites Institute is a premier institution for Data Science education, offering a diverse range of programs such as Artificial Intelligence, Machine Learning, Python Development, Data Analytics, and the Certified Data Scientist Course. With accreditations from IABAC and NASSCOM FutureSkills, the institute provides expert-led training, valuable internships, and comprehensive placement support. For those seeking an immersive learning experience, DataMites also offers an offline program designed to build practical skills and industry-specific expertise.
2 notes
·
View notes
Text
How to Become a Data Scientist in 2025 (Roadmap for Absolute Beginners)

Want to become a data scientist in 2025 but don’t know where to start? You’re not alone. With job roles, tech stacks, and buzzwords changing rapidly, it’s easy to feel lost.
But here’s the good news: you don’t need a PhD or years of coding experience to get started. You just need the right roadmap.
Let’s break down the beginner-friendly path to becoming a data scientist in 2025.
✈️ Step 1: Get Comfortable with Python
Python is the most beginner-friendly programming language in data science.
What to learn:
Variables, loops, functions
Libraries like NumPy, Pandas, and Matplotlib
Why: It’s the backbone of everything you’ll do in data analysis and machine learning.
🔢 Step 2: Learn Basic Math & Stats
You don’t need to be a math genius. But you do need to understand:
Descriptive statistics
Probability
Linear algebra basics
Hypothesis testing
These concepts help you interpret data and build reliable models.
📊 Step 3: Master Data Handling
You’ll spend 70% of your time cleaning and preparing data.
Skills to focus on:
Working with CSV/Excel files
Cleaning missing data
Data transformation with Pandas
Visualizing data with Seaborn/Matplotlib
This is the “real work” most data scientists do daily.
🧬 Step 4: Learn Machine Learning (ML)
Once you’re solid with data handling, dive into ML.
Start with:
Supervised learning (Linear Regression, Decision Trees, KNN)
Unsupervised learning (Clustering)
Model evaluation metrics (accuracy, recall, precision)
Toolkits: Scikit-learn, XGBoost
🚀 Step 5: Work on Real Projects
Projects are what make your resume pop.
Try solving:
Customer churn
Sales forecasting
Sentiment analysis
Fraud detection
Pro tip: Document everything on GitHub and write blogs about your process.
✏️ Step 6: Learn SQL and Databases
Data lives in databases. Knowing how to query it with SQL is a must-have skill.
Focus on:
SELECT, JOIN, GROUP BY
Creating and updating tables
Writing nested queries
🌍 Step 7: Understand the Business Side
Data science isn’t just tech. You need to translate insights into decisions.
Learn to:
Tell stories with data (data storytelling)
Build dashboards with tools like Power BI or Tableau
Align your analysis with business goals
🎥 Want a Structured Way to Learn All This?
Instead of guessing what to learn next, check out Intellipaat’s full Data Science course on YouTube. It covers Python, ML, real projects, and everything you need to build job-ready skills.
https://www.youtube.com/watch?v=rxNDw68XcE4
🔄 Final Thoughts
Becoming a data scientist in 2025 is 100% possible — even for beginners. All you need is consistency, a good learning path, and a little curiosity.
Start simple. Build as you go. And let your projects speak louder than your resume.
Drop a comment if you’re starting your journey. And don’t forget to check out the free Intellipaat course to speed up your progress!
2 notes
·
View notes
Text
youtube
Statistics - A Full Lecture to learn Data Science (2025 Version)
Welcome to our comprehensive and free statistics tutorial (Full Lecture)! In this video, we'll explore essential tools and techniques that power data science and data analytics, helping us interpret data effectively. You'll gain a solid foundation in key statistical concepts and learn how to apply powerful statistical tests widely used in modern research and industry. From descriptive statistics to regression analysis and beyond, we'll guide you through each method's role in data-driven decision-making. Whether you're diving into machine learning, business intelligence, or academic research, this tutorial will equip you with the skills to analyze and interpret data with confidence. Let's get started!
#education#free education#technology#educate yourselves#educate yourself#data analysis#data science course#data science#data structure and algorithms#youtube#statistics for data science#statistics#economics#education system#learn data science#learn data analytics#Youtube
4 notes
·
View notes
Text
Why Tableau is Essential in Data Science: Transforming Raw Data into Insights

Data science is all about turning raw data into valuable insights. But numbers and statistics alone don’t tell the full story—they need to be visualized to make sense. That’s where Tableau comes in.
Tableau is a powerful tool that helps data scientists, analysts, and businesses see and understand data better. It simplifies complex datasets, making them interactive and easy to interpret. But with so many tools available, why is Tableau a must-have for data science? Let’s explore.
1. The Importance of Data Visualization in Data Science
Imagine you’re working with millions of data points from customer purchases, social media interactions, or financial transactions. Analyzing raw numbers manually would be overwhelming.
That’s why visualization is crucial in data science:
Identifies trends and patterns – Instead of sifting through spreadsheets, you can quickly spot trends in a visual format.
Makes complex data understandable – Graphs, heatmaps, and dashboards simplify the interpretation of large datasets.
Enhances decision-making – Stakeholders can easily grasp insights and make data-driven decisions faster.
Saves time and effort – Instead of writing lengthy reports, an interactive dashboard tells the story in seconds.
Without tools like Tableau, data science would be limited to experts who can code and run statistical models. With Tableau, insights become accessible to everyone—from data scientists to business executives.
2. Why Tableau Stands Out in Data Science
A. User-Friendly and Requires No Coding
One of the biggest advantages of Tableau is its drag-and-drop interface. Unlike Python or R, which require programming skills, Tableau allows users to create visualizations without writing a single line of code.
Even if you’re a beginner, you can:
✅ Upload data from multiple sources
✅ Create interactive dashboards in minutes
✅ Share insights with teams easily
This no-code approach makes Tableau ideal for both technical and non-technical professionals in data science.
B. Handles Large Datasets Efficiently
Data scientists often work with massive datasets—whether it’s financial transactions, customer behavior, or healthcare records. Traditional tools like Excel struggle with large volumes of data.
Tableau, on the other hand:
Can process millions of rows without slowing down
Optimizes performance using advanced data engine technology
Supports real-time data streaming for up-to-date analysis
This makes it a go-to tool for businesses that need fast, data-driven insights.
C. Connects with Multiple Data Sources
A major challenge in data science is bringing together data from different platforms. Tableau seamlessly integrates with a variety of sources, including:
Databases: MySQL, PostgreSQL, Microsoft SQL Server
Cloud platforms: AWS, Google BigQuery, Snowflake
Spreadsheets and APIs: Excel, Google Sheets, web-based data sources
This flexibility allows data scientists to combine datasets from multiple sources without needing complex SQL queries or scripts.
D. Real-Time Data Analysis
Industries like finance, healthcare, and e-commerce rely on real-time data to make quick decisions. Tableau’s live data connection allows users to:
Track stock market trends as they happen
Monitor website traffic and customer interactions in real time
Detect fraudulent transactions instantly
Instead of waiting for reports to be generated manually, Tableau delivers insights as events unfold.
E. Advanced Analytics Without Complexity
While Tableau is known for its visualizations, it also supports advanced analytics. You can:
Forecast trends based on historical data
Perform clustering and segmentation to identify patterns
Integrate with Python and R for machine learning and predictive modeling
This means data scientists can combine deep analytics with intuitive visualization, making Tableau a versatile tool.
3. How Tableau Helps Data Scientists in Real Life
Tableau has been adopted by the majority of industries to make data science more impactful and accessible. This is applied in the following real-life scenarios:
A. Analytics for Health Care
Tableau is deployed by hospitals and research institutions for the following purposes:
Monitor patient recovery rates and predict outbreaks of diseases
Analyze hospital occupancy and resource allocation
Identify trends in patient demographics and treatment results
B. Finance and Banking
Banks and investment firms rely on Tableau for the following purposes:
✅ Detect fraud by analyzing transaction patterns
✅ Track stock market fluctuations and make informed investment decisions
✅ Assess credit risk and loan performance
C. Marketing and Customer Insights
Companies use Tableau to:
✅ Track customer buying behavior and personalize recommendations
✅ Analyze social media engagement and campaign effectiveness
✅ Optimize ad spend by identifying high-performing channels
D. Retail and Supply Chain Management
Retailers leverage Tableau to:
✅ Forecast product demand and adjust inventory levels
✅ Identify regional sales trends and adjust marketing strategies
✅ Optimize supply chain logistics and reduce delivery delays
These applications show why Tableau is a must-have for data-driven decision-making.
4. Tableau vs. Other Data Visualization Tools
There are many visualization tools available, but Tableau consistently ranks as one of the best. Here’s why:
Tableau vs. Excel – Excel struggles with big data and lacks interactivity; Tableau handles large datasets effortlessly.
Tableau vs. Power BI – Power BI is great for Microsoft users, but Tableau offers more flexibility across different data sources.
Tableau vs. Python (Matplotlib, Seaborn) – Python libraries require coding skills, while Tableau simplifies visualization for all users.
This makes Tableau the go-to tool for both beginners and experienced professionals in data science.
5. Conclusion
Tableau has become an essential tool in data science because it simplifies data visualization, handles large datasets, and integrates seamlessly with various data sources. It enables professionals to analyze, interpret, and present data interactively, making insights accessible to everyone—from data scientists to business leaders.
If you’re looking to build a strong foundation in data science, learning Tableau is a smart career move. Many data science courses now include Tableau as a key skill, as companies increasingly demand professionals who can transform raw data into meaningful insights.
In a world where data is the driving force behind decision-making, Tableau ensures that the insights you uncover are not just accurate—but also clear, impactful, and easy to act upon.
#data science course#top data science course online#top data science institute online#artificial intelligence course#deepseek#tableau
3 notes
·
View notes
Text
Business Analytics vs. Data Science: Understanding the Key Differences

In today's data-driven world, terms like "business analytics" and "data science" are often used interchangeably. However, while they share a common goal of extracting insights from data, they are distinct fields with different focuses and methodologies. Let's break down the key differences to help you understand which path might be right for you.
Business Analytics: Focusing on the Present and Past
Business analytics primarily focuses on analyzing historical data to understand past performance and inform current business decisions. It aims to answer questions like:
What happened?
Why did it happen?
What is happening now?
Key characteristics of business analytics:
Descriptive and Diagnostic: It uses techniques like reporting, dashboards, and data visualization to summarize and explain past trends.
Structured Data: It often works with structured data from databases and spreadsheets.
Business Domain Expertise: A strong understanding of the specific business domain is crucial.
Tools: Business analysts typically use tools like Excel, SQL, Tableau, and Power BI.
Focus: Optimizing current business operations and improving efficiency.
Data Science: Predicting the Future and Building Models
Data science, on the other hand, focuses on building predictive models and developing algorithms to forecast future outcomes. It aims to answer questions like:
What will happen?
How can we make it happen?
Key characteristics of data science:
Predictive and Prescriptive: It uses machine learning, statistical modeling, and AI to predict future trends and prescribe optimal actions.
Unstructured and Structured Data: It can handle both structured and unstructured data from various sources.
Technical Proficiency: Strong programming skills (Python, R) and a deep understanding of machine learning algorithms are essential.
Tools: Data scientists use programming languages, machine learning libraries, and big data technologies.
Focus: Developing innovative solutions, building AI-powered products, and driving long-term strategic initiatives.
Key Differences Summarized:

Which Path is Right for You?
Choose Business Analytics if:
You are interested in analyzing past data to improve current business operations.
You have a strong understanding of a specific business domain.
You prefer working with structured data and using visualization tools.
Choose Data Science if:
You are passionate about building predictive models and developing AI-powered solutions.
You have a strong interest in programming and machine learning.
You enjoy working with both structured and unstructured data.
Xaltius Academy's Data Science & AI Course:
If you're leaning towards data science and want to delve into machine learning and AI, Xaltius Academy's Data Science & AI course is an excellent choice. This program equips you with the necessary skills and knowledge to become a proficient data scientist, covering essential topics like:
Python programming
Machine learning algorithms
Data visualization
And much more!
By understanding the distinct roles of business analytics and data science, you can make an informed decision about your career path and leverage the power of data to drive success.
2 notes
·
View notes
Text
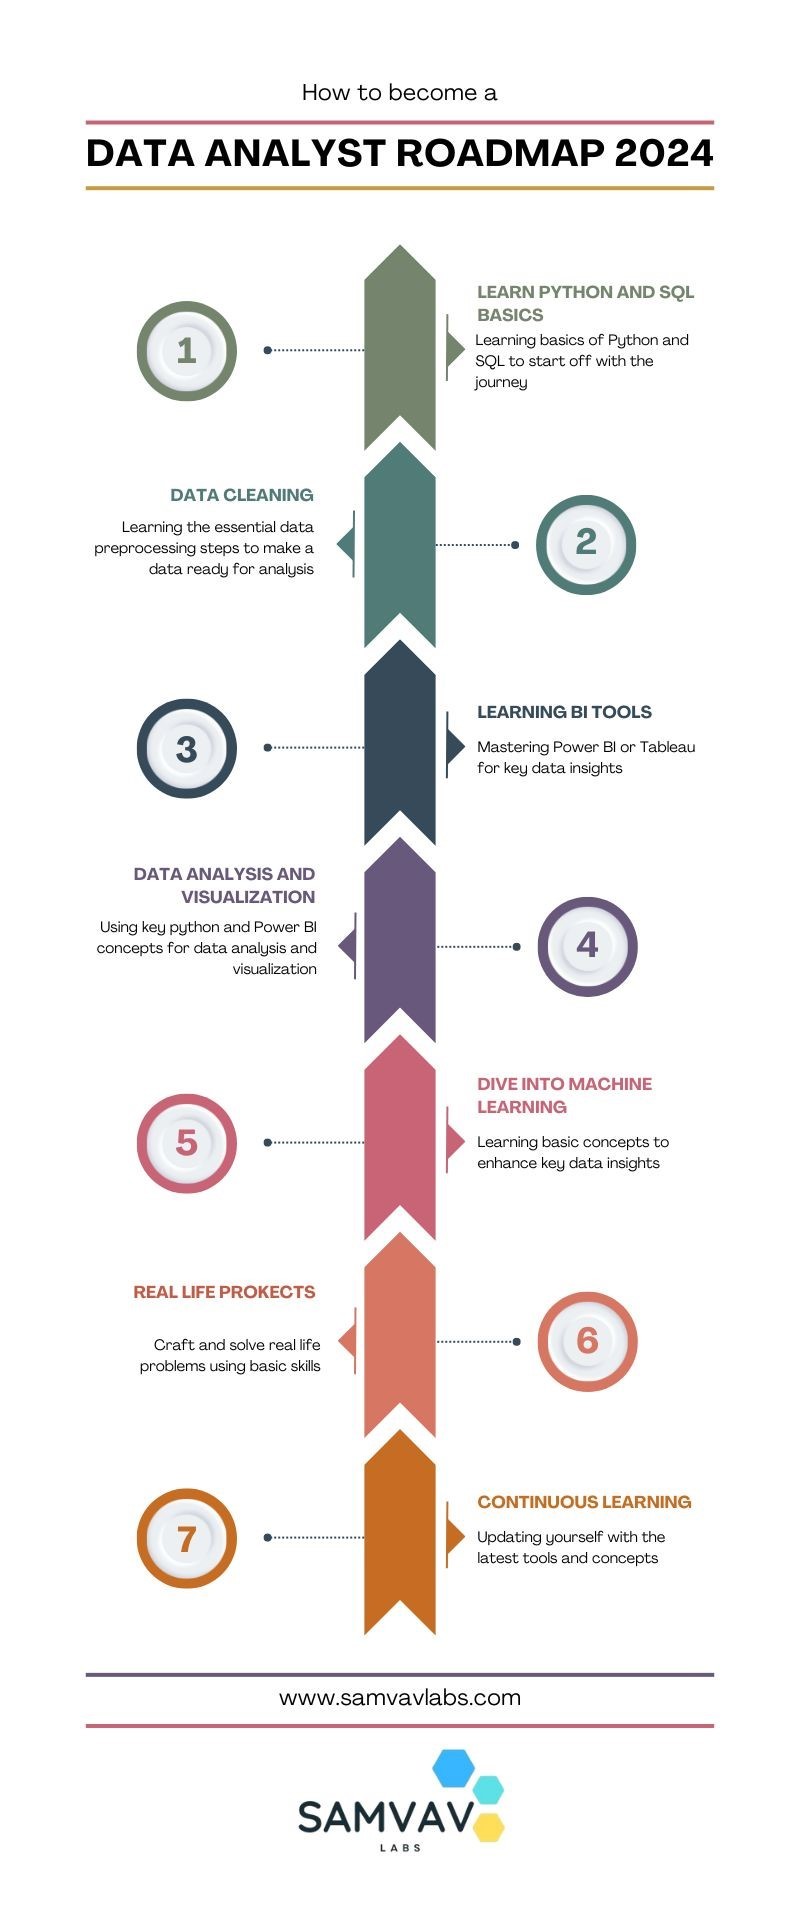
Data Analyst Roadmap for 2024!
Cracking the Data Analyst Roadmap for 2024! Kick off your journey by mastering and delving into Python for data manipulation magic, and dazzle stakeholders with insights using PowerBi or Tableau. Don't forget, that SQL proficiency and hands-on projects refine your skillset, but never overlook the importance of effective communication and problem-solving. Are you checking off these milestones on your path to success? 📌 For more details, visit our website: https://www.samvavlabs.com . . . #DataAnalyst2024 #CareerGrowth #roadmap #DataAnalyst #samvavlabs #roadmap2024 #dataanalystroadmap #datavisualization
#business analytics#data analytics#data analyst#machinelearning#data visualization#datascience#deep learning#data analyst training#dataanalystcourseinKolkata#data analyst certification#data analyst course#data science course#business analyst
11 notes
·
View notes