#data analysis program
Explore tagged Tumblr posts
Visit Tumblr Blog
Explore Tumblr blogs with no restrictions, modern design and the best experience.
Last Seen Tumblr Blogs


Fun Fact
There were a total of 171.5 billion posts on Tumblr in 2019.
Text


step 1: develop hyperfixation on coding with R
step 2: ??!!??!? (for three weeks straight)
step 3: fully interactive LCARS inspired website that does CGM analysis for the minuscule audience of diabetic star trek nerds
#step 4 no profit i do this for the love of the game#it’s still a work in progress#im steadily losing my anonymity on here but whatever#lcars#star trek#star trek tng#R#rstudio#programming#diabetes#cgm#dexcom#data analysis
210 notes
·
View notes
Text

Leilani doodle dump
#mun's junkart#calliope can't read 💫 ooc.#so long ultra space cowboy...#dimensional data analysis program 💫 headcanon.#technically a headcanon#it is her Outfit
13 notes
·
View notes
Text
Cardinal-O-Mat Data Science
Soooo I wanted to learn something data sciency. And I stumbled over David Kriesel's Wahl-O-Mat analyses and wanted to do the same but different. I, like you maybe, have stumbled over the cardinal-o-mat. Logical conclusion: Let's do data science without mama (I'm so sorry!) but with the cardinal-o-mat! (Of course, I also have done this with the Wahl-O-Mat.)
The Cluster Heatmap
Here we have a cluster heatmap. (Isn't she pretty? Actually not so much, there's a lot of grey there...)

On the right side, you can see the names of the cardinals, and on the bottom, you can see the names of the theses. (I was too lazy to make them look pretty.) Red means disagree, blue means agree (for colorblindness reasons). Grey means either that the cardinal was explicitly neutral to the question or that there was simply no data on his position regarding the thesis in the cardinal-o-mat.
The theses are as follows (in order of appearance in the cardinal-o-mat):
I'll spare you and not list all the cardinals' names.
female_deacons: Women should be admitted to the diaconate.
same_sex: Same-sex couples should continue to be allowed to receive blessings outside of liturgical celebrations.
celibacy: Priestly celibacy should become voluntary.
vetus_ordo: The celebration of the Old Latin Mass should remain restricted for the sake of church unity.
vatican_china: The secret agreement between the Vatican and the People's Republic of China on the appointment of bishops should be upheld.
synodal_church: The Catholic Church should be a synodal church in which more emphasis is placed on participation, inclusion and joint decision-making.
climate_change: The Catholic Church should get involved in climate protection because it is committed to God's creation and the protection of the most vulnerable.
humanae_vitae: The Catholic Church should reconsider its position on contraception.
communion_unmarried: Divorced and remarried persons should be admitted to communion in individual cases.
german_synode: The German Synodal Way, aiming at reforming the doctrine of faith and morals, should be regarded positively overall.
covid: Church closures and vaccination recommendations during the Covid-19 pandemic were right.
islam: Interfaith dialogue with Islam is important.
What do we see here?
Roughly speaking, the closer two cardinals or two theses are shown in the map, the more similar they are, and the further apart in the map, the more dissimilar. Because of this closeness of similar cardinals/theses, we get these blocks of blue and red (kinda. I mean, it could be much worse.).
I want to emphasize that I did not sort this by hand. Rather it was sorted by an algorithm with respect to a certain metric (here the Jaccard metric), which measures the "distance" between the cardinals and theses. The method used is (divisive) hierarchical clustering. At each step, a cluster is divided into two subsets such that their distance is maximized. You can see these steps in the lines on the top and left side. This is called a dendrogram.
What do we learn from this?
Damn good question! The amount of things to learn is somewhat limited, if we look at the amount of neutrals and non-opinions, also considering I did not seperate those two.
Since this is a non-serious setting, I think we can reasonably infer that a cardinal that has spoken in favor of a couple of the theses is also generally more open to those he has not voiced an opinion on, and similarly for the conservative ones. If you look at it like this, then it becomes quite clear that the blue, so the generally more open minded cardinals are in the majority. I would have loved to have a cardinal-o-mat for the previous conclave, because I have the hypothesis that there, the conservative cardinals might have had the majority and I would love to test this.
Something I find funny is that one of the theses that is most liked is the synodal_church one, which is about participation and joint decision making. One of the least liked ones is the german_synode one (only one agreement, thx Marx my homie), which tries to do exactly the participation and joint decision making.
I don't know what else we learn from this, I just think that a cluster heatmap is a neat way of visualising the positions of the cardinals wrt to the theses and since it is somewhat sorted, we learn something about their relation with each other.
If you can explain to me why there is this red block in the left bottom corner, please do! I thought it might have something to do with the metric I used but the map always looks similar or worse.
Also, maybe someone can explain to me which metric to use when.
#cardinal-o-mat#cardinalomat#kardinalomat#kardinal-o-mat#conclave#konklave#does this qualify as fanart? probably not. but as i was inspired by conclave (2024) maybe it qualifies as#fan work#data science#datascience#data analysis#conclave 2024#conclave (2024)#conclave 2025#conclave (2025)#python#programming
10 notes
·
View notes
Text
Understanding Outliers in Machine Learning and Data Science

In machine learning and data science, an outlier is like a misfit in a dataset. It's a data point that stands out significantly from the rest of the data. Sometimes, these outliers are errors, while other times, they reveal something truly interesting about the data. Either way, handling outliers is a crucial step in the data preprocessing stage. If left unchecked, they can skew your analysis and even mess up your machine learning models.
In this article, we will dive into:
1. What outliers are and why they matter.
2. How to detect and remove outliers using the Interquartile Range (IQR) method.
3. Using the Z-score method for outlier detection and removal.
4. How the Percentile Method and Winsorization techniques can help handle outliers.
This guide will explain each method in simple terms with Python code examples so that even beginners can follow along.
1. What Are Outliers?
An outlier is a data point that lies far outside the range of most other values in your dataset. For example, in a list of incomes, most people might earn between $30,000 and $70,000, but someone earning $5,000,000 would be an outlier.
Why Are Outliers Important?
Outliers can be problematic or insightful:
Problematic Outliers: Errors in data entry, sensor faults, or sampling issues.
Insightful Outliers: They might indicate fraud, unusual trends, or new patterns.
Types of Outliers
1. Univariate Outliers: These are extreme values in a single variable.
Example: A temperature of 300°F in a dataset about room temperatures.
2. Multivariate Outliers: These involve unusual combinations of values in multiple variables.
Example: A person with an unusually high income but a very low age.
3. Contextual Outliers: These depend on the context.
Example: A high temperature in winter might be an outlier, but not in summer.
2. Outlier Detection and Removal Using the IQR Method
The Interquartile Range (IQR) method is one of the simplest ways to detect outliers. It works by identifying the middle 50% of your data and marking anything that falls far outside this range as an outlier.
Steps:
1. Calculate the 25th percentile (Q1) and 75th percentile (Q3) of your data.
2. Compute the IQR:
{IQR} = Q3 - Q1
Q1 - 1.5 \times \text{IQR}
Q3 + 1.5 \times \text{IQR} ] 4. Anything below the lower bound or above the upper bound is an outlier.
Python Example:
import pandas as pd
# Sample dataset
data = {'Values': [12, 14, 18, 22, 25, 28, 32, 95, 100]}
df = pd.DataFrame(data)
# Calculate Q1, Q3, and IQR
Q1 = df['Values'].quantile(0.25)
Q3 = df['Values'].quantile(0.75)
IQR = Q3 - Q1
# Define the bounds
lower_bound = Q1 - 1.5 * IQR
upper_bound = Q3 + 1.5 * IQR
# Identify and remove outliers
outliers = df[(df['Values'] < lower_bound) | (df['Values'] > upper_bound)]
print("Outliers:\n", outliers)
filtered_data = df[(df['Values'] >= lower_bound) & (df['Values'] <= upper_bound)]
print("Filtered Data:\n", filtered_data)
Key Points:
The IQR method is great for univariate datasets.
It works well when the data isn’t skewed or heavily distributed.
3. Outlier Detection and Removal Using the Z-Score Method
The Z-score method measures how far a data point is from the mean, in terms of standard deviations. If a Z-score is greater than a certain threshold (commonly 3 or -3), it is considered an outlier.
Formula:
Z = \frac{(X - \mu)}{\sigma}
is the data point,
is the mean of the dataset,
is the standard deviation.
Python Example:
import numpy as np
# Sample dataset
data = {'Values': [12, 14, 18, 22, 25, 28, 32, 95, 100]}
df = pd.DataFrame(data)
# Calculate mean and standard deviation
mean = df['Values'].mean()
std_dev = df['Values'].std()
# Compute Z-scores
df['Z-Score'] = (df['Values'] - mean) / std_dev
# Identify and remove outliers
threshold = 3
outliers = df[(df['Z-Score'] > threshold) | (df['Z-Score'] < -threshold)]
print("Outliers:\n", outliers)
filtered_data = df[(df['Z-Score'] <= threshold) & (df['Z-Score'] >= -threshold)]
print("Filtered Data:\n", filtered_data)
Key Points:
The Z-score method assumes the data follows a normal distribution.
It may not work well with skewed datasets.
4. Outlier Detection Using the Percentile Method and Winsorization
Percentile Method:
In the percentile method, we define a lower percentile (e.g., 1st percentile) and an upper percentile (e.g., 99th percentile). Any value outside this range is treated as an outlier.
Winsorization:
Winsorization is a technique where outliers are not removed but replaced with the nearest acceptable value.
Python Example:
from scipy.stats.mstats import winsorize
import numpy as np
Sample data
data = [12, 14, 18, 22, 25, 28, 32, 95, 100]
Calculate percentiles
lower_percentile = np.percentile(data, 1)
upper_percentile = np.percentile(data, 99)
Identify outliers
outliers = [x for x in data if x < lower_percentile or x > upper_percentile]
print("Outliers:", outliers)
# Apply Winsorization
winsorized_data = winsorize(data, limits=[0.01, 0.01])
print("Winsorized Data:", list(winsorized_data))
Key Points:
Percentile and Winsorization methods are useful for skewed data.
Winsorization is preferred when data integrity must be preserved.
Final Thoughts
Outliers can be tricky, but understanding how to detect and handle them is a key skill in machine learning and data science. Whether you use the IQR method, Z-score, or Wins
orization, always tailor your approach to the specific dataset you’re working with.
By mastering these techniques, you’ll be able to clean your data effectively and improve the accuracy of your models.
#science#skills#programming#bigdata#books#machinelearning#artificial intelligence#python#machine learning#data centers#outliers#big data#data analysis#data analytics#data scientist#database#datascience#data
4 notes
·
View notes
Text
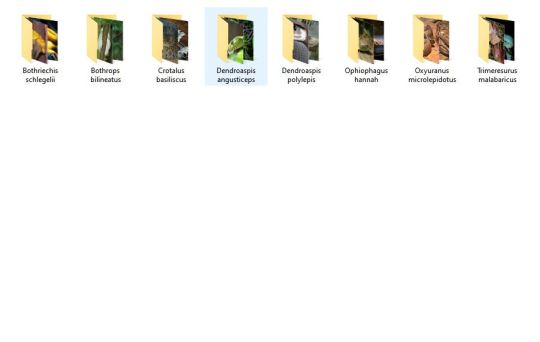
Tonight I am hunting down venomous and nonvenomous snake pictures that are under the creative commons of specific breeds in order to create one of the most advanced, in depth datasets of different venomous and nonvenomous snakes as well as a test set that will include snakes from both sides of all species. I love snakes a lot and really, all reptiles. It is definitely tedious work, as I have to make sure each picture is cleared before I can use it (ethically), but I am making a lot of progress! I have species such as the King Cobra, Inland Taipan, and Eyelash Pit Viper among just a few! Wikimedia Commons has been a huge help!
I'm super excited.
Hope your nights are going good. I am still not feeling good but jamming + virtual snake hunting is keeping me busy!
#programming#data science#data scientist#data analysis#neural networks#image processing#artificial intelligence#machine learning#snakes#snake#reptiles#reptile#herpetology#animals#biology#science#programming project#dataset#kaggle#coding
43 notes
·
View notes
Text
Mars Crater Study-1
This article was written as a practice exercise with reference to the information provided in the COURSERA course, specifically the Mars Crater Study.
=========================================
My program,
import pandas as pd
import statsmodels.formula.api as smf
# Set display format
pd.set_option('display.float_format', lambda x: '%.2f' % x)
# Read dataset
data = pd.read_csv('marscrater_pds.csv')
# Convert necessary variables to numeric format
data['DIAM_CIRCLE_IMAGE'] = pd.to_numeric(data['DIAM_CIRCLE_IMAGE'], errors='coerce')
data['DEPTH_RIMFLOOR_TOPOG'] = pd.to_numeric(data['DEPTH_RIMFLOOR_TOPOG'], errors='coerce')
# Perform basic linear regression analysis
print("OLS regression model for the association between crater diameter and depth")
reg1 = smf.ols('DEPTH_RIMFLOOR_TOPOG ~ DIAM_CIRCLE_IMAGE', data=data).fit()
print(reg1.summary())
=========================================
Output results,
Dep. Variable: DEPTH_RIMFLOOR_TOPOG
R-squared:0.344
Model: OLS
Adj. R-squared:0.344
Method:Least Squares
F-statistic:2.018e+05
Date:Thu, 27 Mar 2025
Prob (F-statistic):0.00
Time:14:58:20
Log-Likelihood:1.1503e+05
No. Observations:384343
AIC:-2.301e+05
Df Residuals:384341
BIC:-2.300e+05
Df Model: 1
Covariance Type:nonrobust
coef std err t P>|t| [0.025 0.975]
Intercept 0.0220 0.000 70.370 0.000 0.021 0.023
DIAM_CIRCLE_IMAGE
0.0151 3.37e-05 449.169 0.000 0.015 0.015
Omnibus:390327.615
Durbin-Watson:1.276
Prob(Omnibus):0.000
Jarque-Bera (JB):4086668077.223
Skew: -3.506
Prob(JB):0.00
Kurtosis:508.113
Cond. No.10.1
=========================================
Results Summary:
Regression Model Results:
R-squared: 0.344, indicating that the model explains approximately 34.4% of the variability in crater depth.
Regression Coefficient (DIAMCIRCLEIMAGE): 0.0151, meaning that for each unit increase in crater diameter, the depth increases by an average of 0.0151 units.
p-value: 0.000, indicating that the effect of diameter on depth is statistically significant.
Intercept: 0.0220, which is the predicted crater depth when the diameter is zero.
Conclusion:
The analysis shows a significant positive association between crater diameter and depth. While the model provides some explanatory power, other factors likely influence crater depth, and further exploration is recommended.
2 notes
·
View notes
Text
What Are the Qualifications for a Data Scientist?
In today's data-driven world, the role of a data scientist has become one of the most coveted career paths. With businesses relying on data for decision-making, understanding customer behavior, and improving products, the demand for skilled professionals who can analyze, interpret, and extract value from data is at an all-time high. If you're wondering what qualifications are needed to become a successful data scientist, how DataCouncil can help you get there, and why a data science course in Pune is a great option, this blog has the answers.
The Key Qualifications for a Data Scientist
To succeed as a data scientist, a mix of technical skills, education, and hands-on experience is essential. Here are the core qualifications required:
1. Educational Background
A strong foundation in mathematics, statistics, or computer science is typically expected. Most data scientists hold at least a bachelor’s degree in one of these fields, with many pursuing higher education such as a master's or a Ph.D. A data science course in Pune with DataCouncil can bridge this gap, offering the academic and practical knowledge required for a strong start in the industry.
2. Proficiency in Programming Languages
Programming is at the heart of data science. You need to be comfortable with languages like Python, R, and SQL, which are widely used for data analysis, machine learning, and database management. A comprehensive data science course in Pune will teach these programming skills from scratch, ensuring you become proficient in coding for data science tasks.
3. Understanding of Machine Learning
Data scientists must have a solid grasp of machine learning techniques and algorithms such as regression, clustering, and decision trees. By enrolling in a DataCouncil course, you'll learn how to implement machine learning models to analyze data and make predictions, an essential qualification for landing a data science job.
4. Data Wrangling Skills
Raw data is often messy and unstructured, and a good data scientist needs to be adept at cleaning and processing data before it can be analyzed. DataCouncil's data science course in Pune includes practical training in tools like Pandas and Numpy for effective data wrangling, helping you develop a strong skill set in this critical area.
5. Statistical Knowledge
Statistical analysis forms the backbone of data science. Knowledge of probability, hypothesis testing, and statistical modeling allows data scientists to draw meaningful insights from data. A structured data science course in Pune offers the theoretical and practical aspects of statistics required to excel.
6. Communication and Data Visualization Skills
Being able to explain your findings in a clear and concise manner is crucial. Data scientists often need to communicate with non-technical stakeholders, making tools like Tableau, Power BI, and Matplotlib essential for creating insightful visualizations. DataCouncil’s data science course in Pune includes modules on data visualization, which can help you present data in a way that’s easy to understand.
7. Domain Knowledge
Apart from technical skills, understanding the industry you work in is a major asset. Whether it’s healthcare, finance, or e-commerce, knowing how data applies within your industry will set you apart from the competition. DataCouncil's data science course in Pune is designed to offer case studies from multiple industries, helping students gain domain-specific insights.
Why Choose DataCouncil for a Data Science Course in Pune?
If you're looking to build a successful career as a data scientist, enrolling in a data science course in Pune with DataCouncil can be your first step toward reaching your goals. Here’s why DataCouncil is the ideal choice:
Comprehensive Curriculum: The course covers everything from the basics of data science to advanced machine learning techniques.
Hands-On Projects: You'll work on real-world projects that mimic the challenges faced by data scientists in various industries.
Experienced Faculty: Learn from industry professionals who have years of experience in data science and analytics.
100% Placement Support: DataCouncil provides job assistance to help you land a data science job in Pune or anywhere else, making it a great investment in your future.
Flexible Learning Options: With both weekday and weekend batches, DataCouncil ensures that you can learn at your own pace without compromising your current commitments.
Conclusion
Becoming a data scientist requires a combination of technical expertise, analytical skills, and industry knowledge. By enrolling in a data science course in Pune with DataCouncil, you can gain all the qualifications you need to thrive in this exciting field. Whether you're a fresher looking to start your career or a professional wanting to upskill, this course will equip you with the knowledge, skills, and practical experience to succeed as a data scientist.
Explore DataCouncil’s offerings today and take the first step toward unlocking a rewarding career in data science! Looking for the best data science course in Pune? DataCouncil offers comprehensive data science classes in Pune, designed to equip you with the skills to excel in this booming field. Our data science course in Pune covers everything from data analysis to machine learning, with competitive data science course fees in Pune. We provide job-oriented programs, making us the best institute for data science in Pune with placement support. Explore online data science training in Pune and take your career to new heights!
#In today's data-driven world#the role of a data scientist has become one of the most coveted career paths. With businesses relying on data for decision-making#understanding customer behavior#and improving products#the demand for skilled professionals who can analyze#interpret#and extract value from data is at an all-time high. If you're wondering what qualifications are needed to become a successful data scientis#how DataCouncil can help you get there#and why a data science course in Pune is a great option#this blog has the answers.#The Key Qualifications for a Data Scientist#To succeed as a data scientist#a mix of technical skills#education#and hands-on experience is essential. Here are the core qualifications required:#1. Educational Background#A strong foundation in mathematics#statistics#or computer science is typically expected. Most data scientists hold at least a bachelor’s degree in one of these fields#with many pursuing higher education such as a master's or a Ph.D. A data science course in Pune with DataCouncil can bridge this gap#offering the academic and practical knowledge required for a strong start in the industry.#2. Proficiency in Programming Languages#Programming is at the heart of data science. You need to be comfortable with languages like Python#R#and SQL#which are widely used for data analysis#machine learning#and database management. A comprehensive data science course in Pune will teach these programming skills from scratch#ensuring you become proficient in coding for data science tasks.#3. Understanding of Machine Learning
3 notes
·
View notes
Text
Free R Programming Course – Learn Data Skills and Earn a Certificate! 🚀
Free R Programming Course – Learn Data Skills and Earn a Certificate!
Are you looking to dive into data science or add a powerful programming language to your skill set? This Free R Programming Course is exactly what you need! 🖥️📊
Here’s what’s included:
7 hours of self-paced video lessons
A Completion Certificate for your resume and LinkedIn
90 days of access to all course content
Whether you’re a beginner or just wanting to boost your data skills, this course covers it all—from foundational concepts to data handling, visualization, and more.
👉 Ready to get started?
Free R Programming Course with Certificate | Start Now

#rprogramming#datascience#learntocode#free course#data analysis#programming#futureready#certification course#dataanalytics#codingcommunity
3 notes
·
View notes
Text
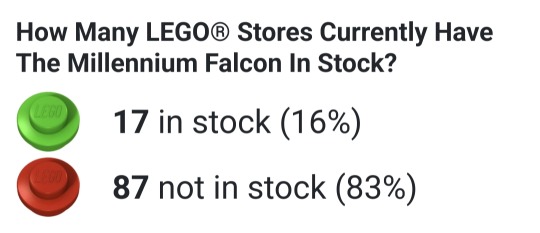
I have made a thing!
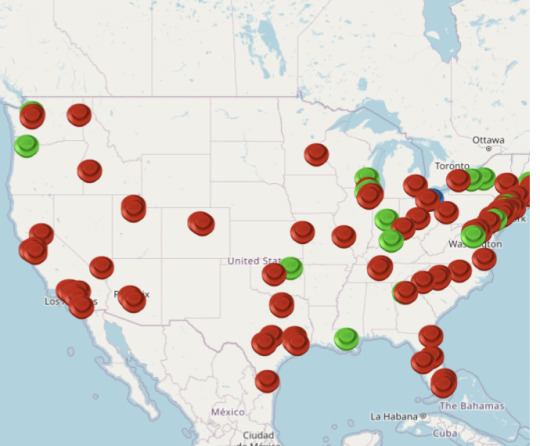
This is a map of every LEGO store in the USA, color coded by whether they have the Millennium Falcon in stock! You can click on every store to get more information about it.
As of posting, this only 16% of LEGO stores had it in stock.
You can get the live version here:
https://clearscope-services.com/lego-millenium-falcon-map/
7 notes
·
View notes
Text
GREAT OPPORTUNITY! This is the link to the American Dream Academy! It's an official partnership between the Milken Center and Coursera to provide learners FREE access to Coursera courses from top companies like IBM, Meta, Google, Amazon, Intuit, and Salesforce focused on in-demand skills like data analysis, IT support, cybersecurity, project management, UX Design, front-end and back-end development, sales operations and development, cloud solutions architecture, bookkeeping, and digital marketing.
They also provide FREE courses that will help you build soft skills such as communications, critical thinking, leadership, financial literacy, human skills and growth mindset.
I'm personally taking a bunch of courses myself and I can fully say that this is legit! I'm taking Frontend Development and Backend Development from Meta and the UX Design Course from Google. It's great because usually these courses cost a lot of money but I'm doing it all and getting certified for FREE! I already have a few certificates under my belt that I can use on my resume! 😎
Unfortunately, the American Dream Academy program will be ending in 2024 and the last day to sign up for this is NOVEMBER 1st! (They extended the deadline) Make sure you sign up by this date so you don't miss out! 💞
#coding#codeblr#web development#programming#ux desgin#digital marketing#data analysis#project management#cybersecurity#cloud solutions#courses#free courses#resources
11 notes
·
View notes
Text
#People keep asking a lot of questions already answered by my 'not a faller' shirt-
Leilani's suit fully protects her from ultra-radiation, as a good space suit ought to. She also has a device from the URS that cloaks her from Ultra Beasts and, more importantly, Necrozma. Her "starblaster" (wormhole device) and all other tech on her suit is powered by that radiation and charges itself whenever she jumps.
4 notes
·
View notes
Text
DRV3 trial camera test tool I made the other day. It's kinda garbage and has a bunch of unimplemented/buggy features, but it works! Probably won't work on this again for a while though...
#drv3#danganronpa v3#danganronpa modding#kaede akamatsu#built some data analysis programs with “real code” to put all this together... my education is paying off
8 notes
·
View notes
Text
2 notes
·
View notes
Text
looking at a blank excel sheet and a stack of 4 years of course evals like "where do I even start here"
#//juri speaks#lamenting the lack of proper research in either my undergrad or master's programs now..........#i would just use Forms and let it do the analysis for me#but i dont know what all they want to be able to do with the data#i AM going to recommend they use a digital eval in future years
2 notes
·
View notes
Text

Learn Python To Secure Your Future In Data Science
Python is one of the most important coding or programming languages that is used by more than 8 million programmers as their main programming language.Now let's talk about how to learn Python. Python language is the basic and the easiest language compared to any other language.
To more info Visit us :- https://www.sssi.in/blog/engineering/learn-python-to-secure-your-future
#learn python#online training python#python developers#python basics#learn python for data analysis#python programming#coding python for beginners
3 notes
·
View notes
Text
leilani's team as of right now is Bacon the Bagon (given to her by Lance), Luna the Clefairy (joined her after she got lost on Mt. Moon), Melody the Popplio (given to her by Ree), and ??? the Cosmog (technically not an official team member)
#dimensional data analysis program 💫 headcanon.#I have decided to axe her fakemon UB because design hard :(#and also I'm lazy lol#cosmog is just her +1#so her official team is only 3 pkmn rn
3 notes
·
View notes