#learn python for data analysis
Explore tagged Tumblr posts
Visit Tumblr Blog
Explore Tumblr blogs with no restrictions, modern design and the best experience.
Last Seen Tumblr Blogs


Fun Fact
130K people were victims of a chain letter scam that affected Tumblr in May 2011.
Text

Learn Python To Secure Your Future In Data Science
Python is one of the most important coding or programming languages that is used by more than 8 million programmers as their main programming language.Now let's talk about how to learn Python. Python language is the basic and the easiest language compared to any other language.
To more info Visit us :- https://www.sssi.in/blog/engineering/learn-python-to-secure-your-future
#learn python#online training python#python developers#python basics#learn python for data analysis#python programming#coding python for beginners
3 notes
·
View notes
Text
Understanding Outliers in Machine Learning and Data Science

In machine learning and data science, an outlier is like a misfit in a dataset. It's a data point that stands out significantly from the rest of the data. Sometimes, these outliers are errors, while other times, they reveal something truly interesting about the data. Either way, handling outliers is a crucial step in the data preprocessing stage. If left unchecked, they can skew your analysis and even mess up your machine learning models.
In this article, we will dive into:
1. What outliers are and why they matter.
2. How to detect and remove outliers using the Interquartile Range (IQR) method.
3. Using the Z-score method for outlier detection and removal.
4. How the Percentile Method and Winsorization techniques can help handle outliers.
This guide will explain each method in simple terms with Python code examples so that even beginners can follow along.
1. What Are Outliers?
An outlier is a data point that lies far outside the range of most other values in your dataset. For example, in a list of incomes, most people might earn between $30,000 and $70,000, but someone earning $5,000,000 would be an outlier.
Why Are Outliers Important?
Outliers can be problematic or insightful:
Problematic Outliers: Errors in data entry, sensor faults, or sampling issues.
Insightful Outliers: They might indicate fraud, unusual trends, or new patterns.
Types of Outliers
1. Univariate Outliers: These are extreme values in a single variable.
Example: A temperature of 300°F in a dataset about room temperatures.
2. Multivariate Outliers: These involve unusual combinations of values in multiple variables.
Example: A person with an unusually high income but a very low age.
3. Contextual Outliers: These depend on the context.
Example: A high temperature in winter might be an outlier, but not in summer.
2. Outlier Detection and Removal Using the IQR Method
The Interquartile Range (IQR) method is one of the simplest ways to detect outliers. It works by identifying the middle 50% of your data and marking anything that falls far outside this range as an outlier.
Steps:
1. Calculate the 25th percentile (Q1) and 75th percentile (Q3) of your data.
2. Compute the IQR:
{IQR} = Q3 - Q1
Q1 - 1.5 \times \text{IQR}
Q3 + 1.5 \times \text{IQR} ] 4. Anything below the lower bound or above the upper bound is an outlier.
Python Example:
import pandas as pd
# Sample dataset
data = {'Values': [12, 14, 18, 22, 25, 28, 32, 95, 100]}
df = pd.DataFrame(data)
# Calculate Q1, Q3, and IQR
Q1 = df['Values'].quantile(0.25)
Q3 = df['Values'].quantile(0.75)
IQR = Q3 - Q1
# Define the bounds
lower_bound = Q1 - 1.5 * IQR
upper_bound = Q3 + 1.5 * IQR
# Identify and remove outliers
outliers = df[(df['Values'] < lower_bound) | (df['Values'] > upper_bound)]
print("Outliers:\n", outliers)
filtered_data = df[(df['Values'] >= lower_bound) & (df['Values'] <= upper_bound)]
print("Filtered Data:\n", filtered_data)
Key Points:
The IQR method is great for univariate datasets.
It works well when the data isn’t skewed or heavily distributed.
3. Outlier Detection and Removal Using the Z-Score Method
The Z-score method measures how far a data point is from the mean, in terms of standard deviations. If a Z-score is greater than a certain threshold (commonly 3 or -3), it is considered an outlier.
Formula:
Z = \frac{(X - \mu)}{\sigma}
is the data point,
is the mean of the dataset,
is the standard deviation.
Python Example:
import numpy as np
# Sample dataset
data = {'Values': [12, 14, 18, 22, 25, 28, 32, 95, 100]}
df = pd.DataFrame(data)
# Calculate mean and standard deviation
mean = df['Values'].mean()
std_dev = df['Values'].std()
# Compute Z-scores
df['Z-Score'] = (df['Values'] - mean) / std_dev
# Identify and remove outliers
threshold = 3
outliers = df[(df['Z-Score'] > threshold) | (df['Z-Score'] < -threshold)]
print("Outliers:\n", outliers)
filtered_data = df[(df['Z-Score'] <= threshold) & (df['Z-Score'] >= -threshold)]
print("Filtered Data:\n", filtered_data)
Key Points:
The Z-score method assumes the data follows a normal distribution.
It may not work well with skewed datasets.
4. Outlier Detection Using the Percentile Method and Winsorization
Percentile Method:
In the percentile method, we define a lower percentile (e.g., 1st percentile) and an upper percentile (e.g., 99th percentile). Any value outside this range is treated as an outlier.
Winsorization:
Winsorization is a technique where outliers are not removed but replaced with the nearest acceptable value.
Python Example:
from scipy.stats.mstats import winsorize
import numpy as np
Sample data
data = [12, 14, 18, 22, 25, 28, 32, 95, 100]
Calculate percentiles
lower_percentile = np.percentile(data, 1)
upper_percentile = np.percentile(data, 99)
Identify outliers
outliers = [x for x in data if x < lower_percentile or x > upper_percentile]
print("Outliers:", outliers)
# Apply Winsorization
winsorized_data = winsorize(data, limits=[0.01, 0.01])
print("Winsorized Data:", list(winsorized_data))
Key Points:
Percentile and Winsorization methods are useful for skewed data.
Winsorization is preferred when data integrity must be preserved.
Final Thoughts
Outliers can be tricky, but understanding how to detect and handle them is a key skill in machine learning and data science. Whether you use the IQR method, Z-score, or Wins
orization, always tailor your approach to the specific dataset you’re working with.
By mastering these techniques, you’ll be able to clean your data effectively and improve the accuracy of your models.
#science#skills#programming#bigdata#books#machinelearning#artificial intelligence#python#machine learning#data centers#outliers#big data#data analysis#data analytics#data scientist#database#datascience#data
4 notes
·
View notes
Text
Coursera - Data Analysis and Interpretation Specialization
I have chosen Mars Craters for my research dataset! Research question: How Do Crater Size and Depth Influence Ejecta Morphology in Mars Crater Data?
Topic 2: How Do Crater Size and Depth Influence Ejecta Morphology and the Number of Ejecta Layers in Martian Impact Craters?
Abstract of the study:
Ejecta morphology offers a window into the impact processes and surface properties of planetary bodies. This study leverages a high-resolution Mars crater dataset comprising over 44,000 entries among 380k entries with classified ejecta morphologies, focusing on how crater diameter and depth influence ejecta type. Crater size and rim-to-floor depth are examined whether they serve as reliable predictors of ejecta morphology complexity. Using statistical methods, we assess the relationship between crater dimensions and the occurrence of specific ejecta morphologies and number of layers.
Research Papers Referred:
Nadine G. Barlow., "Martian impact crater ejecta morphologies as indicators of the distribution of subsurface volatiles"
R. H. Hoover1 , S. J. Robbins , N. E. Putzig, J. D. Riggs, and B. M. Hynek. "Insight Into Formation Processes of Layered Ejecta Craters onMars From Thermophysical Observations"
2 notes
·
View notes
Text
What Are the Qualifications for a Data Scientist?
In today's data-driven world, the role of a data scientist has become one of the most coveted career paths. With businesses relying on data for decision-making, understanding customer behavior, and improving products, the demand for skilled professionals who can analyze, interpret, and extract value from data is at an all-time high. If you're wondering what qualifications are needed to become a successful data scientist, how DataCouncil can help you get there, and why a data science course in Pune is a great option, this blog has the answers.
The Key Qualifications for a Data Scientist
To succeed as a data scientist, a mix of technical skills, education, and hands-on experience is essential. Here are the core qualifications required:
1. Educational Background
A strong foundation in mathematics, statistics, or computer science is typically expected. Most data scientists hold at least a bachelor’s degree in one of these fields, with many pursuing higher education such as a master's or a Ph.D. A data science course in Pune with DataCouncil can bridge this gap, offering the academic and practical knowledge required for a strong start in the industry.
2. Proficiency in Programming Languages
Programming is at the heart of data science. You need to be comfortable with languages like Python, R, and SQL, which are widely used for data analysis, machine learning, and database management. A comprehensive data science course in Pune will teach these programming skills from scratch, ensuring you become proficient in coding for data science tasks.
3. Understanding of Machine Learning
Data scientists must have a solid grasp of machine learning techniques and algorithms such as regression, clustering, and decision trees. By enrolling in a DataCouncil course, you'll learn how to implement machine learning models to analyze data and make predictions, an essential qualification for landing a data science job.
4. Data Wrangling Skills
Raw data is often messy and unstructured, and a good data scientist needs to be adept at cleaning and processing data before it can be analyzed. DataCouncil's data science course in Pune includes practical training in tools like Pandas and Numpy for effective data wrangling, helping you develop a strong skill set in this critical area.
5. Statistical Knowledge
Statistical analysis forms the backbone of data science. Knowledge of probability, hypothesis testing, and statistical modeling allows data scientists to draw meaningful insights from data. A structured data science course in Pune offers the theoretical and practical aspects of statistics required to excel.
6. Communication and Data Visualization Skills
Being able to explain your findings in a clear and concise manner is crucial. Data scientists often need to communicate with non-technical stakeholders, making tools like Tableau, Power BI, and Matplotlib essential for creating insightful visualizations. DataCouncil’s data science course in Pune includes modules on data visualization, which can help you present data in a way that’s easy to understand.
7. Domain Knowledge
Apart from technical skills, understanding the industry you work in is a major asset. Whether it’s healthcare, finance, or e-commerce, knowing how data applies within your industry will set you apart from the competition. DataCouncil's data science course in Pune is designed to offer case studies from multiple industries, helping students gain domain-specific insights.
Why Choose DataCouncil for a Data Science Course in Pune?
If you're looking to build a successful career as a data scientist, enrolling in a data science course in Pune with DataCouncil can be your first step toward reaching your goals. Here’s why DataCouncil is the ideal choice:
Comprehensive Curriculum: The course covers everything from the basics of data science to advanced machine learning techniques.
Hands-On Projects: You'll work on real-world projects that mimic the challenges faced by data scientists in various industries.
Experienced Faculty: Learn from industry professionals who have years of experience in data science and analytics.
100% Placement Support: DataCouncil provides job assistance to help you land a data science job in Pune or anywhere else, making it a great investment in your future.
Flexible Learning Options: With both weekday and weekend batches, DataCouncil ensures that you can learn at your own pace without compromising your current commitments.
Conclusion
Becoming a data scientist requires a combination of technical expertise, analytical skills, and industry knowledge. By enrolling in a data science course in Pune with DataCouncil, you can gain all the qualifications you need to thrive in this exciting field. Whether you're a fresher looking to start your career or a professional wanting to upskill, this course will equip you with the knowledge, skills, and practical experience to succeed as a data scientist.
Explore DataCouncil’s offerings today and take the first step toward unlocking a rewarding career in data science! Looking for the best data science course in Pune? DataCouncil offers comprehensive data science classes in Pune, designed to equip you with the skills to excel in this booming field. Our data science course in Pune covers everything from data analysis to machine learning, with competitive data science course fees in Pune. We provide job-oriented programs, making us the best institute for data science in Pune with placement support. Explore online data science training in Pune and take your career to new heights!
#In today's data-driven world#the role of a data scientist has become one of the most coveted career paths. With businesses relying on data for decision-making#understanding customer behavior#and improving products#the demand for skilled professionals who can analyze#interpret#and extract value from data is at an all-time high. If you're wondering what qualifications are needed to become a successful data scientis#how DataCouncil can help you get there#and why a data science course in Pune is a great option#this blog has the answers.#The Key Qualifications for a Data Scientist#To succeed as a data scientist#a mix of technical skills#education#and hands-on experience is essential. Here are the core qualifications required:#1. Educational Background#A strong foundation in mathematics#statistics#or computer science is typically expected. Most data scientists hold at least a bachelor’s degree in one of these fields#with many pursuing higher education such as a master's or a Ph.D. A data science course in Pune with DataCouncil can bridge this gap#offering the academic and practical knowledge required for a strong start in the industry.#2. Proficiency in Programming Languages#Programming is at the heart of data science. You need to be comfortable with languages like Python#R#and SQL#which are widely used for data analysis#machine learning#and database management. A comprehensive data science course in Pune will teach these programming skills from scratch#ensuring you become proficient in coding for data science tasks.#3. Understanding of Machine Learning
3 notes
·
View notes
Text
2 notes
·
View notes
Text
Hyperparameter tuning in machine learning
The performance of a machine learning model in the dynamic world of artificial intelligence is crucial, we have various algorithms for finding a solution to a business problem. Some algorithms like linear regression , logistic regression have parameters whose values are fixed so we have to use those models without any modifications for training a model but there are some algorithms out there where the values of parameters are not fixed.
Here's a complete guide to Hyperparameter tuning in machine learning in Python!
#datascience #dataanalytics #dataanalysis #statistics #machinelearning #python #deeplearning #supervisedlearning #unsupervisedlearning
#machine learning#data analysis#data science#artificial intelligence#data analytics#deep learning#python#statistics#unsupervised learning#feature selection
3 notes
·
View notes
Text
Understanding IHD with Data Science
Ischemic Heart Disease (IHD), more commonly recognized as coronary artery disease, is a profound health concern that stems from a decreased blood supply to the heart. Such a decrease is typically due to fatty deposits or plaques narrowing the coronary arteries. These arteries, as vital conduits delivering oxygen-rich blood to the heart, play a paramount role in ensuring the heart's efficient functioning. An obstruction or reduced flow within these arteries can usher in adverse outcomes, with heart attacks being the most dire. Given the gravity of IHD, the global medical community emphasizes the essence of early detection and prompt intervention to manage its repercussions effectively.
A New Age in Healthcare: Embracing Data Science
As we stand on the cusp of the fourth industrial revolution, technology's intertwining with every domain is evident. The healthcare sector is no exception. The integration of data science in healthcare is not merely an augmentation; it's a paradigm shift. Data science, with its vast array of tools and methodologies, is fostering new avenues to understand, diagnose, and even predict various health conditions long before they manifest pronounced symptoms.
Machine Learning: The Vanguard of Modern Medical Research
Among the myriad of tools under the vast umbrella of data science, Machine Learning (ML) shines exceptionally bright. An essential offshoot of artificial intelligence, ML capitalizes on algorithms and statistical models, granting computers the capability to process vast amounts of data and discern patterns without being explicitly programmed.
In the healthcare realm, the applications of ML are manifold. From predicting potential disease outbreaks based on global health data trends to optimizing patient flow in bustling hospitals, ML is progressively becoming a linchpin in medical operations. One of its most lauded applications, however, is its prowess in early disease prediction, and IHD detection stands as a testament to this.
Drawn to the immense potential ML holds, I ventured into a research project aimed at harnessing the RandomForestClassifier model's capabilities. Within the medical research sphere, this model is celebrated for its robustness and adaptability, making it a prime choice for my endeavor.
Deep Dive into the Findings
The results from the ML model were heartening. With an accuracy rate of 90%, the model’s prowess in discerning the presence of IHD based on an array of parameters was evident. Such a high accuracy rate is pivotal, considering the stakes at hand – the very health of a human heart. 9 times out of 10 the model is correct at its predictions.
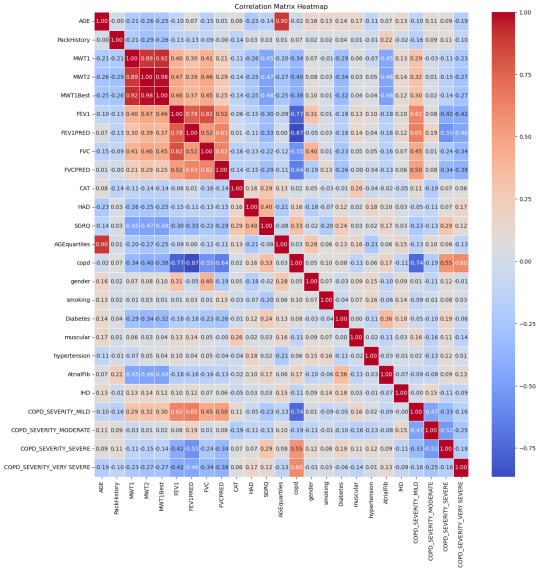
Breaking down the data, some correlations with IHD stood out prominently:
Moderate COPD (Chronic Obstructive Pulmonary Disease) – 15%: COPD's inclusion is noteworthy. While primarily a lung condition, its linkage with heart health has been a topic of numerous studies. A compromised respiratory system can inadvertently strain the heart, underscoring the interconnectedness of our bodily systems.
Diabetes – 18%: The correlation between diabetes and heart health isn't novel. Elevated blood sugar levels over extended periods can damage blood vessels, including the coronary arteries.
Age (segmented in quarterlies) – 15%: Age, as an immutable factor, plays a significant role. With age, several bodily systems gradually wear down, rendering individuals more susceptible to a plethora of conditions, IHD included.
Smoking habits – 14%: The deleterious effects of smoking on lung health are well-documented. However, its impact extends to the cardiovascular system, with nicotine and other chemicals adversely affecting heart functions.
MWT1 and MWT2 (indicators of physical endurance) – 13% and 14% respectively: Physical endurance and heart health share an intimate bond. These metrics, gauging one's physical stamina, can be precursors to potential heart-related anomalies.
Redefining Patient Care in the Machine Learning Era
Armed with these insights, healthcare can transcend its conventional boundaries. A deeper understanding of IHD's contributors empowers medical professionals to devise comprehensive care strategies that are both preventive and curative.
Moreover, the revelations from this study underscore the potential for proactive medical interventions. Instead of being reactive, waiting for symptoms to manifest, healthcare providers can now adopt a preventive stance. Patients exhibiting the highlighted risk factors can be placed under more meticulous observation, ensuring that potential IHD developments are nipped in the bud.
With the infusion of machine learning, healthcare is on the cusp of a personalized revolution. Gone are the days of one-size-fits-all medical approaches. Recognizing the uniqueness of each patient's health profile, machine learning models like the one employed in this study can pave the way for hyper-personalized care regimens.
As machine learning continues to entrench itself in healthcare, a future where disease predictions are accurate, interventions are timely, and patient care is unparalleled isn't merely a vision; it's an impending reality.
#heart disease#ihd#ischemic heart disease#programming#programmer#python#python programming#machine learning#data analysis#data science#data visualization#aicommunity#ai#artificial intelligence#medical research#medical technology
3 notes
·
View notes
Text
Python 3.12.0 is on the horizon, promising groundbreaking features! Expect robust error handling, precise typing, and major performance boosts. This release isn’t just an update; it’s a leap for developer productivity and innovation. What features excite you the most? Join the conversation!
#python#update#web development#data analysis#machine learning#pyhthon development#pythonprogramming#mobiosolutions
2 notes
·
View notes
Text
Python Programming Course with Certification – Live Online
Join Sunbeam’s Live Online Python Programming Course and kickstart your journey in coding, automation, data analysis, and AI. Guided by expert Mr. Nilesh Ghule, this course offers a structured curriculum, hands-on practice, and live Q&A. 📅 Start Date: 2nd June 2025 🕒 Timing: 7:00 PM – 9:00 PM (Mon to Fri) 💰 Fees: ₹8100 (Inclusive GST) 🎓 Certification + Project + Group Discount 🔗 Register now at www.sunbeaminfo.in 📞 Contact: 82 82 82 9806
✅ Bonus Group Offer:
👨👩👧👦 Team of Five, Time to Thrive! Get 20% OFF on learning when enrolling in a group of five!
✅ What You'll Learn:
Python basics to advanced topics
Data analysis using NumPy & Pandas
Visualization with Matplotlib
Web & functional programming
Image processing using OpenCV
Real-time projects and problem-solving
✅ Who Should Join:
College students, freshers, and job seekers
Working professionals aiming to upskill
Anyone with basic programming knowledge
#“Python online course”#“Learn Python in Pune”#“Python training with certification”#“Live Python classes”#“Python classes for beginners”#“Best Python course in India”#“Python for data analysis”#“Instructor-led Python training”#“Affordable Python course”#“Python programming course Pune”#“Python course with projects”#“Data science Python course”
0 notes
Text
Your Data Career Starts Here: DICS Institute in Laxmi Nagar

In a world driven by data, those who can interpret it hold the power. From predicting market trends to driving smarter business decisions, data analysts are shaping the future. If you’re looking to ride the data wave and build a high-demand career, your journey begins with choosing the Best Data Analytics Institute in Laxmi Nagar.
Why Data Analytics? Why Now?
Companies across the globe are investing heavily in data analytics to stay competitive. This boom has opened up exciting opportunities for data professionals with the right skills. But success in this field depends on one critical decision — where you learn. And that’s where Laxmi Nagar, Delhi’s thriving educational hub, comes into play.
Discover Excellence at the Best Data Analytics Institute in Laxmi Nagar
When it comes to learning data analytics, you need more than just lectures — you need an experience. The Best Data Analytics Institute in Laxmi Nagar offers exactly that, combining practical training with industry insights to ensure you’re not just learning, but evolving.
Here’s what makes it a top choice for aspiring analysts:
Real-World Curriculum: Learn the tools and technologies actually used in the industry — Python, SQL, Power BI, Excel, Tableau, and more — with modules designed to match current job market needs.
Project-Based Learning: The institute doesn’t just teach concepts — it puts them into practice. You’ll work on live projects, business case studies, and analytics problems that mimic real-life scenarios.
Expert Mentors: Get trained by data professionals with years of hands-on experience. Their mentorship gives you an insider’s edge and prepares you to tackle interviews and workplace challenges with confidence.
Smart Class Formats: Whether you’re a student, jobseeker, or working professional, the flexible batch options — including weekend and online classes — ensure you don’t miss a beat.
Career Support That Works: From resume crafting and portfolio building to mock interviews and job referrals, the placement team works closely with students until they land their dream role.
Enroll in the Best Data Analytics Course in Laxmi Nagar
The Best Data Analytics Course in Laxmi Nagar goes beyond the basics. It’s a complete roadmap for mastering data — right from data collection and cleaning, to analysis, visualization, and even predictive modeling.
This course is ideal for beginners, professionals looking to upskill, or anyone ready for a career switch. You’ll gain hands-on expertise, problem-solving skills, and a strong foundation that puts you ahead of the curve.
Your Data Career Starts Here
The future belongs to those who understand data. With the Best Data Analytics Institute in Laxmi Nagar and the Best Data Analytics Course in Laxmi Nagar, you’re not just preparing for a job — you’re investing in a thriving, future-proof career.
Ready to become a data expert? Enroll today and take the first step toward transforming your future — one dataset at a time.
#Data Analytics#Data Science#Business Intelligence#Machine Learning#Data Visualization#Python for Data Analysis#SQL Training#Power BI
0 notes
Text

>> Also does anyone have a muse interest tracker that doesn't involve Google, Microsoft or AI services?
#˗ˏˋ ooc ˎˊ˗ ᴡᴏʀᴅ ꜰʀᴏᴍ ᴛʜᴇ ʜᴏꜱᴛ#[ I HATE AI AND I SAY THAT AS SOMEONE WHO STUDIED MACHINE LEARNING ]#[ no but for real there are so many ways you can make genAI ethical & not as harmful for the environment - but tech bros can't have that co#[ they insist on using Python which is slow & takes lots of resources when C & C++ can do the job (I also know there's a specific#terminal-based p. language for processing NLP that takes 1/1000 of the time & resources Python takes) ]#[ not to mention there ARE data sets free to use / have a fee attached but are ethical to use but when did tech bros care about consent? ]#[ in my uni you could literally lose your degree if you use GenAI to write anything or use unavailable for usage data sets ]#[ also the way I wrote several papers on how analysis AI can help with processing scientific data only for big corporations using#that technology to steal anything creative we make - AI has a lot of good usages but this ain't it! ]#[ they could never make me hate you Eliza 🥺 ]
0 notes
Text

Artificial Intelligence Course!
Learn AI from the ground up with expert-led training in machine learning, deep learning, and AI applications. Gain hands-on experience with real-world projects and industry tools to advance your career in AI.
For more information on the Data Science & Machine Learning course, visit the 1stepgrow website:
🔗 1stepgrow.com
📧 Contact: [email protected]
📞 Phone: 8951240606
0 notes
Text

Feature Engineering in Machine Learning: A Beginner's Guide
Feature Engineering in Machine Learning: A Beginner's Guide
Feature engineering is one of the most critical aspects of machine learning and data science. It involves preparing raw data, transforming it into meaningful features, and optimizing it for use in machine learning models. Simply put, it’s all about making your data as informative and useful as possible.
In this article, we’re going to focus on feature transformation, a specific type of feature engineering. We’ll cover its types in detail, including:
1. Missing Value Imputation
2. Handling Categorical Data
3. Outlier Detection
4. Feature Scaling
Each topic will be explained in a simple and beginner-friendly way, followed by Python code examples so you can implement these techniques in your projects.
What is Feature Transformation?
Feature transformation is the process of modifying or optimizing features in a dataset. Why? Because raw data isn’t always machine-learning-friendly. For example:
Missing data can confuse your model.
Categorical data (like colors or cities) needs to be converted into numbers.
Outliers can skew your model’s predictions.
Different scales of features (e.g., age vs. income) can mess up distance-based algorithms like k-NN.
1. Missing Value Imputation
Missing values are common in datasets. They can happen due to various reasons: incomplete surveys, technical issues, or human errors. But machine learning models can’t handle missing data directly, so we need to fill or "impute" these gaps.
Techniques for Missing Value Imputation
1. Dropping Missing Values: This is the simplest method, but it’s risky. If you drop too many rows or columns, you might lose important information.
2. Mean, Median, or Mode Imputation: Replace missing values with the column’s mean (average), median (middle value), or mode (most frequent value).
3. Predictive Imputation: Use a model to predict the missing values based on other features.
Python Code Example:
import pandas as pd
from sklearn.impute import SimpleImputer
# Example dataset
data = {'Age': [25, 30, None, 22, 28], 'Salary': [50000, None, 55000, 52000, 58000]}
df = pd.DataFrame(data)
# Mean imputation
imputer = SimpleImputer(strategy='mean')
df['Age'] = imputer.fit_transform(df[['Age']])
df['Salary'] = imputer.fit_transform(df[['Salary']])
print("After Missing Value Imputation:\n", df)
Key Points:
Use mean/median imputation for numeric data.
Use mode imputation for categorical data.
Always check how much data is missing—if it’s too much, dropping rows might be better.
2. Handling Categorical Data
Categorical data is everywhere: gender, city names, product types. But machine learning algorithms require numerical inputs, so you’ll need to convert these categories into numbers.
Techniques for Handling Categorical Data
1. Label Encoding: Assign a unique number to each category. For example, Male = 0, Female = 1.
2. One-Hot Encoding: Create separate binary columns for each category. For instance, a “City” column with values [New York, Paris] becomes two columns: City_New York and City_Paris.
3. Frequency Encoding: Replace categories with their occurrence frequency.
Python Code Example:
from sklearn.preprocessing import LabelEncoder
import pandas as pd
# Example dataset
data = {'City': ['New York', 'London', 'Paris', 'New York', 'Paris']}
df = pd.DataFrame(data)
# Label Encoding
label_encoder = LabelEncoder()
df['City_LabelEncoded'] = label_encoder.fit_transform(df['City'])
# One-Hot Encoding
df_onehot = pd.get_dummies(df['City'], prefix='City')
print("Label Encoded Data:\n", df)
print("\nOne-Hot Encoded Data:\n", df_onehot)
Key Points:
Use label encoding when categories have an order (e.g., Low, Medium, High).
Use one-hot encoding for non-ordered categories like city names.
For datasets with many categories, one-hot encoding can increase complexity.
3. Outlier Detection
Outliers are extreme data points that lie far outside the normal range of values. They can distort your analysis and negatively affect model performance.
Techniques for Outlier Detection
1. Interquartile Range (IQR): Identify outliers based on the middle 50% of the data (the interquartile range).
IQR = Q3 - Q1
[Q1 - 1.5 \times IQR, Q3 + 1.5 \times IQR]
2. Z-Score: Measures how many standard deviations a data point is from the mean. Values with Z-scores > 3 or < -3 are considered outliers.
Python Code Example (IQR Method):
import pandas as pd
# Example dataset
data = {'Values': [12, 14, 18, 22, 25, 28, 32, 95, 100]}
df = pd.DataFrame(data)
# Calculate IQR
Q1 = df['Values'].quantile(0.25)
Q3 = df['Values'].quantile(0.75)
IQR = Q3 - Q1
# Define bounds
lower_bound = Q1 - 1.5 * IQR
upper_bound = Q3 + 1.5 * IQR
# Identify and remove outliers
outliers = df[(df['Values'] < lower_bound) | (df['Values'] > upper_bound)]
print("Outliers:\n", outliers)
filtered_data = df[(df['Values'] >= lower_bound) & (df['Values'] <= upper_bound)]
print("Filtered Data:\n", filtered_data)
Key Points:
Always understand why outliers exist before removing them.
Visualization (like box plots) can help detect outliers more easily.
4. Feature Scaling
Feature scaling ensures that all numerical features are on the same scale. This is especially important for distance-based models like k-Nearest Neighbors (k-NN) or Support Vector Machines (SVM).
Techniques for Feature Scaling
1. Min-Max Scaling: Scales features to a range of [0, 1].
X' = \frac{X - X_{\text{min}}}{X_{\text{max}} - X_{\text{min}}}
2. Standardization (Z-Score Scaling): Centers data around zero with a standard deviation of 1.
X' = \frac{X - \mu}{\sigma}
3. Robust Scaling: Uses the median and IQR, making it robust to outliers.
Python Code Example:
from sklearn.preprocessing import MinMaxScaler, StandardScaler
import pandas as pd
# Example dataset
data = {'Age': [25, 30, 35, 40, 45], 'Salary': [20000, 30000, 40000, 50000, 60000]}
df = pd.DataFrame(data)
# Min-Max Scaling
scaler = MinMaxScaler()
df_minmax = pd.DataFrame(scaler.fit_transform(df), columns=df.columns)
# Standardization
scaler = StandardScaler()
df_standard = pd.DataFrame(scaler.fit_transform(df), columns=df.columns)
print("Min-Max Scaled Data:\n", df_minmax)
print("\nStandardized Data:\n", df_standard)
Key Points:
Use Min-Max Scaling for algorithms like k-NN and neural networks.
Use Standardization for algorithms that assume normal distributions.
Use Robust Scaling when your data has outliers.
Final Thoughts
Feature transformation is a vital part of the data preprocessing pipeline. By properly imputing missing values, encoding categorical data, handling outliers, and scaling features, you can dramatically improve the performance of your machine learning models.
Summary:
Missing value imputation fills gaps in your data.
Handling categorical data converts non-numeric features into numerical ones.
Outlier detection ensures your dataset isn’t skewed by extreme values.
Feature scaling standardizes feature ranges for better model performance.
Mastering these techniques will help you build better, more reliable machine learning models.
#coding#science#skills#programming#bigdata#machinelearning#artificial intelligence#machine learning#python#featureengineering#data scientist#data analytics#data analysis#big data#data centers#database#datascience#data#books
1 note
·
View note
Text
Cleaned up the primary variable!
My primary variable in question is Ejecta Morphology (MORPHOLOGY_EJECTA_1) and I have cleaned up the primary variable. I have chosen the subsets of the other 3 variables namely Diameter (DIAM_CIRCLE_IMAGE), Depth (DEPTH_RIMFLOOR_TOPOG) and Number of Layers (NUMBER_LAYERS) based on the not null values of the primary variable! I have also grouped the variables for better understanding using bin function. My code: ""
import pandas import numpy
data = pandas.read_csv('MarsCrater.csv', low_memory=False) data.columns = map(str.upper, data.columns)
print("Number of Observations =", len(data)) # rows print("Number of Variables =", len(data.columns)) # columns
data['MORPHOLOGY_EJECTA_1'] = data['MORPHOLOGY_EJECTA_1'].astype(str).str.strip() data['MORPHOLOGY_EJECTA_1'] = data['MORPHOLOGY_EJECTA_1'].replace('', numpy.nan)
data.loc[data['MORPHOLOGY_EJECTA_1'].isnull() & data['DIAM_CIRCLE_IMAGE'].isnull(), 'DIAM_CIRCLE_IMAGE'] = 50000 data.loc[data['MORPHOLOGY_EJECTA_1'].isnull() & data['DEPTH_RIMFLOOR_TOPOG'].isnull(), 'DEPTH_RIMFLOOR_TOPOG'] = 10 data.loc[data['MORPHOLOGY_EJECTA_1'].isnull() & data['NUMBER_LAYERS'].isnull(), 'NUMBER_LAYERS'] = 10
print("Primary Ejecta Morphology") c1 = data['MORPHOLOGY_EJECTA_1'].value_counts(sort=False, dropna=False) print(c1)
print("Primary Ejecta Morphology as %") p1 = data['MORPHOLOGY_EJECTA_1'].value_counts(sort=False, normalize=True, dropna=False) * 100 print(p1)
sub2 = data[data['MORPHOLOGY_EJECTA_1'].notnull()].copy()
dia_bins = [0, 25, 50, data['DIAM_CIRCLE_IMAGE'].max()] dia_names = ['Minor', 'Intermediate', 'Major'] sub2['DIAMETER_NAMES'] = pandas.cut(sub2['DIAM_CIRCLE_IMAGE'], bins=dia_bins, labels=dia_names)
print("Crater Diameter") c2 = sub2['DIAMETER_NAMES'].value_counts(sort=False) print(c2)
print("Crater Diameter as %") p2 = sub2['DIAMETER_NAMES'].value_counts(sort=False, normalize=True) * 100 print(p2)
dep_bins = [0, 0.5, 1, data['DEPTH_RIMFLOOR_TOPOG'].max()] dep_names = ['Low', 'Mid', 'High'] sub2['DEPTH_NAMES'] = pandas.cut(sub2['DEPTH_RIMFLOOR_TOPOG'], bins=dep_bins, labels=dep_names)
print("Crater Depth") c3 = sub2['DEPTH_NAMES'].value_counts(sort=False) print(c3)
print("Crater Depth as %") p3 = sub2['DEPTH_NAMES'].value_counts(sort=False, normalize=True) * 100 print(p3)
print("Number of layers") c4 = sub2['NUMBER_LAYERS'].value_counts(sort=False) print(c4)
print("Number of layers as %") p4 = sub2['NUMBER_LAYERS'].value_counts(sort=False, normalize=True) * 100 print(p4)
""" Output: Number of Observations = 384343 Number of Variables = 10
Primary Ejecta Morphology NaN 339718 Rd/MLERS 199 Rd 24892 Rd/DLEPC/DLERS 33 SLERS 4828
MLEPC/MLERC/MSLEPS 1 DLERCPd/DLERSPd 1 MLERSRd 1 DLERC/Rd/SLERS 1 Rd/SLEPCRd 1 Primary Ejecta Morphology as % NaN 88.389277 Rd/MLERS 0.051777 Rd 6.476507 Rd/DLEPC/DLERS 0.008586 SLERS 1.256170
MLEPC/MLERC/MSLEPS 0.000260 DLERCPd/DLERSPd 0.000260 MLERSRd 0.000260 DLERC/Rd/SLERS 0.000260 Rd/SLEPCRd 0.000260 Crater Diameter Minor 42070 Intermediate 1866 Major 689 Crater Diameter as % Minor 94.274510 Intermediate 4.181513 Major 1.543978 Crater Depth Low 23381 Mid 11582 High 3673 Crater Depth as % Low 60.516099 Mid 29.977223 High 9.506678 Number of layers 3 739 0 24894 2 3435 1 15467 4 85 5 5 Number of layers as % 3 1.656022 0 55.784874 2 7.697479 1 34.659944 4 0.190476 5 0.011204
0 notes
Text
youtube
Machine Learning Foundations Course - Python, Deep Learning, Linear Regression, MLOps
Learn the essentials of AI with this 8-hour Machine Learning Foundations course, one of the most comprehensive open resources we've published online. Starting from the basics of Python, this course swiftly advances through deep learning and linear regression models to MLOps, seamlessly integrating theory with real-world application. We cap off your learning experience with two exclusive interviews featuring industry experts who discuss launching a successful career in tech with zero experience and the keys to starting and growing your own startup. This course is your gateway to mastering machine learning and propelling your career forward.
#free education#education#Machine Learning Foundations Course#Machine Learning Foundations#machine learning#technology#educate yourselves#educate yourself#data analytics#big data#data analysis#coding#software development#deep learning#python language#python tutorial#python#development#software#education for all#Youtube
0 notes


