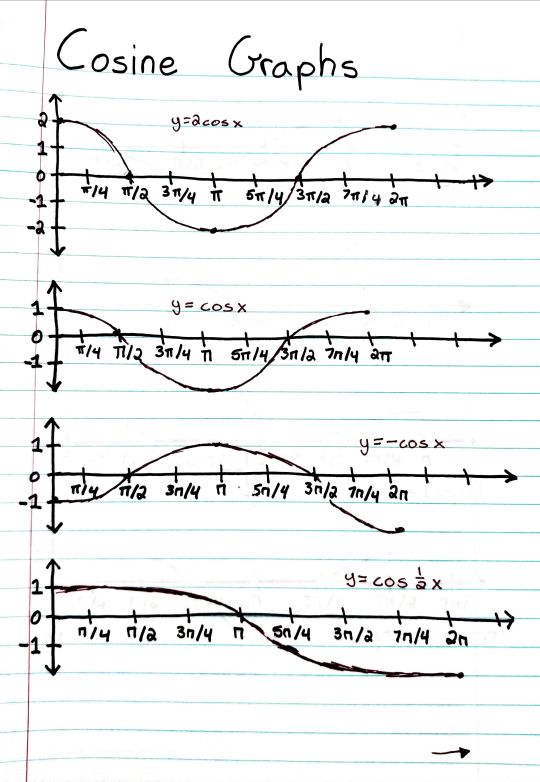
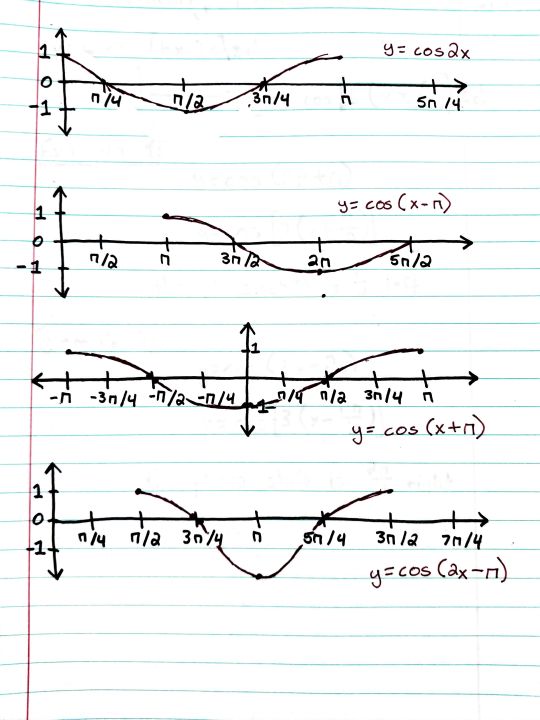
#math graphs
Explore tagged Tumblr posts
Visit Tumblr Blog
Explore Tumblr blogs with no restrictions, modern design and the best experience.
Last Seen Tumblr Blogs


Fun Fact
The most popular pages on Tumblr are about Minecraft, GIFs, and David J. Peterson.
Text
Patreon
#studyblr#notes#math#maths#mathblr#math notes#cosine#cosine graphs#trig graphs#trigonometry graphs#trig cosine graphs#cos graphs#math graphs#graphs in math#cos in trig#cosine in trig#trigonometry cosine#trigonometry cos#main trig graphs#main trigonometry graphs#graphs in trigonometry#graphs in trig
24 notes
·
View notes
Text

when the 𝑓(𝑥) = 𝑎𝑥³ + 𝑏𝑥² + 𝑐𝑥 + 𝑑 😋
#bloodborne#micolash host of the nightmare#decadentart#Hello Again Ugly. Ew#actual title of piece is ‘function’#nothing rlly special just kinda playing around . this wasnt the original idea. was originally gonna have a bit more . Moths#saving that for latterrr :)#For those curious#it tooks mw like. 20 mins to get a good looking graph on demos. i hate math. UAGH#working on more art of this guy btw. he really makes me sick#this is kind of a quick scribble tbhh cuz . uah. inspiration struck hard randomly
4K notes
·
View notes
Text
It annoys me unreasonably when a fancy map of political boundaries uses like a dozen colours and still ends up with two polities that share a border having the same colour. Like, "solving the four-colour problem" is an exercise we give to first graders, and you couldn't do it with twelve? Get out of my sight.
1K notes
·
View notes
Text
Math tells us the saddest love stories
"Parallel lines were never meant to meet"

"Tangent lines only meet once and grow apart forever"
"Asymptotes get closer and closer but will never be together "
#desiblr#indian aesthetic#desi#desi academia#desi tumblr#desi girl#love#desi tag#desi teen#tw depressing thoughts#mathblr#mathematics#calculus#graph#sad life#heartbreak#sad love story#math
2K notes
·
View notes
Text
me showing smart math friend the post i made about Deltarune, Raise up your Bat and how changing the K in Ark to a C ruined my morning:
her: oh? what?

her: waves as in sine waves?
me: WHAT
me: NO
me: *clutching head and breathing hard*
me:

also while we're at it...
youtube
youtube
*screaming*
*update*
oh cool i made a more coherent breakdown of all this
#deltarune#deltarune theory#i hate math#i hate graphs#i hate my stupid brain#why can't i use this power for anything profitable
172 notes
·
View notes
Text

Graph of @potato-lord-but-not art so far in 2025.
So far they have posted 161 drawings and 83 of them have been art of gay stuff.
Comic count as one drawing unless different panels fall into different categories, reposts and Reblog are not counted. And the Jarthur buttfuck image was only counted twice
I was gonna also do 2024, 2023, 2022 and 2021 but this was a lot of work for a joke. So maybe I’ll update the graph end of the year
224 notes
·
View notes
Text
I like to imagine that at the time of his merging with the Distortion he was Michael Shelley, Ph.D
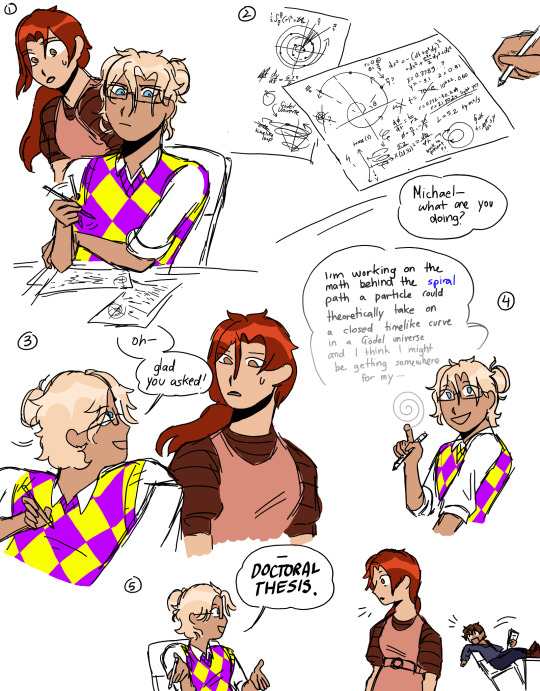
#Someone please ask me what the hell Michael is talking about#And please appreciate that math I pulled every spiralish equations I'm ever known#Even the polar graphs made an appearance#michael tma#tma au#michael the distortion#michael crew#michael distortion#agnes montague#tma agnes#magnus archives#the magnus pod#the magnus archive fanart#the magnus archives#magpod#archivist!gerry
150 notes
·
View notes
Text
Doing the maths: Grian's failure at getting a mending book
lots of talk about maths and probabilities below the cut! but there's a graph and simple explanation at the end if you want to get the gist of it and are bad at maths.
(I am still young and learning maths, critique/advice always welcomed)
What are the odds of getting a mending book in Minecraft?
(I am assuming Grian has been doing all his fishing with Luck of the Sea 3)
The probability of a mending book is actually a bit annoying to estimate. The Minecraft Wiki lists fishing up an enchanted book as 1.9% chance. This is for ANY enchanted book. The Minecraft wiki talks about how the chance of an enchantment being selected is calculated. Mending has a weight of 2. Using the table, mending has a probability of 2/135.
However, Grian is looking for any book with mending, not just a pure mending book. Additional enchantments are calculated in a different way, involving RNG, which means it won't be as easy to model. Due to this reason, I'll just be using the odds for a pure mending book throughout.
TLDR: a mending book has a 0.028..% chance (2/135*0.019*100)
Grian's Data
According to this screenshot, Grian has used a fishing rod 5679 times. This number may not be fully accurate, as it includes the times he's fished other players, rather than just fished for items, but it is a good estimate.
To help visualise this data, with a median waiting time between catches of 17.5 seconds, Grian has spent over 20 hours fishing so far! He may have a problem.
Is this statistically significant?
Hypothesis testing (p-value approach):
H0: p = 19/67500 (the null hypothesis - he has no mending books because of chance)
H1: p < 19/67500 (the alternate hypothesis - he has no mending books due to different odds)
5679 trials, 0 mending books
X ~ B(5679, 19/67500) (binomial distribution, 5679 tries with a probability of a mending book being 19/67500, where X is the number of mending books)
p(X=0) (what is the probability the number of mending books being 0)
p = 0.2021473392
Now, the point at which data becomes significant is subjective. For instance, you *could* get a million heads in a row flipping a coin, it's not impossible, but at a certain point, you can begin to say "okay there's something not normal about this". For this approach, the closer the p-value is to 0, the more evidence there is against the null hypothesis . The p-value here is far above a significance level of 0.01, or 0.05, or 0.1. There isn't a clear line between significant/non-significant, but this is answer is quite a bit far from 0
With this, I cannot reject the null hypothesis.
Personal conclusion: this is not statistically significant, Grian is just unlucky.
Are other values statistically significant?
Gem's proposed 9000: results in a p-value of 0.079... more significant than Grian's number but I don't imagine Mojang would be too concerned. As said though, it's all subjective.
I am bad at maths, what does all this mean?
Here is a graph, showing what number of mending books you might have after 5679 tries. The height of the bar represents the probability of getting that amount. The numbers at the top are the (rounded) numbers I used in my calculation
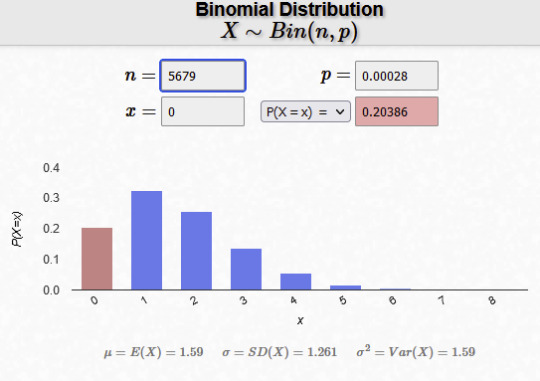
The pink column is 0 mending books - like what Grian has! As you can see, it is less likely than getting 1 or 2 books, but not too uncommon to happen.
End conclusion: Grian has bad luck. Like, not as hilariously bad as he thinks, but still bad. If he keeps going, chances are he will get a mending book, but I think he should probably stop fishing because at this point he has a problem.
#if you saw my last post no you didnt#<- misread “5679 fishing rods used” as having fully used up 5679 fishing rods#this is so much better written than my last post though. and i think the graph helps a lot#long post#locus fandom time#locus maths time#grian#hermitcraft#hermitblr#hermitcraft 10#“why the p value approach” i missed the lesson for it so this is my catch up work unironically
884 notes
·
View notes
Text
Me after I first went from a community where 'trans men are girl brained which is why they are inferior to us real trans people, so be a good crossdresser and do most of the chores. Its not our fault we were never taught how, while you were forced into doing it since you could walk'
To the very progressive:
'Trans men are the meniest most privileged meniest men of all malekind and misogyny is a swear word to them, true men of trans manness don't acknowledge misogyny at all and if you do you're a transtrend- i mean faker- I mean misogynist- I MEAN HEFAB USING HIS ASAB TO GET SYMPATHY. NO THERE IS NO GRACE for not understanding all the correct terminology you tme facist! YOU SHOULD KNOW BETTER. EDUCATE YOURSELF USING THESE ENGLISH BOOKS YOU CAN'T REALLY READ'
#transandrophobia#trans discourse#my experience coming to tumblr for the first time was like going from#2+2 is 4! Woo!#to advanced trigonometric calculus graphs without the right calculator#with 40+ 'years of experience' maths teachers standing over me with a cane screaming at me the whole way through
252 notes
·
View notes
Text
game theory pisses me off. Every unsolved game theory problem is like “is there a solution for any possible starting state of Pink Three-player Jingletworp for N=3” and jingletworp will be like “can you draw lines between dots in a certain configuration”
52 notes
·
View notes
Text

Splinter week day 3: Tradition! This time featuring Rise Splinter!!!
I’m not gonna lie guys, he’s my favorite splinter. I just find how he was running from his family legacy/the responsibilities that came with it so freaking fascinating. I know it’s abit of a controversial take, but I really do love what they did with his character, expecially as the backstory got revealed. Someday when I’m less worn out I’ll make a proper gush post lol
If you want to participate in splinter week please check out @tmnt-splinterweek for the prompts and instructions for break day and such!!!
#tmnt splinter week 2025#cringe fail rat daddy#my beloved#I’ve been rewatching the show and my love for him has resparked#I will go more in detail someday#that day is not today#its the last prep day before we do backfill on the site I’m working at#so. lotta math graphs and manual labor in the sun all day#no more brain cells#rottmnt#hamburgrr draws
37 notes
·
View notes
Text
i love how much all the nerds on here like making graphs and diagrams
#venn diagrams and x y axis things my beloved#that one person who made a graph on the exponential increase of f words in murderbot books#all incredible work#cant believe i ever thought math class wouldnt be helpful later in life.
36 notes
·
View notes
Text
I have been mostly basing my oh this guy probably has simps for them, based on like y'know muscular fluffy hair boys (tiktok has changed my prespective on attractiveness forever). But since I've entered tumblr, I'm more accustomed to tumblr sexy men. I'm sure I can get where your coming from for that really old man, or shape. But now Everything has changed, because I was today years old when I found out Dr. GYRO GEARLOOSE has simips... WHAT? I can process anything but that guy, I just don't see it, what. I understand if you simp for bill cipher, sans? Sure, sonic, luigi, mega mind, waluigi, or literrally anyone else, I'm okay with that but GYRO?
This is the guy btw

My reaction to this information:

#found this out from those pinterest graphs btw#I was like WHAT#wdym people simp for this man#gyro gearloose#doctor gyro gearloose#dr gyro gearloose#ducktales#ducktales 2017#also mini rant but I hate it when people make those graphs with like x and y axis but they expect us to read it from y to x#like did you fail maths?#YOU'RE SUPPOSED TO READ IT X AND THEN Y#sorry#anyways#tumblr sexyman#tumblr sexymen#I'm finally finishing this show#woohoo#rambles#my post
24 notes
·
View notes
Text

Now imagine if the math daemons had odd quirks that make having them around inconvenient rather than horrifying.
It's not that the Polarkin don't like water, they're just freaked out when it looks like it's coming out of nowhere. Strangely, snow or hail doesn't affect them.
30 notes
·
View notes
Text
Making weekly progress graphs
All it took was one (1) person asking about it and I decided to make a post for how to make my progress graphs. Maybe I've done this before. I don't know. I'm doing it now.
For what I do, I use a spreadsheet. It's google docs right now, but I assume you can use anything because I'm not using anything unique to google docs.
You need at least 2 tabs. I have more than that, but let's start here.
Tab 1: Wordcounts
My first tab is called "WIP Progress". Here's what it looks like:

That's one line per WIP per day, if I work on it.
Month and Week are columns derived from the Date column using formulas.
Want the actual formulas? Month is "=concatenate(year(C2), ", ", month(C2))" and Week is "=concatenate(year(C2),", ", text(weeknum(C2-1), "00"))", at least in row 2.
Date column is the day you worked on it, hand entered.
Fic is a title per WIP. You should keep the title the same for each WIP because this will be used to track progress in graphs.
Detail is a note column, doesn't have to be unique. I use it to figure out working ideas and track parts of things. Like, parts 1 and 2 of the Prophetic D&D game are under the same Fic name with the actual title in the Detail column
Start wc is the number of words on that WIP at the start of the day
End wc is the number of words on that WIP at the end of the day
Total is a math formula that does the difference between Start wc and End wc. Literally just "=G2-F2"
And then every day, I add as many lines as things I'm working on and copy the formulas from a previous row and adjust them. So, for today, it looks like this:

Insert rows, copy, paste, change the dates, copy End wc to Start wc, and I'm ready to go.
How long have I been doing this? ...

A while.
More formula and some graphs behind the cut.
Tab 4: Last Week Progress
Let's skip to tab 4 because that's where my graphs come from. Tab 2 is "Progress by Day" and Tab 3 is "Progress by Week" but we'll come back to those if anyone is interested.

Okay, so the general idea is that it looks back 7 days and does a count of how many words, the average (ignoring 0s), and the counts per work per day. Then it graphs them. So how does this work?
Well, the top row is my constants:
Formula in F2: "=averageif($D3:$N10,"<>0")"
Formula in H2: "=MINIFs($D3:$N10, $D3:$N10, "<>0")"
Formula in J2: "=MAXIFS($D3:$N10, $D3:$N10, "<>0")"
The words "Word Documents" is in L2 because I use it in my unique filter. I used to keep track of my work writing but I didn't want it in this graph, so it's filtered out.
Rows 2 through 10 are my data rows. Here's what they look like:
A3: "=TODAY()", A4: "=A3-1", A5: "=A4-1". Follow that pattern as far back as you want to look.
B3: "=sumif('WIP Progress'!C:C,A3,'WIP Progress'!H:H)". Copy that down the column as far as you put down dates. That's give you your daily wordcount.
C3-C10: "=$F$1". Literally that's it. Just inserting the calculated average so that I can graph it nicey.
Tricky bit! D2 is a complicated formula. It looks like: "=transpose(sort(unique(filter('WIP Progress'!D:D, 'WIP Progress'!C:C>=today()-8,ARRAYFORMULA(if(not(exact('WIP Progress'!D:D, 'WIP Progress'!$D$1))*not(exact('WIP Progress'!D:D, $L$1)), True, false))))))"
EDIT! There's a better way that doesn't use ARRAYFORMULA. It's still a monster, but ARRAYFORMULA only works in google sheets. See my reblog of this post for an update:
... Yeah, that's a monster. What it's doing is taking the rows in my WIP Progress tab and filtering out anything that's not within the last 8 days. If you go back more than a week, change the number in the part that says ">=today()-8" to something higher. Then it also removed anything that matches my header row in WIP Progress, and also anything that matches my filter field ("Work Documents"). And then it takes all the unique values of what it finds, sorts them into alphabetical order, and transposes them so that they go in as column headers. This means the column headers change if I add more things to my daily wordcounts, and they stick around for the week.
Anyway, that's what determines the column headers for columns D through M. I've never written on more than 10 WIP in a week, so I've never needed more than that.
For cell D3, I have this formula: "=sumifs('WIP Progress'!$H$1:$H, 'WIP Progress'!$D$1:$D, D$2, 'WIP Progress'!$C$1:$C, $A3)". That is then copied and pasted into the rectangle of numbers there. Everything that needs to change will change, and everything that doesn't won't.
What's it do? Well, it matches the header of the column (D$2, E$2, F$2...) to the date on the lefthand side ($A3, $A4, $A5...) and then does a sum of the values for wordcount that match that column and that date. So if for some reason I have two entries for a WIP on the same date, it'll add them up.
Why would I have this? Sometimes I move stuff to a different document and start a new line with new start wc and end wc. It happens.
Okay, all the formulas are in! Now I have a bunch of numbers. How do I make a graph? This is easier through screenshots:

Go to Edit chart. Again, this is the googs, so if you're in Excel you'll have to look up how to do it differently.

In Setup, this is a Smooth line chart. The data range has the columns from my table above, with a little extra because I think maybe I started with 2 weeks worth. Whatever, extra is fine.
X-axis is Days, which is the first column. Then the series that get plotted are basically one of each column, except for Words because it threw things off.
Series view:

All the blank ones are on here because they don't show up if they've got no data. Well, technically they do but they're all at the 0 line so it just looks darker.
Also helpful:

Next, Customize the chart:

Mostly boring defaults, but here's the place to set the title.
And that's how the chart gets made. I have more charts than this, though...


So many more charts...
I'm willing to write more about them or help with formulas if anyone wants to know more.
#my writing#data visualization#someday i'll actually read that data viz book#i'm an amateur at this#charts and graphs#math
25 notes
·
View notes
Text
i despise the fact that i can't picture things in 4 dimensions
#this post was brought to you by: me going “huh what would a y=z^2 graph look like if z was complex”#and then realising the answer is four dimensional- 2 real and 2 complex- and as such i cannot visualise it#mathblr#maths#siph speaks#can anybody picture 4d things? if so HOW? tell me your secretsss
22 notes
·
View notes