#multiple median estimation
Explore tagged Tumblr posts
Visit Tumblr Blog
Explore Tumblr blogs with no restrictions, modern design and the best experience.
Last Seen Tumblr Blogs


Fun Fact
12.7% of mobile users access Tumblr.
Text
Okay, but how many WORDS of fic are there? A proposed method for estimating total word count for a set of fics on Ao3
Some statistics are really easy to find on Ao3. Some are harder.
The word count of an individual work? Easy. The word count of a group of works? You have to add it up manually.
Or do you?
(Note: All statistics in this post are from data gathered on the 28th-29th July, 2023, and will be out of date in the specifics. My focus is on trends.)
If we only had an average
If we knew what the AVERAGE (or mean) word count for a group of works was , we could simply multiply by the number of works, and we'd have the total!
But we don't have the average.
We do, however, have the ability to sort a group of fics by word count, do some arithmetic to figure out what the middle item in that list is, and check that individual fic. (E.g. in a list of five fics, what is the word count of the third-longest work?)
This is the median - surely that's going to be close to the average, right?
Unfortunately, no.
Wordcount Georg is an outlier adn is difficult to count
You know that one MASSIVE fic? The one that's, like, half a million words, and a hundred chapters, and it's still going?
You thought of one straight away, didn't you?
Well, it turns out a LOT of fandoms have that fic. Or several of them.
But they're usually very few compared to a much LARGER number of very short works. Take the MCU fandom. When I checked, only 1% of MCU fics were over 100,000 words - and 25% were under 1000 words.
The median is usually close to the average when the distribution of a set of numbers looks like this:
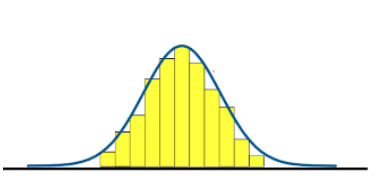
But the distribution of the length of fics in most fandoms looks more like this:
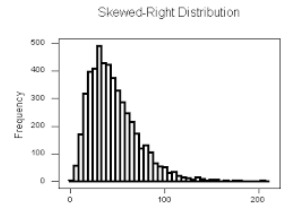
In that sort of distribution, the median and the mean can be a LONG way apart.
A median can still tell you a lot about the most common kinds of fic. But it's going to completely miss all those super-long outliers, and if you want to find the TOTAL word count, you need those.
Counting things the cheating-cheater way
I would like to propose a method I've been calling 'multiple median estimation'.
Here's how it works:
Sort your fics by word count, then divide the list into chunks. Ten percent of the total number is often a good size.
Find the fic in the middle of each chunk to get the median word count for THAT set of fics.
When a chunk has a median SUBSTANTIALLY bigger than the previous chunk, break it up into smaller pieces, and repeat.
Once you have all your medians, multiply each one by the number of fics in that chunk, and add together to get your estimated total.
Let's see how that pans out across a few different fandoms...in part 2!
16 notes
·
View notes
Text
Reference saved in our archive
Published January 2021. The source of the infamous 59% asymptomatic spread statistic.
Key Points Question What proportion of coronavirus disease 2019 (COVID-19) spread is associated with transmission of severe acute respiratory syndrome coronavirus 2 (SARS-CoV-2) from persons with no symptoms?
Findings In this decision analytical model assessing multiple scenarios for the infectious period and the proportion of transmission from individuals who never have COVID-19 symptoms, transmission from asymptomatic individuals was estimated to account for more than half of all transmission.
Meaning The findings of this study suggest that the identification and isolation of persons with symptomatic COVID-19 alone will not control the ongoing spread of SARS-CoV-2.
Abstract Importance Severe acute respiratory syndrome coronavirus 2 (SARS-CoV-2), the etiology of coronavirus disease 2019 (COVID-19), is readily transmitted person to person. Optimal control of COVID-19 depends on directing resources and health messaging to mitigation efforts that are most likely to prevent transmission, but the relative importance of such measures has been disputed.
Objective To assess the proportion of SARS-CoV-2 transmissions in the community that likely occur from persons without symptoms.
Design, Setting, and Participants This decision analytical model assessed the relative amount of transmission from presymptomatic, never symptomatic, and symptomatic individuals across a range of scenarios in which the proportion of transmission from people who never develop symptoms (ie, remain asymptomatic) and the infectious period were varied according to published best estimates. For all estimates, data from a meta-analysis was used to set the incubation period at a median of 5 days. The infectious period duration was maintained at 10 days, and peak infectiousness was varied between 3 and 7 days (−2 and +2 days relative to the median incubation period). The overall proportion of SARS-CoV-2 was varied between 0% and 70% to assess a wide range of possible proportions.
Main Outcomes and Measures Level of transmission of SARS-CoV-2 from presymptomatic, never symptomatic, and symptomatic individuals.
Results The baseline assumptions for the model were that peak infectiousness occurred at the median of symptom onset and that 30% of individuals with infection never develop symptoms and are 75% as infectious as those who do develop symptoms. Combined, these baseline assumptions imply that persons with infection who never develop symptoms may account for approximately 24% of all transmission. In this base case, 59% of all transmission came from asymptomatic transmission, comprising 35% from presymptomatic individuals and 24% from individuals who never develop symptoms. Under a broad range of values for each of these assumptions, at least 50% of new SARS-CoV-2 infections was estimated to have originated from exposure to individuals with infection but without symptoms.
Conclusions and Relevance In this decision analytical model of multiple scenarios of proportions of asymptomatic individuals with COVID-19 and infectious periods, transmission from asymptomatic individuals was estimated to account for more than half of all transmissions. In addition to identification and isolation of persons with symptomatic COVID-19, effective control of spread will require reducing the risk of transmission from people with infection who do not have symptoms. These findings suggest that measures such as wearing masks, hand hygiene, social distancing, and strategic testing of people who are not ill will be foundational to slowing the spread of COVID-19 until safe and effective vaccines are available and widely used.
#mask up#public health#wear a mask#pandemic#covid#wear a respirator#covid 19#still coviding#coronavirus#sars cov 2
62 notes
·
View notes
Text
As some of you may recall, I have participated in a continuing series of "expert" polls/panels on the state of American politics since the early years of the Trump policy. I'll provide a link to the most recent results below, but assuming most of you have no desire to plow into that data, the executive summary follows. It is interesting in its own right...
"Our key findings are the following:
Election expectations
Both parties expect their candidate to win the presidential election (87% for Republicans, 90% for Democrats). In particular, a substantial minority of Republicans (38%) and Democrats (28%) do not even expect the election to be close, creating an opening for claims of fraud or malfeasance if the result differs from their expectations.
Experts believe Trump will try to claim victory before the race is decided (median forecast: 80% likelihood) and encourage violence and intimidation by his supporters (80%). Just 7% of experts and 24% of the public think Trump will concede if he loses the election. By contrast, 75% of experts and 72% of the public think Harris will concede if she loses the election.
Campaigns
Experts rate standard campaign strategies such as promoting voter turnout as more effective than highlighting the threat to democracy posed by the other side for both candidates, including Harris.
Exposure to a message describing the endorsements that Harris received from former Vice President Dick Cheney, former Rep. Liz Cheney, and former Rep. Adam Kinzinger increased support for her among people who intend to vote in the November election by an estimated one percentage point.
Threats to democracy
80% of Republicans endorse the false claim by Trump and his allies that Democrats are trying to win the election by allowing unauthorized immigrants into the country and giving them the right to vote. Public beliefs about the prevalence of voter and election fraud remain wildly exaggerated, especially among Republicans.
Compared to October 2022, Republican acceptance of Biden as the rightful winner in 2020 has increased from 33% to 38% and their confidence in the upcoming national vote count has increased from 49% to 57%.
95% of Democrats, 82% of Republicans, and 77% of partisan independents regard it as important for the losing presidential candidate to publicly concede defeat, but Pew finds that only 59% of Trump supporters think it is important for him to concede if Harris wins.
Experts overwhelmingly rate the Supreme Court’s July ruling establishing broad presidential immunity from criminal prosecution as a threat to American democracy, including 75% who view it as a serious or extraordinary threat.
After the collapse of Biden’s candidacy, the popularity of an age limit for presidential candidates among the public increased from 61% in September 2023 to 78% today. The increase was driven by Democrats and independents, whose support jumped from 60% and 66% last year to 89% and 81%, respectively. However, 57% of experts oppose the proposal.
Assassination attempts
More than a third of Democrats endorsed the claim that the July and September assassination attempts against Trump were staged. Conversely, four in 10 Republicans say that the assassination attempts were not staged but that multiple people were involved in each.
69% of Republicans endorse the claim that Democrats encouraged or incited the assassination attempts against Trump compared to 38% of independents and 9% of Democrats."
71 notes
·
View notes
Text
A new report from Popular Democracy and the Institute for Policy Studies reveals how billionaire investors have become a major driver of the nationwide housing crisis. They summarize in their own words:
Billionaire-backed private equity firms worm their way into different segments of the housing market to extract ever-increasing rents and value from multi-family rental, single-family homes, and mobile home park communities.— Global billionaires purchase billions in U.S. real estate to diversify their asset holdings, driving the creation of luxury housing that functions as “safety deposit boxes in the sky.” Estimates of hidden wealth are as high as $36 trillion globally, with billions parked in U.S. land and housing markets. — Wealthy investors are acquiring property and holding units vacant, so that in many communities the number of vacant units greatly exceeds the number of unhoused people. Nationwide there are 16 million vacant homes: that is, 28 vacant homes for every unhoused person. — Billionaire investors are buying up a large segment of the short-term rental market, preventing local residents from living in these homes, in order to cash in on tourism. These are not small owners with one unit, but corporate owners with multiple properties. — Billionaire investors and corporate landlords are targeting communities of color and low-income residents, in particular, with rent increases, high rates of eviction, and unhealthy living conditions. What’s more, billionaire-owned private equity firms are investing in subsidized housing, enjoying tax breaks and public benefits, while raising rents and evicting low-income tenants from housing they are only required to keep affordable, temporarily.
. . .
Thirty-two percent is the magic threshold, according to research funded by the real estate listing company Zillow. When neighborhoods hit rent rates in excess of 32 percent of neighborhood income, homelessness explodes. And we’re seeing it play out right in front of us in cities across America because a handful of Wall Street billionaires are making a killing.
As the Zillow study notes:
“Across the country, the rent burden already exceeds the 32 percent [of median income] threshold in 100 of the 386 markets included in this analysis….”And wherever housing prices become more than three times annual income, homelessness stalks like the grim reaper.
That Zillow-funded study laid it out:
“This research demonstrates that the homeless population climbs faster when rent affordability — the share of income people spend on rent — crosses certain thresholds. In many areas beyond those thresholds, even modest rent increases can push thousands more Americans into homelessness.”This trend is massive.
. . .
As noted in a Wall Street Journal article titled “Meet Your New Landlord: Wall Street,” in just one suburb (Spring Hill) of Nashville:
“In all of Spring Hill, four firms … own nearly 700 houses … [which] amounts to about 5% of all the houses in town.”
This is the tiniest tip of the iceberg.
“On the first Tuesday of each month,” notes the Journal article about a similar phenomenon in Atlanta, investors “toted duffels stuffed with millions of dollars in cashier’s checks made out in various denominations so they wouldn’t have to interrupt their buying spree with trips to the bank…”
The same thing is happening in cities and suburbs all across America; agents for the billionaire investor goliaths use fine-tuned computer algorithms to sniff out houses they can turn into rental properties, making over-market and unbeatable cash bids often within minutes of a house hitting the market.
. . .
As the Bank of International Settlements summarized in a 2014 retrospective study of the years since the Reagan/Gingrich changes in banking and finance:
“We describe a Pareto frontier along which different levels of risk-taking map into different levels of welfare for the two parties, pitting Main Street against Wall Street. … We also show that financial innovation, asymmetric compensation schemes, concentration in the banking system, and bailout expectations enable or encourage greater risk-taking and allocate greater surplus to Wall Street at the expense of Main Street
.”It’s a fancy way of saying that billionaire-owned big banks and hedge funds have made trillions on housing while you and your community are becoming destitute.
. . .
Turns out it was Blackstone Group, now the world’s largest real estate investor run by a major Trump supporter. At the time they were buying $150 million worth of American houses every week, trying to spend over $10 billion. And that’s just a drop in the overall bucket.
As that new study from Popular Democracy and the Institute for Policy Studies found:
“[Billionaire Stephen Schwarzman’s] Blackstone is the largest corporate landlord in the world, with a vast and diversified real estate portfolio. It owns more than 300,000 residential units across the U.S., has $1 trillion in global assets, and nearly doubled its profits in 2021. “Blackstone owns 149,000 multi-family apartment units; 63,000 single-family homes; 70 mobile home parks with 13,000 lots through their subsidiary Treehouse Communities; and student housing, through American Campus Communities (144,300 beds in 205 properties as of 2022). Blackstone recently acquired 95,000 units of subsidized housing.”
In 2018, corporations and the billionaires that own or run them bought 1 out of every 10 homes sold in America, according to Dezember, noting that:
“Between 2006 and 2016, when the homeownership rate fell to its lowest level in fifty years, the number of renters grew by about a quarter.”
And it’s gotten worse every year since then.
. . .
Warren Buffett, KKR, and The Carlyle Group have all jumped into residential real estate, along with hundreds of smaller investment groups, and the National Home Rental Council has emerged as the industry’s premiere lobbying group, working to block rent control legislation and other efforts to control the industry.
As John Husing, the owner of Economics and Politics Inc., told The Tennessean newspaper:
“What you have are neighborhoods that are essentially unregulated apartment houses. It could be disastrous for the city.”
As Zillow found:
“The areas that are most vulnerable to rising rents, unaffordability, and poverty hold 15 percent of the U.S. population — and 47 percent of people experiencing homelessness.”
. . .
The loss of affordable homes also locks otherwise middle class families out of the traditional way wealth is accumulated — through home ownership: over 61% of all American middle-income family wealth is their home’s equity.
And as families are priced out of ownership and forced to rent, they become more vulnerable to homelessness.
Housing is one of the primary essentials of life. Nobody in America should be without it, and for society to work, housing costs must track incomes in a way that makes housing both available and affordable.
Singapore, Denmark, New Zealand, and parts of Canada have all put limits on billionaire, corporate, and foreign investment in housing, recognizing families’ residences as essential to life rather than purely a commodity. Multiple other countries are having that debate or moving to take similar actions as you read these words.
To address the housing shortage and bring down prices for renters and homeowners alike, the Harris campaign’s plan calls for a historic expansion of the Low-Income Housing Tax Credit (LIHTC) and the first-ever tax incentive for homebuilders who build starter homes sold to first-time homebuyers. Building upon the Biden-Harris administration’s proposed $20 billion innovation fund, the campaign proposes a $40 billion fund that would support local innovations in housing supply solutions, catalyze innovative methods of construction financing, and empower developers and homebuilders to design and build affordable homes.
To cut red tape and bring down housing costs, the plan calls for streamlining permitting processes and reviews, including for transit-oriented development and conversions. The agenda also proposes making certain federal lands eligible to be repurposed for affordable housing development. Collectively, these policy proposals seek to create 3 million homes in the next four years.
The campaign plan cites the Biden-Harris administration’s ongoing actions to support the lowest-income renters, including its actions to expand rental assistance for veterans and other low-income renters, increase housing supply for people experiencing homelessness, enforce fair housing laws, and hold corporate landlords accountable.
Building upon these commitments, the Harris agenda calls upon Congress to pass the “Stop Predatory Investing Act,” which would remove key tax benefits for major investors who acquire large numbers of single-family rental homes (see Memo, 7/17/23), and the “Preventing the Algorithmic Facilitation of Rental Housing Cartels Act,” which would crack down on algorithmic rent-setting software that enables price-fixing among corporate landlords.
To make homeownership attainable, Vice President Harris’s proposal would provide up to $25,000 in downpayment assistance for first-time homebuyers who have paid their rent on time for two years. First-generation homeowners – those whose parents did not own homes – would receive more generous assistance.
Vice President Harris’s economic agenda also includes proposals to lower grocery costs, lower the costs of prescription drugs and relieve medical debt, and cut taxes for workers and families with children. The plan would restore the American Rescue Plan’s expanded Child Tax Credit, which provided up to $3,600 per child for low- and middle-income families for one year before it expired in 2022, and would enact a new $6,000 tax credit for families in the first year after their child is born. These measures to reduce expenses and boost household income would also improve housing security for low-income families, who often face impossible tradeoffs between paying rent and affording food, medical care, and other basic needs.
-----
Sorry for the length, but I thought this was really important.
26 notes
·
View notes
Text
How Trump's billionaires are hijacking affordable housing
Thom Hartmann
October 24, 2024 8:52AM ET

Republican presidential nominee and former U.S. President Donald Trump attends the 79th annual Alfred E. Smith Memorial Foundation Dinner in New York City, U.S., October 17, 2024. REUTERS/Brendan McDermid
America’s morbidly rich billionaires are at it again, this time screwing the average family’s ability to have decent, affordable housing in their never-ending quest for more, more, more. Canada, New Zealand, Singapore, and Denmark have had enough and done something about it: we should, too.
There are a few things that are essential to “life, liberty, and the pursuit of happiness” that should never be purely left to the marketplace; these are the most important sectors where government intervention, regulation, and even subsidy are not just appropriate but essential. Housing is at the top of that list.
A few days ago I noted how, since the Reagan Revolution, the cost of housing has exploded in America, relative to working class income.
When my dad bought his home in the 1950s, for example, the median price of a single-family house was around 2.2 times the median American family income. Today the St. Louis Fed says the median house sells for $417,700 while the median American income is $40,480—a ratio of more than 10 to 1 between housing costs and annual income.
ALSO READ: He’s mentally ill:' NY laughs ahead of Trump's Madison Square Garden rally
In other words, housing is about five times more expensive (relative to income) than it was in the 1950s.
And now we’ve surged past a new tipping point, causing the homelessness that’s plagued America’s cities since George W. Bush’s deregulation-driven housing- and stock-market crash in 2008, exacerbated by Trump’s bungling America’s pandemic response.
And the principal cause of both that crash and today’s crisis of homelessness and housing affordability has one, single, primary cause: billionaires treating housing as an investment commodity.
A new report from Popular Democracy and the Institute for Policy Studies reveals how billionaire investors have become a major driver of the nationwide housing crisis. They summarize in their own words:
— Billionaire-backed private equity firms worm their way into different segments of the housing market to extract ever-increasing rents and value from multi-family rental, single-family homes, and mobile home park communities. — Global billionaires purchase billions in U.S. real estate to diversify their asset holdings, driving the creation of luxury housing that functions as “safety deposit boxes in the sky.” Estimates of hidden wealth are as high as $36 trillion globally, with billions parked in U.S. land and housing markets. — Wealthy investors are acquiring property and holding units vacant, so that in many communities the number of vacant units greatly exceeds the number of unhoused people. Nationwide there are 16 million vacant homes: that is, 28 vacant homes for every unhoused person. — Billionaire investors are buying up a large segment of the short-term rental market, preventing local residents from living in these homes, in order to cash in on tourism. These are not small owners with one unit, but corporate owners with multiple properties. — Billionaire investors and corporate landlords are targeting communities of color and low-income residents, in particular, with rent increases, high rates of eviction, and unhealthy living conditions. What’s more, billionaire-owned private equity firms are investing in subsidized housing, enjoying tax breaks and public benefits, while raising rents and evicting low-income tenants from housing they are only required to keep affordable, temporarily. (Emphasis theirs.)
It seems that everywhere you look in America you see the tragedy of the homelessness these billionaires are causing. Rarely, though, do you hear about the role of Wall Street and its billionaires in causing it.
The math, however, is irrefutable.
Thirty-two percent is the magic threshold, according to research funded by the real estate listing company Zillow. When neighborhoods hit rent rates in excess of 32 percent of neighborhood income, homelessness explodes. And we’re seeing it play out right in front of us in cities across America because a handful of Wall Street billionaires are making a killing.
As the Zillow study notes:
“Across the country, the rent burden already exceeds the 32 percent [of median income] threshold in 100 of the 386 markets included in this analysis….”
And wherever housing prices become more than three times annual income, homelessness stalks like the grim reaper. That Zillow-funded study laid it out:
“This research demonstrates that the homeless population climbs faster when rent affordability — the share of income people spend on rent — crosses certain thresholds. In many areas beyond those thresholds, even modest rent increases can push thousands more Americans into homelessness.”
This trend is massive.
As noted in a Wall Street Journal article titled “Meet Your New Landlord: Wall Street,” in just one suburb (Spring Hill) of Nashville:
“In all of Spring Hill, four firms … own nearly 700 houses … [which] amounts to about 5% of all the houses in town.”
This is the tiniest tip of the iceberg.
“On the first Tuesday of each month,” notes the Journal article about a similar phenomenon in Atlanta, investors “toted duffels stuffed with millions of dollars in cashier’s checks made out in various denominations so they wouldn’t have to interrupt their buying spree with trips to the bank…”
The same thing is happening in cities and suburbs all across America; agents for the billionaire investor goliaths use fine-tuned computer algorithms to sniff out houses they can turn into rental properties, making over-market and unbeatable cash bids often within minutes of a house hitting the market.
After stripping neighborhoods of homes young families can afford to buy, billionaires then begin raising rents to extract as much cash as they can from local working class communities.
In the Nashville suburb of Spring Hill, the vice-mayor, Bruce Hull, told the Journal you used to be able to rent “a three bedroom, two bath house for $1,000 a month.” Today, the Journal notes:
“The average rent for 148 single-family homes in Spring Hill owned by the big four [Wall Street billionaire investor] landlords was about $1,773 a month…”
As the Bank of International Settlements summarized in a 2014 retrospective study of the years since the Reagan/Gingrich changes in banking and finance:
“We describe a Pareto frontier along which different levels of risk-taking map into different levels of welfare for the two parties, pitting Main Street against Wall Street. … We also show that financial innovation, asymmetric compensation schemes, concentration in the banking system, and bailout expectations enable or encourage greater risk-taking and allocate greater surplus to Wall Street at the expense of Main Street.”
It’s a fancy way of saying that billionaire-owned big banks and hedge funds have made trillions on housing while you and your community are becoming destitute.
Ryan Dezember, in his book Underwater: How Our American Dream of Homeownership Became a Nightmare, describes the story of a family trying to buy a home in Phoenix. Every time they entered a bid, they were outbid instantly, the price rising over and over, until finally the family’s father threw in the towel.
“Jacobs was bewildered,” writes Dezember. “Who was this aggressive bidder?”
Turns out it was Blackstone Group, now the world’s largest real estate investor run by a major Trump supporter. At the time they were buying $150 million worth of American houses every week, trying to spend over $10 billion. And that’s just a drop in the overall bucket.
As that new study from Popular Democracy and the Institute for Policy Studies found:
“[Billionaire Stephen Schwarzman’s] Blackstone is the largest corporate landlord in the world, with a vast and diversified real estate portfolio. It owns more than 300,000 residential units across the U.S., has $1 trillion in global assets, and nearly doubled its profits in 2021. “Blackstone owns 149,000 multi-family apartment units; 63,000 single-family homes; 70 mobile home parks with 13,000 lots through their subsidiary Treehouse Communities; and student housing, through American Campus Communities (144,300 beds in 205 properties as of 2022). Blackstone recently acquired 95,000 units of subsidized housing.”
In 2018, corporations and the billionaires that own or run them bought 1 out of every 10 homes sold in America, according to Dezember, noting that:
“Between 2006 and 2016, when the homeownership rate fell to its lowest level in fifty years, the number of renters grew by about a quarter.”
And it’s gotten worse every year since then.
This all really took off around a decade ago following the Bush Crash, when Morgan Stanley published a 2011 report titled “The Rentership Society,” arguing that snapping up houses and renting them back to people who otherwise would have wanted to buy them could be the newest and hottest investment opportunity for Wall Street’s billionaires and their funds.
Turns out, Morgan Stanley was right. Warren Buffett, KKR, and The Carlyle Group have all jumped into residential real estate, along with hundreds of smaller investment groups, and the National Home Rental Council has emerged as the industry’s premiere lobbying group, working to block rent control legislation and other efforts to control the industry.
As John Husing, the owner of Economics and Politics Inc., told The Tennessean newspaper:
“What you have are neighborhoods that are essentially unregulated apartment houses. It could be disastrous for the city.”
As Zillow found:
“The areas that are most vulnerable to rising rents, unaffordability, and poverty hold 15 percent of the U.S. population — and 47 percent of people experiencing homelessness.”
The loss of affordable homes also locks otherwise middle class families out of the traditional way wealth is accumulated — through home ownership: over 61% of all American middle-income family wealth is their home’s equity.
And as families are priced out of ownership and forced to rent, they become more vulnerable to homelessness.
Housing is one of the primary essentials of life. Nobody in America should be without it, and for society to work, housing costs must track incomes in a way that makes housing both available and affordable.
Singapore, Denmark, New Zealand, and parts of Canada have all put limits on billionaire, corporate, and foreign investment in housing, recognizing families’ residences as essential to life rather than purely a commodity. Multiple other countries are having that debate or moving to take similar actions as you read these words.
America should, too.
ALSO READ: Not even ‘Fox and Friends’ can hide Trump’s dementia
16 notes
·
View notes
Text
i think a lot of people commenting things like "this wouldve gotten you on ellen back then" "she should be on ellen in 2014" i think are really funny i think its a really funny observation but it also is a curious view on how our perspectives have so rapidly changed in merely the past decade on being exceptional or having a talent or going above and beyond because i think every day now we see a video of someone doing something we would have sat down with our families to watch or showed multiple people or got shown at work or at school and not just one but many of these videos and i think it definitely may be doing something.
i think our medians for ability are fucked because, for example, people see every day either children that are above and beyond beyond or they see statistics about illiteracy rates in school age students and a lot of these people dont have day to day contact with children, so when they do meet them if they don't fit in the first category they Must be in the second and a poison brained baby. whereas many children are a little all over the place especially when it comes to milestones. and it is not just children but grown folks as well.
we see a lot more extremes, i think, than we used to, and with the amount of time spent observing them, we are seeing less of the average people we likely are. you can see this a lot in the way people will wear huge headphones walking down the street or even shopping, in the way people will complain about the general public. and you know what i mean so dont whip out that sensory shit with me, you know what i am talking about. the way people do not seem to realize they are within the average and within the general public.
this is getting very off topic from my original point i do that i ramble but i think... i think our accessibility to the extremities of life is not very good for us. i think our access to absolute personalized comfort on demand is worrying, because we deal so often in extremes that the opposite of this, previously unheard of, absolute personalized comfort whenever we like is mind killing pain and misery, when in fact, it is just the majority of life and will be. not in a "lifes a bitch" way in a "lifes normal, not always perfect, and when it isnt perfect, it isnt torture" way.
i think when we see so many very very talented people very very quickly and very very constantly, everyone else seems so primitive. i think when we spent a lot of time very very comfortable, the time that isnt, seems unimaginable. are some people primitive, is some time torturous? of course! dont be absurd. are peoples limits, are the settings for these things different from you to me? absolutely!
but that is another extreme to go to. to read something someone says, and maybe disagree a little, and decide the entire point may be moot because you may have an exception. well, this is being general, this is an average assertion. if you have an exception, then it is not in the average. that is what an outlier is. and i think outliers are seen at rates we have never seen before, to where we start including them in estimations because we think, maybe we did not realize them before. they are still outliers! you just see exceptional concentration, because that is what your mind wants to look at!
if you see a long line of yellow cars and one cherry red one, of course you want to see cherry red! if you see 20 yellow cars, then 5 cherry red, you may start to think they are close in number, but you know theyre not! i really have strayed but i think honestly... i honestly think maybe it is being on that damn phone.
#emergency broadcast system#if you have anything you want to add or chat about or have input id love to hear it! i love talking
7 notes
·
View notes
Text
In an effort to get Americans to have more children, the Trump administration has proposed ideas such as a $5,000 “baby bonus” or a $1,000 tax-deferred investment account for children born between 2025 and 2029. It’s as if we’re suddenly in a game of Monopoly: Have a baby, pass go and collect cash!
Their concern is that declining birth rates may lead to a smaller workforce amid an aging population, potentially straining economic stability and the social safety net. But having children can be a swift way into debt. According to the Brookings Institution, a financial think tank, the average middle-income family with two children — median income $80,610 ― spends $310,605 on each child by the time they reach 17.
Additionally, having children in the U.S. comes with risks that go well beyond economics. Maternal morbidity is significantly higher in the U.S. than in other developed countries, and since abortion bans came into effect in some states, deaths have risen — in Texas, maternal death shot up 56%, according to the Gender Policy Equity Institute. For white women, the rate doubled from 20 per 100,000 to 39.1; for Black women, who are historically at greater risk, rates jumped from 31.6 to 43.6 per 100,000 live births.
And those are just the implications for mothers; there are risks to babies as well. I made it through birth without too many complications, but my second son nearly didn’t. He was born with VACTERL syndrome, a birth defect which affects multiple body systems. In the U.S., birth defects affect 1 in 33 babies and are the leading cause of infant death, making up 1 in 5 of all infant deaths. Racial disparities persist here, too, Black infants are over twice as likely to die relative to those born to parents of other races according to KFF.
My son has a “rare” disease — fewer than 200,000 people in the U.S. have it. Collectively, however, rare diseases aren’t as “rare” as they may seem. An estimated 25 to 30 million Americans have one, and birth defects like gastroschisis — a condition in which an infant is born with its intestines protruding outside the body — carry higher risk factors for younger women.
Having a child with serious medical issues is like having a bomb explode in the heart of your family. After my son’s birth, I was stuck at a hospital in Greenwich, Connecticut — my doctor refused to release me — as my newborn was sent via ambulance to a hospital in New York City for surgery. Emotionally, this was devastating.
My family was lucky; my son survived. My spouse had insurance coverage through his job. Our boy got the immediate and ongoing medical attention he needed. But out-of-pocket copays for the three surgeries that marked my son’s first 100 days of life came to $10,000 per month.
Instead of staring into our baby’s eyes, we were staring into a dark abyss that foretold possible bankruptcy. As exhausted as I was nursing, pumping, tending to a very sick child and his older brother, I also lay awake at night, terrified at the possibility of losing our health insurance.
We made it through that first year by the skin of our teeth. Others aren’t so fortunate. With high premiums and higher deductibles, health insurance becomes prohibitive to many if not most Americans. Today, 41% of adults in the US have health care debt, according to KFF.
Those without health care coverage, and possibly even those with it, are only one accident or unfortunate circumstance away from bankruptcy. The inequities in health care grow the gap between wealthy and poor.
According to the Center for American Progress, congressional Republicans’ plans to slash Medicaid funding and allow Affordable Care Act tax credits to expire, ACA health insurance marketplace premiums may increase by thousands of dollars each year. If the GOP dismantles the ACA, those with preexisting conditions — like my son ― could be denied coverage.
The Trump administration suggests that individuals who need help are lazy; that they must earn their keep. But women and families are trying — and it’s clearly not possible. Young families can’t afford children. Yet conservatives insist women have them anyway. The Biden administration was criticized as elitist for forgiving student loan debt, but student loan debt actually delays fertility for women, especially at the higher levels.
Granted, it’s easy for me to suggest not having children — I have two, both nearly grown. But women deserve to know the risks that can alter their lives. As a mother, I felt helpless watching my child endure so much suffering. More recently, I regret bringing my children into a world in which abundant resources are shared as if they were scant. It’s terrifying to know my sons may not have access to the support they need when they need it.
6 notes
·
View notes
Text
How many of you get excited when you see a monarch butterfly? If you do, did you get excited as a kid, or is the excitement a function of their possibly pending extinction? If you do not, can you imagine a world without monarch butterflies?
Excerpt from this story from E&E News/Politico:
Judgment day approaches for the monarch butterfly.
Bound by a court settlement, the Fish and Wildlife Service is supposed to decide by early December whether the monarch warrants listing as threatened or endangered. Although the agency misses many Endangered Species Act deadlines, it appears determined to meet this one after several years of study.
“We wanted to make sure that we have all the best science available … and we wanted to make sure that we were able to gather all that information and make a quality decision,” said Nicole Alt, director of FWS’ Center for Pollinator Conservation.
With the migratory butterfly passing through dozens of states, a decision to list the species could be accompanied by the designation of an expansive critical habitat. Combined with other regulatory implications, this could make the long-delayed monarch listing call one of the most consequential actions in the history of the ESA. It also appears likely, some monarch experts say, given the bleak population trends that led FWS to conclude in 2020 that “monarch viability is declining and is projected to continue declining over the next 60 years.”
Despite the dire circumstances, a campaign to help the monarch butterfly has been advancing on multiple fronts but without a unified commander in chief. Rather, the monarch’s allies march under different flags that reflect a dispersed approach toward species conservation. Some study the insect, some set aside habitat and some tinker with new tools, all without reference to a species recovery plan that an ESA listing would mandate.
Consider:
From an urban office building, a program administered by the University of Illinois, Chicago’s Energy Resources Center has recruited energy companies, state departments of transportation and counties into conserving hundreds of thousands of acres as butterfly habitat on rights of way, such as the medians between roads.
On sprawling Fort Cavazos — formerly Fort Hood — in Texas, biologists prowl the grounds in search of adult monarchs as well as eggs and larva. Since 2017, they estimate they have collected information from more than 10,000 tagged adult monarchs and forwarded this data to another team of collaborators with the Monarch Watch program based at the University of Kansas.
From her Denver office, Alt oversees four geographically scattered FWS staffers and collaborates with others in and out of government. With yet another allied group called Monarch Joint Venture, for instance, the Center for Pollinator Conservation is supporting studies of drones and artificial intelligence in measuring milkweed distribution on wildlife refuges.
And, scattered as they are, the various monarch teams, researchers and advocates periodically gather for a meeting of the minds, as they did in the summer of 2022 for a first-of-its-kind Capitol Hill butterfly summit where Interior Secretary Deb Haaland announced establishment of Alt’s pollinator center.
“It’s really been exciting to see the level of interest from lots of different sectors,” Alt said, adding that “different people want to work in different ways and in different spaces … and in the vast majority of situations they are all advocating for the same thing.”
Some conservation groups, however, want to see a more urgent focus on the problem, saying Congress needs to dramatically increase funding to help the monarchs truly recover. In letters sent last week to House and Senate appropriators, the Center for Biological Diversity and other environmental groups called on lawmakers to provide $100 million annually to restore 1 million acres of pollinator habitat in this country each year and another $30 million to preserve forests in Mexico where some of the butterflies spend their winters.
The groups noted how people over generations have heralded the black-and-orange butterfly’s “spectacular beauty and epic, life-affirming migrations.”
“Dedicating $100 million a year to monarch conservation gives these beloved butterflies a fighting chance at survival,” one letter said.
13 notes
·
View notes
Text
Trump's economic proposals make "voodoo economics" look totally legit.
And if you disagree with Trump, you're obviously a communist.
All U.S. economists are communists now, says the GOP. Who knew?
Apparently, nearly every economist in America is a communist now. At least so says the Republican National Committee. Anna Kelly, an RNC spokeswoman, recently declared: “The notion that tariffs are a tax on U.S. consumers is a lie pushed by outsourcers and the Chinese Communist Party.”
Never mind that Trump called Xi Jinping the "greatest Chinese leader in 300 years".
Kelly was responding to warnings from legions of economists that Donald Trump’s proposed tariffs would be paid by regular Americans. Their conclusion is based in part on the former president’s previous rounds of trade wars; multiple careful studiesfound that the costs of those tariffs were either mostly or entirely passed on to Americans in the form of higher prices. A more recent analysis estimated that his new tariff proposals would cost the median U.S. household an additional $1,700 per year.
Trump has some nitwits thinking that he will singlehandedly reduce the price of steak to 29¢ a pound. In fact, Trump policies would be a burden on consumers – except filthy rich ones.
But the modern GOP being what it is, party apparatchiks must defend every bone-headed idea their presumptive presidential nominee utters. Thus, critics must be “outsourcers” (which seems unlikely for most economists, who rarely own manufacturing plants) or, naturally, Marxists. The expected costs of Trump’s recent tariff proposals would be staggering. For example, his plan for a universal 10 percent tariff coupled with a 60 percent tariff on Chinese goods would more than wipe out any savings most Americans would get from extending his 2017 income tax cuts, according to estimates from the Peterson Institute for International Economics. The bottom 80 percent of households would see a tax increase on net.
We have a chance to ditch Trump's tax breaks for the filthy rich if Trump isn't elected. Of course Trump would brefer to keep those tax breaks - that's why a majority of billionaires support him.
As a main source of revenue, tariffs are so pre-industrial. The Republican Smoot-Hawley Tariff Act of 1930 made the Great Depression worse than it had to be.
Using high tariffs to replace taxes on the rich is regressive.

The math required for this to work would be nearly impossible. Right now, federal income taxes raise about $3 trillion per year. That means repealing them would leave a $3 trillion revenue hole to fill. But the entire value of all the goods we import each year is itself about $3 trillion. Not the tariffs, mind you, but the goods themselves. Trump could try to levy tariffs of 100 percent on every import, but remember that imports would decline as taxes on them rose. So even a global 100 percent tariff wouldn’t raise enough money. It would, however, cripple the U.S. economy, worsen inflation, make the tax system much more regressive and invite retaliation from our allies.
Trump is an idiot who declared bankruptcy six times. He is not an ingenious businessman but merely portrayed one on TV – with lots of help from editing of scenes.
#donald trump#economics#tariffs#tax breaks for the filthy rich#anna kelly#republicans#why billionaires support trump#voodoo economics#election 2024#vote blue no matter who
5 notes
·
View notes
Text
Reference saved in our archive
An excellent breakdown of the efficacy of covid vaccines in children with some haunting statistics included:
Finally, only 7.4% of children ages 5 to 17 years in our study had received an XBB vaccine by the end of April 2024, which is similar to California Department of Public Health estimates of 6% to 7% for this same age group and time period.
Even if we could actually vax our way out of the covid pandemic, there's nowhere near enough uptake to pretend like we can. Mask up. Clean the air. Take all the steps and precautions you can to help keep yourself and everyone around you safe and healthy.
Introduction Vaccine effectiveness of XBB messenger RNA COVID-19 vaccines against mild to severe outcomes has been shown for adults in multiple global settings.1-3 However, data describing the effectiveness of updated COVID-19 vaccines in children are scarce. We evaluated the BNT162b2 XBB vaccine (Pfizer-BioNTech) effectiveness in children ages 5 to 17 years during the 2023-2024 respiratory virus season in a large integrated US health system.
Methods Similar to prior studies,3 we conducted a test-negative case-control analysis to evaluate BNT162b2 XBB vaccine effectiveness against acute respiratory infection (ARI)-associated (eTable in Supplement 1) hospital admission and emergency department (ED) or urgent care visits among children ages 5 to 11 (using a 10-μg formulation) and 12 to 17 (30-μg formulation) years from October 10, 2023, through April 30, 2024, at Kaiser Permanente Southern California (KPSC). This study followed the Strengthening the Reporting of Observational Studies in Epidemiology (STROBE) reporting guidelines. This study was approved by the KPSC institutional review board with a waiver of informed consent because it involved a minimal risk to study participants.
Cases had a positive SARS-CoV-2 polymerase chain reaction (PCR) or antigen test during a hospital admission or ED or urgent care visit, and controls tested negative and had no evidence of a positive SARS-CoV-2 test in the prior 90 days. In sensitivity analyses, we evaluated the impact of (1) restricting results to PCR testing only, and (2) excluding test-negative controls identified by antigen testing alone. Odds ratios (ORs) and 95% CIs comparing the odds of vaccination with 1 or more doses of BNT162b2 XBB with the odds of not being vaccinated with any XBB vaccine were calculated from multivariable logistic regression models (eMethods in Supplement 1). Vaccine effectiveness was calculated as 1 − OR multiplied by 100%. Significance was determined with 95% CIs.
Results Of 15 233 ARI encounters among children ages 5 to 17 years meeting eligibility criteria (7342 female [48.2%]; 1450 Asian or Pacific Islander [9.5%], 1358 Black [8.9%], 8752 Hispanic [57.5%], 2678 White [17.6%]), 9834 were among 5-to-11-year–olds (334 hospital admissions [3.4%], 4377 ED visits [44.5%], and 5123 urgent care visits [52.1%]) and 5399 were among 12-to-17-year–olds (125 hospital admissions [2.3%], 1953 ED visits [36.2%], and 3321 urgent care visits [61.5%]) (eFigure in Supplement 1). Overall, 336 of 9834 5-to-11-year–olds (3.4%) and 388 of 5399 12-to-17-year–olds (7.2%) tested SARS-CoV-2 positive (Table 1). In the full cohort, 1125 children (7.4%) received an XBB vaccine by the end of April 2024; 339 of 9834 5-to-11-year–olds (3.4%) and 264 of 5399 12-to-17-year–olds (4.9%) received BNT162b2 XBB vaccine with median time since vaccination of 75 days (range, 15-199 days) and 64.5 days (range, 16-197 days), respectively. Among those ages 5 to 11 and 12 to 17 years, estimated adjusted BNT162b2 XBB vaccine effectiveness was 68% (95% CI, 11%-88%) and 63% (95% CI, 20%-83%) against COVID-19–associated hospital admission or ED or urgent care visits, respectively, with an overall estimated vaccine effectiveness for all 5-to-17-year–olds of 65% (95% CI, 36%-81%) (Table 2). No COVID-19–associated hospitalizations occurred among those who received BNT162b2 XBB vaccine. Estimated vaccine effectiveness was generally similar for all age groups if results were restricted only to PCR test results or if antigen results were used only to identify cases (Table 2).
Discussion Our results suggest that the BNT162b2 XBB vaccine provided protection against COVID-19–associated hospitalization and ED or urgent care visits among children 5 to 17 years of age during the 2023-2024 season with estimated vaccine effectiveness point estimates ranging from 63% to 73%. The US rate of COVID-19–associated hospitalization was roughly 10.5 per 100 000 among 5-to-17-year–olds from October 2023 through April 2024.4 Assuming 65% vaccine effectiveness, vaccinating the roughly 54.3 million 5-to-17-year–olds in the US5 could have averted approximately 3700 hospitalizations and, using the approximately 30:1 ratio of hospitalizations to ED or urgent care visits we observed in our study, roughly 111 000 ED or urgent care visits during the 2023-2024 respiratory virus season. Our observational design has previously described limitations,3 including potential unmeasured confounding, potential misclassification of prior infection or whether ARI encounters were truly COVID-19–related, and lack of generalizability to other populations. Finally, only 7.4% of children ages 5 to 17 years in our study had received an XBB vaccine by the end of April 2024, which is similar to California Department of Public Health estimates of 6% to 7% for this same age group and time period.6 More efforts are needed to improve pediatric COVID-19 vaccine uptake.
#mask up#public health#wear a mask#wear a respirator#pandemic#covid#still coviding#covid 19#coronavirus#sars cov 2
53 notes
·
View notes
Text
Virginia Housing Shortage Persists Despite Building Boom

Housing Crisis Threatens Virginia's Economic StabilityWhile Virginia's economy demonstrates resilience, the state faces a devastating housing crisis. This threatens its long-term stability and growth prospects.The Commonwealth has an estimated housing shortage of about 105,000 homes. This creates a supply-demand imbalance reaching crisis levels across multiple income brackets.The affordable housing shortage especially impacts Virginia's most vulnerable populations. Only 33 rental homes remain affordable for every 100 extremely low-income households.Universal rental assistance has become essential to address the deepening crisis statewide.Virginia's housing market demands an annual income of $62,925 for basic accessibility. This threshold remains unattainable for significant portions of the population.This income requirement intensifies housing insecurity and directly contributes to rising homelessness rates.The state needs an additional 164,000 affordable homes specifically for extremely low-income households. This is crucial to bridge the current affordability gap.Northern Virginia showcases extreme pricing pressures with median home prices at $664,000. This is a 5.2% year-over-year increase.Despite a 63.6% surge in active listings, the fundamental affordability crisis persists.The year-to-date median home price across Virginia is $343,600. This reflects sustained upward pressure on housing costs statewide.Rental markets are in severe distress, with many tenants spending over 30% of their income on housing. This rent burden leads to wider financial instability and economic vulnerability.Extremely low-income renters have the most acute shortages, facing severely limited options.Regional variations compound the crisis, causing disparate market dynamics and pricing pressures. Strong job markets, especially in Northern Virginia, drive high housing demand that outpaces new construction.These employment centers create pressure on surrounding communities as workers seek affordable alternatives.Financial constraints limit developers' ability to construct affordable housing units. This structural impediment requires innovative financing and policy interventions.Congressional action is essential for building and preserving affordable rental housing stock. This is necessary to address Virginia's housing shortage.Market activity is robust despite affordability challenges, with moderate price increases expected. Although some regions show growing inventory, the fundamental shortage remains unaddressed.The crisis demands immediate intervention to prevent further deterioration of housing accessibility. Virginia mirrors widespread housing market volatility as experienced across the U.S., underscoring the systemic nature of the problem. Rural areas have not escaped these pressures, with Prince Edward County experiencing price increases of 68% from 2019 to 2024.AssessmentVirginia's housing crisis highlights a major disconnect between construction activity and market demand. Despite an increase in building permits and development projects, the state faces growing challenges due to factors like population growth and affordability constraints.Regulatory barriers further complicate the situation. The shortage poses a risk to regional economic growth and affects workforce retention.Without coordinated policy interventions to address zoning restrictions and development costs, Virginia's housing deficit will persist. This ongoing issue undermines long-term prosperity and hampers the state's ability to attract business investment.
0 notes
Text
Look this is what I've been SAYING!
Your average sockeye(red) salmon weighs 9.3 lbs. About 50% of that weight can be recovered as meat, so about 4.6 lbs of meat per fish.
One activity available to Alaska residents is dipnetting. It's probably the quickest way to bring in a ton of fish. When dipnetting. you can keep 25 reds per year.(no daily limit).
For regular fishing(with a line and rod), you can bring in 6 sockeyes a day.
The Alaska sockeye season lasts about 3 months, during most of which you can pretty reliably catch your limit within a few hours.
Red salmon meat costs about $20 a pound in the lower 48. That's about what Costco charges, at least, and in my experience, it's pretty easy to sell at that rate. You can take your catch to a fish processing place and they'll get it all nicely fileted, packaged and frozen for about $2 a pound. UPS says I can ship a 50 pound box for $60, which is another $1.20 a pound. That's still a $16.80 profit per pound, which is incredibly solid.
Do all that multiplication and you end up with a cool $44,000 a year gross. A fair amount of that will have to go to airfare, fishing tackle, gas to drive your fish around, etc, but it's not a bad salary nonetheless, especially considering you're working mornings for just three months. Add in a generous amount of logistics and sales work(my estimate would be a month, but it could easily be more), and you're still not working for more than half the year! And your job is... fishing? That's supposed to be a hobby that drains your money! Like because it's fun! That's crazy.
So, to recap, Alaska's natural salmon resources are so abundant that you could net(lol) about as much income as the median American makes(31 grand), with the job of sport fishing for about half the year. You could literally have a whole other job during the winter- or not!
and in addition to all that red salmon math, there are king, or chinook salmon. they weigh 30 lbs, about 15 of which are meat. King meat is more expensive too, at about $30 a pound, so 26.80 in profit. You can only bring in a few of them, but each fish is worth literally $400! What! The! Heck!
And on TOP of all this, because of oil, Alaska has money that it just hands out to residents. Like a couple thousand a year, to every single citizen living there.
Straight up, if I weren't pursuing higher education, I would be catching salmon in the summers and working part-time at a ski resort in the winters.
man what tha hell am I going to do with a BACHELORS IN PSYCHOLOGY
23K notes
·
View notes
Text
Here’s an order‑of‑magnitude estimate of Soul Housing’s current “net value” (i.e. enterprise value), based on publicly‑reported bed counts, reimbursement rates, and typical valuation multiples:
Company snapshot & operating stats
Founded: 2016; Type: Privately‑held, Housing & Community Development provider
Employees: ~51–200
Locations: ~60 independent facilities
Licensed beds: >1,000 total boarding‑home beds
Services: Recuperative (medical‑respite) care, short‑term post‑hospital housing, day habilitation
1. Revenue estimate
Reimbursement rate: LA County’s “historical rate” for Recuperative Care is $150–$200 per bed‑day; we’ll use $175/day as a mid‑point
Daily revenue at 100% occupancy:
>1,000 beds × $175/day = $175,000/day
Annual revenue at 100% occupancy:
$175,000 × 365 ≈ $63.9 million/year
Annual revenue at 90% occupancy (more realistic):
$63.9 M × 0.9 ≈ $57.5 million/year
2. Enterprise‑value (EV) multiples
Wellness & Health median EV/Revenue: 1.2× (Q4 2023)
Healthcare‑services technology EV/Revenue: 2×–6× (July 2024)
Because Soul Housing is a pure‑service provider (no heavy tech), a conservative multiple in the 1.0×–1.5× revenue range is appropriate.
Likely range: $60 M – $80 M
Mid‑point estimate: ≈ $70 M
Key assumptions & caveats
Occupancy: we assume 90% annual bed‑occupancy; actual may vary.
Rate: uses county “historical” Medi‑Cal reimbursement; private‑hospital rates can be higher.
Multiple: service‑provider businesses often trade at ~1×–1.5× revenue; bespoke due diligence could shift this.
These figures are estimates—for precise net‑asset or equity‑value figures you’d need Soul Housing’s audited balance sheet (assets – liabilities) or a formal M&A valuation engagement.
#deardearestbrands#playstation7#chanel#tokyopop#bambiprescott#mousequteers#nikechanel#capcom#disneymanga#marvel#soulhousing#standrews#hyland
1 note
·
View note
Text
Beck Anxiety Inventory Test The Beck Anxiety Inventory (BAI) test was created by Dr. Aaron T. Beck and other colleagues, and is a 21-question multiple-choice self-report inventory that is used for measuring the extent and intensity of an individual's anxiety. The items describe anxiety on four different ways: (1) Subjective (e.g., "unable to relax"), (2) neurophysiologic (e.g., "numbness or tingling"), (3) autonomic (e.g., "feeling hot") or (4) panic-related (e.g., "fear of losing control." Individuals respond in a range that varies form "not at all" to feeling "severe anxiety" Anxiety is known to possess various components, but Beck merely introduced two measures, cognitive and somatic. The cognitive scale evaluates impaired thoughts and cognitive processing whereas the somatic scale measures symptoms of physiologic arousal. The BAI is mostly used in circumstances where somatic arousal is highest, such as with panic disorder, since the majority of the questions (15 out of 21) deal with somatic symptoms. For these reasons to, clinicians find the BAI to be less effective for disorders such as social phobia or obsessive-compulsive disorder that have a higher cognitive substructure. The BAI is the third most popular tool used for anxiety disorders and ranks behind the STAI and the Fear Survey Schedule in popularity. It is used on all ages (17-80), particularly on adolescents (Grant (nd)), but has been displaced by another on high school students. Limitations with the BAI include the fact that it only weakly discriminates between depression and anxiety as discovered in at least one study and that the mean and median reliability estimates of the BAI are lower when given to a no psychiatric population (such as college students) than when administered to a psychiatric population (deAyala et al., 2005). 2. Test Description The Beck Anxiety Inventory (BAI) test was created by Dr. Aaron T. Beck and other colleagues, and is a 21-question multiple-choice self-report inventory that is used for measuring the extent and intensity of an individual's anxiety. The BAI questions how the individual has been feeling the last week and arranges its questions so that they reflect common symptoms of anxiety. Questions for instance revolve around whether or not the respondent has been feeling examples of the following: numbness and tingling, sweating not due to heat, and fear of the worst happening. The questions are slanted for a 17 -- 80 age range and each question has a range of four possible responses: not at all; mildly; moderately; severely. Each is accorded a specific point with the last ("severely") being accorded the most points: 3. The maximum score of the BAI is 63 points. It is graded in the following way: minimal level of anxiety = 0-7 points mild anxiety = 8-15 points moderate anxiety = 16- Severe anxiety = 26-63 points (Beck AT, Steer RA (1993). Beck Anxiety Inventory Manual. San Antonio: Harcourt Brace and Company. The clinicians then examine the responses to see whether they parallel to mostly subjective, neurophysiologic, autonomic, or panic-related symptoms. The entire test -- administered by pen and pencil can be completed in as short as five minutes and requires only basic reading skills. Given its simplicity, it can also be administered orally for sight-impaired individuals The BAI was tightened by other factor structures that were included later by Beck and Steer's work on anxious outpatients that included neurophysiological, autonomic symptoms, subjective, and panic components of anxiety. In 1993, added panic subscale scores to their cognitive and somatic structures to further differentiate between the various categories of anxiety. The BAI has since evolved into the BAI-Y, another measure used for youth that consists of twenty self-report items rated on a three point scale that assess a child's fears, worrying, and physiological symptoms associated with anxiety 3. Technical Evaluation Beck eta l (1988) concluded that the BIO showed high internal consistency (at = .92) and test-retest reliability over 1 week, r (81) = .75. The BAI, they claimed, was able to discriminate between the different types of anxiety (panic disorder, generalized anxiety disorder, etc.) and distinguish them from depression. (other researchers (e.g. Hewitt & Norton, 1999) would find a weaker differentiation). Beck et al. also found the BAI to be moderately correlated with the revised Hamilton Anxiety Rating Scale, r (150) = .51, and to be only mildly correlated with the revised Hamilton Depression Rating Scale, r (153) = .25 Ayala et al. (2005) investigated reliability estimates of the BAI scores and showed that more than 57% of the publications either did not mention reliability estimates for BAI scores or presented secondary reliability estimates. Their metaanalysis showed that most of the literature on BAI suspected that gender and diagnostic classification would influence reliability estimates. Other factors too such as the "SD and mean BAI scores for each study, the type of reliability, participants' language, and the sample size used in the study were expected to influence the magnitude of the reliability estimates" (752). On the whole, internal consistency of the BAI was significant with coefficient alpha values being at least .83 and mean alphas being at least .88. (Grant (nd) assessed internal consistency (Cronbach's alpha) to range from .92 to .94 for adults) The test-retest reliability estimates were, however, weaker in effect and showed greater variability with values that ranged from .35 to .83. This may be due to wide range of time intervals that elapsed between implementation of BAIs. The researchers were also dubious regarding whether or not gender is related to the magnitude of the reliability estimates of the BAI scores although at least one study has noted that females seem to indicate greater scores in the BAI than do males (Grant, nd). Another aspect that would help us ascertain reliability of the test would be mention of the respondents' ethnicity. Ayala et al. (2005) found that 42.3% of the studies failed to mention the participants' race/ethnic background. Concurrent validity with the Hamilton Anxiety Rating Scale shows the BAI to have .51. The BAI has also been shown to possess acceptable reliability and convergent and discriminant validity for both adolescents and for inpatients and outpatients (Grant, nd). 4. Practical Evaluation The BAI can be used in various settings. It can be used as baseline measure and diagnostic assessment as well as post-treatment outcome measure and as measure that assesses effectiveness of treatment as it progresses. The BAI is mostly used in circumstances where somatic arousal is highest, such as with panic disorder, since the majority of the questions (15 out of 21) deal with somatic symptoms. For these reasons to, clinicians find the BAI to be less effective for disorders such as social phobia or obsessive-compulsive disorder that have a higher cognitive substructure (Leyfer, OT et al. (2006). Subsequently, it may be useful for screening these disorders in community mental health settings although it should be used cautiously in terms of discriminating between depression and anxiety since, contrary to Beck and colleagues' (1998) assertion regarding its ability to make distinctions, many researchers find it unable to do so. The community agencies may be unable to perform the BAI on every individual that comes into their setting, but it can do so on a selective subsample of clients who indicate these symptoms (Each et al., 2008). It can also be used on primary care patients by means of guidelines, training, and education. When used thusly, many researchers (such as Muntingh et al., 2011) believe that the BAI questionnaires will have a valuable impact on directing treatment and on improving treatment of patients with anxiety disorders. 5. Summary Evaluation and Critique The Beck Anxiety Inventory is a well-accepted self-report measure of anxiety in adults and adolescents for use in both clinical and research settings. It is a 21-item multiple-choice self-report inventory that measures intensity of anxiety in adults and adolescents. Using the somatic and cognitive descriptors, it is said to discriminate anxiety from depression but studies have been conflicted on this point. The scale has mostly been used from ages that range from 17-80 with focus on adolescents. Research on reliability of BAI is unclear due to various factors, but the BAI seems to be psychometrically sound. Internal consistency (Cronbach's alpha) ranges from .92 to .94 for adults and test-retest (one week interval) reliability is .75. It uses as diagnostic tool and baseline measure is widespread due mainly to its easiness of application and its possibility of repeatability. The BAI has evolved into another measure used for youth (14-18) called the BAI-Y. Although popularly used, it is said to have its limitations such as to make weak distinctions between anxiety and depression, to be used mainly on somatic descriptions, and to vary dependent on factors such as age, ethnicity, and socioeconomic factors. Nonetheless, it may serve as valuable tool for assessing and diagnosing anxiety disorders. References Beck, A.T., Epstein, N., Brown, G. And Steer, R.A. (1988). An inventory for measuring clinical anxiety: Psychometric properties. Journal of Consulting and Clinical Psychology, 56, 893-897. DeAyala, R.J., Vondeharr-Carlson, D.J., & Kim D. (2005). Assessing the reliability of the beck anxiety inventory scores. Educational and Psychological Measurement, Vol. 65, 5, 742-756. Eack, S.M. & Singer, J.B. & Greeno, C.G. (2006). Screening for anxiety and depression in community mental health: The Beck anxiety and depression inventories. Community Mental Health Journal. Grant, M. Beck Anxiety Inventory. Retrieved from: http://www.coastalcognitive.com Fidalgo, T.M., daSilveira, E.D., & daSilveira, D.X. (2008). Psychiatric comorbidity related to alcohol use among adolescents. The American Journal of Drug and Alcohol abuse, 34:83-89. Hewitt, P.L. & Norton, G.R. (1993). The Beck anxiety inventory: A psychometric analysis. Psychological Assessment, Vol. 5,(4), 408-412. Leyfer, O.T., Rubert, J.L. & Woodruff-Borden, J. (2005). Examination of the utility of the Beck Anxiety Inventory and its factors as a screener for anxiety disorders. Elsevier Inc. Advance online publication Muntingh, A., van der Feltz-Cornelis, C.M., van Marwijk, H.W.J., Spinhover, P., Penninx, B.W.J.H. And van Balkom, Anton, J.L.M. (2011). Is the Beck anxiety inventory a good tool to assess the severity of anxiety? Advance online publication doi:10.1186/1471- 2296-12-66. Read the full article
0 notes
Text
The Data Scientist's Toolkit: 20 Essential Statistical Approaches - A Deep Dive

Data science is more than just wielding powerful machine learning algorithms. It's fundamentally built on a strong foundation of statistical principles. To truly extract meaningful insights, build robust models, and make impactful decisions, a data scientist must possess a comprehensive understanding of statistical approaches. Let's delve deeper into 20 crucial statistical concepts that form the bedrock of a successful data science career.
1. Descriptive Statistics: Unveiling the Story Within the Data
Descriptive statistics are the first step in any data analysis. They provide a concise summary of your data, allowing you to understand its central tendencies and variability. Key measures include:
Mean: The average value, representing the center of the data.
Median: The middle value, less sensitive to outliers than the mean.
Mode: The most frequent value, useful for categorical data.
Variance: Measures the spread of data around the mean.
Standard Deviation: The square root of variance, providing a more interpretable measure of spread.
2. Probability Distributions: Modeling the World's Randomness
Probability distributions describe the likelihood of different outcomes. Understanding them is crucial for modeling real-world phenomena:
Normal Distribution: The bell-shaped curve, representing many natural phenomena.
Binomial Distribution: Models the probability of successes in a fixed number of trials.
Poisson Distribution: Models the probability of events occurring in a fixed interval of time or space.
Exponential Distribution: Models the time between events in a Poisson process. 1
3. Hypothesis Testing: Drawing Conclusions from Data
Hypothesis testing allows us to make statistically sound inferences about populations based on sample data. Common tests include:
T-tests: Compare the means of two groups.
Chi-square tests: Examine relationships between categorical variables.
ANOVA (Analysis of Variance): Compare the means of multiple groups.
4. Confidence Intervals: Estimating the Unknown
Confidence intervals provide a range within which a population parameter (e.g., the mean) is likely to fall, with a certain level of confidence.
5. Correlation Analysis: Measuring Relationships
Correlation analysis quantifies the strength and direction of the linear relationship between two variables.
6. Regression Analysis: Predicting the Future
Regression analysis builds models to predict a dependent variable based on one or more independent variables:
Linear Regression: Models linear relationships.
Polynomial Regression: Models curved relationships.
Logistic Regression: Models binary outcomes.
7. Analysis of Variance (ANOVA): Comparing Group Differences
ANOVA extends t-tests to compare the means of more than two groups.
8. Time Series Analysis: Unraveling Temporal Patterns
Time series analysis focuses on data collected over time, identifying trends, seasonality, and other patterns:
ARIMA (Autoregressive Integrated Moving Average): Models time series based on past values.
Exponential Smoothing: Forecasts future values based on weighted averages of past values.
9. Bayesian Statistics: Updating Beliefs with Evidence
Bayesian statistics uses Bayes' theorem to update beliefs based on new evidence.
10. Sampling Techniques: Making Inferences from Subsets
Sampling techniques allow us to select representative samples from a population to make inferences about the entire population.
11. Non-Parametric Tests: Dealing with Non-Normal Data
Non-parametric tests are used when data does not meet the assumptions of parametric tests:
Mann-Whitney U test: Compares two independent groups.
Wilcoxon signed-rank test: Compares two related groups.
12. Principal Component Analysis (PCA): Reducing Dimensionality
PCA reduces the dimensionality of data by identifying the principal components that explain the most variance.
13. Cluster Analysis: Finding Hidden Groups
Cluster analysis groups similar data points together based on their characteristics:
K-means clustering: Partitions data into k clusters.
Hierarchical clustering: Builds a hierarchy of clusters.
14. Outlier Detection: Identifying Anomalies
Outlier detection identifies data points that deviate significantly from the rest of the data.
15. Survival Analysis: Modeling Time-to-Event Data
Survival analysis analyzes time-to-event data, such as time until failure or time until recovery.
16. Resampling Techniques: Estimating Model Performance
Resampling techniques, like bootstrapping and cross-validation, estimate the performance of a model.
17. Statistical Power: Detecting Real Effects
Statistical power determines the probability of detecting a statistically significant effect when it exists.
18. A/B Testing: Comparing Two Options
A/B testing compares two versions of a product or feature to determine which performs better.
19. Statistical Modeling: Representing Reality
Statistical modeling involves creating mathematical representations of real-world phenomena.
20. Experimental Design: Planning Effective Studies
Experimental design focuses on planning and conducting experiments to collect data and test hypotheses.
The Indispensable Role of Statistics in Data Science:
These statistical approaches are not mere theoretical concepts; they are the practical tools that empower data scientists to:
Extract meaningful insights from raw data.
Build accurate and reliable predictive models.
Make informed, data-driven decisions that drive business value.
Communicate complex findings clearly and effectively to stakeholders.
Xaltius Academy's Data Science and AI Program: Building a Strong Statistical Foundation:
Xaltius Academy's Data Science and AI program recognizes the paramount importance of a solid statistical foundation. The program provides a comprehensive understanding of these essential statistical approaches, ensuring that you graduate with the practical skills and theoretical knowledge needed to excel in the data science field. The program's hands-on approach will make these difficult concepts easier to understand.
0 notes
Text
Just as an additional context to his nonsense:
I'm assuming this is about the birth rate in the US around 1850, right? In addition to the fact that women were prevented from accessing the human rights the incumbent regime is attempting to strip from them, there's a host of other reasons for the birth rate being so high.
lack of functional contraception (first hormonal contraceptive wasn't invented until 1960, and extant barrier methods were significantly less effective, accessible or safe compared with modern counterparts)
The death rate for children under 5 in 1850 in the US was approximately 399.72 per 1000, with estimates that 60-110 of those were specifically infant deaths. The mortality rate in the US now for children under 5 is about 7 in every 1000. According to the Bureau of Labour Statistics, children on average started working at age 10, with some being employed as young as 3-4 years old.
I also want to know where he got the 300 births per 1000 women statistic from (aside from his own ass I mean) because the only statistics I was able to find specifically detailing the US birth rate from 1800-2020 listed it as 48.8 births per thousand people, meaning an average of around 5-6 births per woman. as of 2020 the birth rate was about 12 per every thousand people.
It's also worth noting that the maternal death rate in 1850 in the US was estimated to be about 50 per 10,000 births based on records, but could have been much higher as women from poorer socioeconomic backgrounds would have had significantly poorer access to adequate care. The maternal mortality rate for the US as of Jan 2024, according to the CDC, is around 18.7 for every 100,000.
Other issues of note - despite poor working conditions, lack of worker's protections and everything else:
$1 in 1850 was the equivalent of $41 dollars of modern currency. A family of 5 in 1850 was estimated to spend about $20.15 per week on food and fuel - about $826.15 in modern currency. An adult labourer at that time would've been earning about $25 a month on average (based on $300 year average income) or about $820 in 2025.
The average spending of a family of 4 in the US now is about $7101 per month (though this will vary state-by-state) with a median income of $4935. To put that into perspective, $7101 in 2025 has the same purchasing power as $173.20 did in 1850, and $4935 has the same purchasing power as $120.37.
$20.15x4.325 (avg weeks in a month) = £87.15, which is worth about $3573.14 in 2025, which is only 50.32% of current living costs.
$300 in 1850 - the estimated average yearly income for a labourer - is worth about $12,299.96 now. Split that by 12 for an estimated monthly income and you get $1019.16 (and a lot of recurring 3s) which is 20.65% of current wages.
In addition to the thing listed above by alarajrogers to improve the birth rate, if that's really what Matt Walsh is worried about (doubt), there needs to be a significant overhaul in wages vs cost of living. My personal recommendation would be Universal Basic Income (UBI) since multiple studies (California, Finland and Kenya being the largest examples) have shown it improves not only health and wellbeing but also improves productivity cause *gasp!* people who aren't spending their entire time worrying about how they're going to pay their rent this month are less stressed and can focus more!
Also people whose basic needs are met(food, water, shelter, affordable access to healthcare etc.) are generally happier, and having disposable income means *even bigger gasp!* that there is more money circulating in the economy.
But apparently nobody can do that because the rich don't want to pay their taxes and apparently seem to have forgotten what happened to the French aristocracy when the peasantry could no longer afford their basic necessities.
Also Idk about you guys in the US but in the UK we were told "the earth is overpopulated and we could soon run out of everything if everyone keeps having kids so have fewer kids" and "Don't have kids at all unless/until you can afford to look after them" to an almost absurd degree when I was a kid and looking at the way things have gone globally just in the last couple of years? They brought this on themselves - you can't tell people "the government doesn't owe you anything don't have kids you can't afford" and then complain when they take your advice.
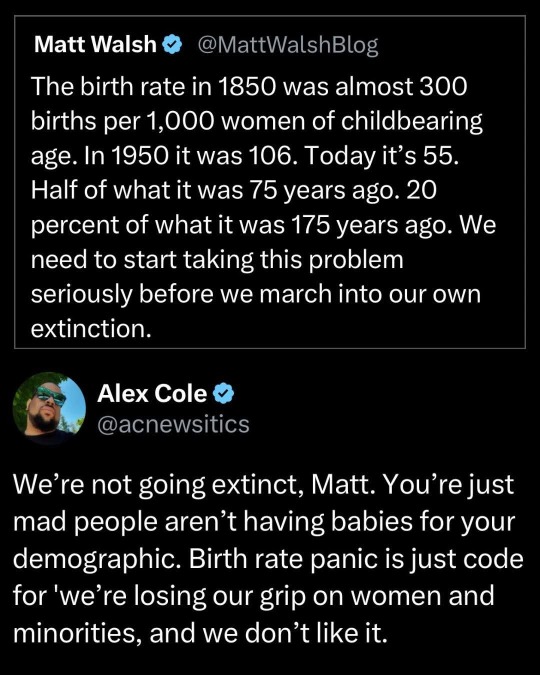
Republican policies and misogynistic rhetoric are killing the white birth rate.
White conservative single men are broken.
White conservative single women can't find a decent partner.
Republican lonerism is coming home to roost.
3K notes
·
View notes