#python course in nepal
Explore tagged Tumblr posts
Visit Tumblr Blog
Explore Tumblr blogs with no restrictions, modern design and the best experience.
Last Seen Tumblr Blogs


Fun Fact
If you dial 1-866-584-6757, you can leave an audio post for your followers.
Text
#python training#python course#python with django#python training in nepal#python coding#python course in nepal#python fee
0 notes
Text
A "Python course" typically refers to an educational program or series of lessons designed to teach individuals how to program using the Python programming language. Datamites provides online training in Nepal
0 notes
Text
Panthera Tigris Tigris Nikos
Jaune: Hey, Pyrrha? Can I have a hug?
Pyrrha: Of course, Jaune! (Hugs)
Jaune: (Sinks into her)
Pyrrha: Would anyone else like-
Nora: (Dragging Ren) MEMEMEME~!
Fun Fact! Bengal tigers are big. Females have been documented to reach 400 pounds, males 500 pounds, and occasionally larger specimens reaching 700 pounds. Royal Bengal Tigers are reportedly even bigger, with one specimen shot by David Hasinger in 1967 was reported to be 857 pounds, measured at 11 feet long, and left paw prints "the size of dinner plates," and it's last meal was a live water buffalo weighed down by an eighty-pound weight. It is displayed in the Smithsonian Institutions's National Museum of Natural History, in the Hall of Mammals.
---------------------------------------------------
Pyrrha: Ready for our run, Jaune?
Jaune: You bet! Maybe this time I could-
Pyrrha: (Ear flicks) Oh, uh, why don't you keep warming up, Jaune? I need to grab something from the dorm.
Jaune: Oh, uh, sure thing, Pyrrha. I'll be right here.
Cardin: (Sitting on the roof) What the hell? Where's Nikos go- (Door swings open, Mauled)
Fun Fact! Bengal Tigers are fast. They can make short sprints of forty miles per hour, which is about the speed of a thoroughbred horse. An incident with a startled tigress mother with her cubs in Nepal in 1974 resulted in the death of a researcher who was hiding 15 feet in a tree. In 2007, on Christmas Day at the San Francisco Zoo, an Amur Tiger cleared a thirty-foot moat to maul three visitors who were harassing the tiger, killing one of them before being killed after four shots to the skull by responding police officer's .40-caliber-pistol rounds. It should be noted that the Amur was a captive tiger, raised from birth in the zoo. Imagine a wild tiger raised in the jungle.
---------------------------------------------------
Pyrrha: Are you okay, Jaune?
Jaune: Y-Yeah, I... Wait, what about the goliath?!
Pyrrha: It's okay, Jaune. I took care of it.
Jaune: But how, Pyrrha? (Holding) Your weapons-!
Pyrrha: (Takes, Smiles) I took care of it.
Jaune: (Looks behind her, Sees dead goliath)
Fun Fact! Bengal Tigers are strong. Their bite force can reach up to a thousand pounds, which is much stronger than a pitbull's and about a quarter of a great white shark. Their prey includes deer, buffalo, bison, bears, rhinos, and elephants. A single blow can break a bear's spine, and easily decapitate a human.
---------------------------------------------------
Jaune: Thanks again for letting us come visit, Mrs. Nikos.
Mama Nikos: Oh, Jaune, don't be so formal. We're practically family, so just call me Mama.
Jaune: Uh... No, I'll just stick with Mrs. Nikos, if you don't mind.
Mama Nikos: Oh, you are just so polite! I'm glad Pyrrha could have such a handsome team leader like you.
Pyrrha: (Blushing) M-Mom...
Nora: Can I have more meat buns, Mama?
Ren: Nora...
Nora: Oh, right! Khm! May I have more meat buns, Mama?
Mama Nikos: They're in the oven.
Jaune: So what do you do for a living, Mrs. Nikos?
Mama Nikos: I'm a personal fitness trainer. It's actually how I met Pyrrha's father. He said he could perform a perfect double twister kick, and I told him it was impossible unless he could twist and launch himself at a 167 degree rotation with a north-northwest gale blowing at 3.5 miles per hour behind him-
Mama Nikos: (Ding!) Oh! Meat buns are done!
Jaune: Huh...
Pyrrha: Don't worry. I didn't get it the first time, either.
Fun Fact! Bengal tigers are smart. Cubs are raised by their mothers for two and a half to three years. There are also notes of tigers imitating deer and bear calls. They will chase larger prey into water, tear at buffalo legs to bring them to the ground, and will flip porcupines from to their backs to avoid spines. There are also records of tigers killing 15-foot crocodiles, 20-foot pythons, 300-pound seals, and a 20-year-old elephant.
---------------------------------------------------
Jaune: Hm? Hey, Pyrrha? Who's this standing with your mom?
Pyrrha: Hm? Oh... That's... That's my mother. She... She's not around anymore.
Jaune: Do... Do you want to talk about it?
Pyrrha: I... I don't know where to begin. She was my hero, but she did something really bad, and she died when I was really young. And I...
Jaune: Hey. You don't have to tell me if you don't want to.
Pyrrha: (Leans on Jaune) I was probably six years old when it happened. She and I were on our way to watch a tournament together, but then this guy came from out of nowhere. He shot at us and broke her jaw. She carried me back home, and then... She left that night. I didn't learn about what happened to her until just after getting accepted into Beacon. She... She went on a rampage and then... Then she...
Jaune: (Holds her) Hey, hey. It's okay, Pyrrha. I'm... I'm sorry to hear that. I'm... I'm sure she was a great mom.
Pyrrha: (Sniffles) She was the best. And, on the bright side, because of her, there's a new standard for huntsman and huntresses to follow. And she's part of the reason why I became a huntress. So I could make sure everyone follows the standard. Follows the example she set. (Smiles) I think she would have liked you.
Jaune: (Looks at family photo) I think I would have like her, too.
Fun Fact! In the first ten years of the 20th century, until her death in 1907, the Champawat Tiger, also known as "the man-eater" killed and ate 436 humans in western Nepal. She evaded capture and continued to kill until she was shot by British hunter Jim Corbett, who speculated the tigress lost her teeth years ago from a gunshot, forcing her to change her prey to much easier humans. He then went on to be an advocate for wild tigers and spent the latter years of his life devoted to their conservation, even having a conservation park in Nepal dedicated to him.
#rwby#pyrrha nikos#tiger!faunus pyrrha#mama nikos#tiger!faunus mama nikos#jaune arc#lie ren#nora valkyrie#history#the champawat tiger
177 notes
·
View notes
Text
What Kaggle, GitHub, and LinkedIn Tell Us About Data Science Talent Worldwide

As worldwide demand for data literacy increases, local interest in cultivating these abilities also rises. Numerous organizations currently provide specialized courses for individuals aiming to pursue a career in analytics, AI, and machine learning. A data science course in Nepal has evolved beyond simple coding instruction, it now includes practical tools such as Python, SQL, Tableau, and machine learning pipelines.
UpSkills Nepal is one of the organizations addressing this need. Their data science program in Nepal combines hands-on learning with mentorship, enabling students to create portfolios that can withstand global evaluation. Similarly, other organizations like Broadway Infosys, TechAxis Nepal, and Neosphere are offering specialized tracks to assist learners in entering the industry.
Portfolios Speak Louder Than Resumes
What makes Kaggle and GitHub especially relevant is that they let learners prove what they can do. Kaggle challenges offer a testing ground for statistical knowledge and machine learning, while GitHub repositories display code quality, documentation, and collaboration skills.
Students enrolled in a data science course in Nepal often use these platforms to gain recognition. For instance, submitting a notebook in a Kaggle competition or contributing to a data project on GitHub can carry more weight than simply listing "Python skills" on a resume.
UpSkills Nepal, TechAxis, and Skill Training Nepal, acknowledging this, motivate learners to sustain public repositories and engage in collaborative projects, practices that correspond closely with global industry standards.
LinkedIn as a Talent Signal
LinkedIn, while distinct from the other two platforms, significantly contributes to enhancing a data scientist’s professional visibility. Recommendations, project displays, and thoughtfully composed posts on current trends in data science can boost a candidate's trustworthiness. A robust LinkedIn profile, combined with practical skills from a data science course in Nepal, can create opportunities both locally and globally.
Institutions like TechAxis Nepal and Broadway Infosys also emphasize personal branding, helping students craft online profiles that complement their technical training. It’s part of a larger push to produce job-ready professionals rather than just certified ones.
Final Thought: Skill Is the New Currency
In a field that evolves as quickly as the data, ongoing education and proactive skill exhibition are crucial. Platforms such as Kaggle, GitHub, and LinkedIn provide more than just networking or competition; they symbolize the direction in which the global data science ecosystem is advancing.
For learners in Nepal, choosing the right data science course is no longer just about curriculum; it’s about real-world application. If you're planning to gain hands-on experience, enrolling in a data science course in Nepal from institutions like UpSkills Nepal, Broadway Infosys, or TechAxis can be a strong foundation. A GitHub repo with clean code or a Kaggle bronze medal might just be the currency that gets you noticed.
0 notes
Text
Why Nepal’s IT Boom is Your Chance to Learn Coding in 2025
Nepal is quietly becoming a tech hotspot. Startups are sprouting in Kathmandu, outsourcing is surging, and remote work opportunities are connecting Nepali talent to the world. This IT boom in 2025 isn’t just a trend—it’s your opportunity to jump into coding and carve out a career. At TechAxis, we’ve seen this shift firsthand, and we’re here to show you why now’s the perfect time to start—and how to do it.
Nepal’s Tech Scene is Heating Up
The numbers don’t lie. Nepal’s IT exports grew by over 20% in recent years, fueled by demand for software and web development. Companies worldwide are tapping into our talent pool, and local startups are raising the bar. Whether you’re in Lalitpur or Pokhara, this growth means jobs—especially for coders.
Why Coding is Your Golden Ticket
Coding isn’t just a skill; it’s a gateway. Learn Python, and you could build apps, analyze data, or dive into AI. Master MERN Stack, and you’re crafting websites for businesses near and far. These skills are in demand right now—our JobAxle platform, which connects learners to employers, is buzzing with openings for fresh talent. The best part? You don’t need a tech degree to start—just the drive to learn.
How to Get Started Today
Ready to ride this wave? Here’s a simple plan:
Explore Free Resources: Start with a Python tutorial on YouTube or a MERN Stack crash course. It’s low-risk and builds confidence.
Pick a Project: Code something small—like a calculator or a personal webpage. It’s okay if it’s rough; the goal is progress.
Practice Daily: Even 30 minutes a day sharpens your edge. Consistency beats talent every time.
Want to accelerate? Structured training makes a difference. At TechAxis, we offer hands-on courses that turn beginners into job-ready coders, tailored to Nepal’s market needs.
Seize the Moment
Nepal’s IT boom won’t wait. Build a portfolio with your projects, apply for entry-level roles, or snag a remote gig—the opportunities are here. Whether you’re a student, a career-switcher, or just curious, 2025 is your year to learn coding and join the tech revolution.
Ready to take the plunge? Discover more tips and expert-led courses at www.techaxis.com.np. Let’s code Nepal’s future together—what’s your first move?
0 notes
Text
IT and Non IT Training in Nepal
If you are ready to build your career in IT and Non-IT training, enroll in any of various training in Nepal!
According to my research, I found best HR training provided by UpSkills Nepal with many different IT and Non It courses!
Most Of top Non IT courses are:
Digital marketing training in Nepal
HR training in Nepal
SEO training in Nepal
Accounting training in Nepal
Graphics design training in Nepal
Diploma in digital marketing in Nepal
Most important IT courses are:
Cybersecurity courses in Nepal
Data science traning in Nepal
AI training in Nepal
DevOps training in Nepal
Python traning in Nepal
UI/UX training in Nepal
#hr training#ui ux design#seo training#graphics design#accounting tips#digital marketing class#digital marketing training#cybersecurity course#python training#ai training#devops#devops training
0 notes
Text
WHY DID NO ONE PROPOSE A NEW SCHEME FOR MICROPAYMENTS
I grew up, so long as I enjoyed it. So don't underestimate this task. Though really it might be interesting to look at your idea in the harsh light of morning and ask: is this something people will pay most for? You often can't tell yourself. If they have time machines in the future they'll probably have a separate reference manual just for Cambridge. We can't do that, why not do it openly? When there's something we can't say: to look at things people do say, and get in trouble for saying that 2 2 is 5, or that people in the future had few fonts and they weren't antialiased. If you believe everything you're supposed to do what the teacher says. The disadvantage of this route is that it's slow and uncertain. One reason we had such a bad idea for startups that one wonders why things were ever done that way. By the second conference, what Web 2.
I'm convinced, is just the way that constraint is imparted to you.1 And what pressure it would put on the city if it worked. During the Bubble a lot of the earlier stage ones would probably take it. So understand that if you invest in startups, they decided to build recipe sites, or aggregators for local events. In the design of most other things, you get better results if you use flexible media. Editors must know they attract readers.2 I'm fairly stubborn, but I got the impression it might be ok to be discontented. And we know from experience that some undergrads are as capable as most grad students.
This is in contrast to Fortran and most succeeding languages, which doesn't pay at all, because people like it so much they do it for free. Tim O'Reilly led a session intended to figure out how we use the word. 0: their core business sounds crushingly hip when described in Web 2. If you want to do, you have to show off with your body instead. Finally you can buy individual songs instead of having to buy whole albums. Not explicitly, of course. Programmers learn by doing, and most of the other differences between startups and what passes for productivity in big companies, software tends to be written by large and frequently changing teams of mediocre programmers. A lot of them try to make them all work in some renovated warehouse you've made into an incubator.3
A rounds already are high res. People do in startups, at least, pick your battles.4 It made them hate working for the acquirer. But ambitious programmers are better off doing their own thing and failing than going to work at another job to make money that you can't do it by accident. What could be more wonderful, they think, than to be a good idea. Programmers, though, requires a conscious effort to keep your ideas about what you enjoy. But the pool of writers is very, very few who simply decide for themselves. At the time it was supposed to mean using the web as a platform was at least not too constricting. Hence what, for lack of a better name, I'll call the Python paradox: if a company chooses to write its software in a comparatively esoteric language, they'll be able to hire better programmers, because the more startups you had in town, the VCs wouldn't be trying so hard to discover what we like to work on, or don't like to get money to work on a Python project than you could to work on a Java project. Anyone who's worked for a time as a doctor in Nepal, for a time as the prize and the time you had a graph in which the x axis represented situations and the y axis the outcome, the graph of the smart person would have high peaks.
Notes
There are some controversial ideas here, since they're an existing university, or editions with the sort of stepping back is one way to predict areas where Apple will be interesting to 10,000 computers attached to the table. Free money to start using whatever you make something hackers use.
That will in many cases be an inverse correlation between the two, I'd appreciate hearing from you. Eighteen months later.
My guess is the same investor to invest but tried to combine the hardware with an online service, and one didn't try because they can't legitimately ask you to two of each type of thinking, but in fact they don't know. If you want to live in a startup. I see a lot of investors. But I don't know which name will stick.
Some introductions to other investors. The next time you raise as you raise money.
#automatically generated text#Markov chains#Paul Graham#Python#Patrick Mooney#peaks#Bubble#differences#productivity#ones#Editors#languages#albums#teams#investor#res#word#service#sites#ideas#job#thing#startups#results#things
0 notes
Text
Data Science With Python
Data Science with Python course in Nepal offers a comprehensive approach to mastering the intricacies of data analytics. Designed to empower participants with essential skills for success in the data science field, this program delves into Python basics, data manipulation with Pandas, visualization using Matplotlib and Seaborn, and machine learning algorithms with Scikit-learn. Through hands-on projects, participants solidify their understanding and gain practical experience.
If you are interested in this course, it is available at Upskills Nepal.

Course Module For Data Science With Python
1. Understanding Python Basics
This course starts with initializing your Python environment and choosing between local installations or cloud-based platforms. You will dive into Python by learning about its syntax and exploring variables, data types, and operators. This also includes understanding other Python basics.
2. Mastering Data Manipulation with Pandas
This part includes installing the Pandas library, exploring its features, and learning to read and write data from various formats, including CSV and Excel files. You can get hands-on with data cleaning and manipulation techniques such as filtering, sorting, and grouping.
Data Visualization with Matplotlib and Seaborn
This module helps you install and explore the Matplotlib library, and create essential plots like line graphs, bar charts, and scatter plots. Enhance your plots with custom labels, colours, and styles for clarity and aesthetics.
Introduction to Machine Learning with Scikit-learn
Data science with Python includes installing and getting familiar with the Scikit-learn library and understanding the basics of supervised learning, including classification and regression, training a basic model using Scikit-learn to grasp the process and learning to evaluate model performance using various metrics.
For more IT and non-IT courses, you can visit this website.
0 notes
Text
#python course in nepal#best it training institute in nepal#best programming courses in nepal#it training centre in nepal
0 notes
Text
DSW2 Setting up a datascience project (Python)
Project: Demographic profiling of community health workers in Nepal.
Introduction
Nepal’s community health workers (CHWs) program started in 1988 (1). In the formative years they were deployed primarily for distribution of birth-spacing commodities, later incorporating maternal, neonatal and child survival programs. Currently, nearly 52,000 CHWs are actively working making it the largest non-specialist health workforce in Nepal (1). CHWs here means the female community health volunteers of Nepal (1).
Previous studies have found that CHWs’ voluntary nature of work is primarily dependent on their perception of work and community environment. They regarded social recognition and being able to help the community are as important as financial rewards (2). Other studies found providing opportunities for promotion and improving payment mechanism are important determinants of CHW’s work satisfaction(3-5). Increasing work load among these health workers with gradual incorporation of tasks related to non-communicable diseases is expected to increase their interest in financial reward whilst hindering work satisfaction (6). Despite having substantially large pool of CHWs, the work satisfaction among these health workforce in Nepal has not been adequately captured in previous studies (7, 8). It is also not clear what factors drive their work satisfaction. Knowing the drivers of work satisfaction will be crucial to inform Nepal’s CHWs program. Therefore, this analyses as part of “Data management and visualization” course in Coursera will examine the socio-demographic characteristics of CHWs, characteristics of their work environment and incentives they receive. Subsequently, we will examine whether these factors can predict work satisfaction independent of each other and the degree of their association. The analyses will be conducted in Python.
The data from this study is made available from John Snow Research Institute (JSI) in Nepal on author’s request. JSI implemented the survey in 2014 with participation of ~4000 CHWs from 13 domains across 75 districts of Nepal. A systematic random sampling technique was used with ward as the smallest geographic unit. A sampling interval was used to select ‘kth’ ward until the required sample for size each of these 13 domains was reached. The full description of study and questionnaire used is found elsewhere (9).
Objectives
1) To describe the socio-demographic characteristics, and geographic presence of community health workers and its association with work satisfaction?
2) To assess whether, i) demographic, ii) work characteristics and iii) receiving incentives interpedently predicts CHW’s work satisfaction, and degree of their association, if any?
Hypothesis
Demographic characteristics of CHWs is as strong factor as work-characteristics and incentives for influencing CHW’s work satisfaction.
I am particularly interested in exploring if aging, education and residence among other demographic factors interpedently predicts work satisfaction, and degree of their association in comparison to work characteristics and incentives they receive.
The codebook including the variables, and specific questions asked in the survey is presented in Table 1 in the link below.
Table 1: Codebook showing the variables used and the specific questions asked in the survey
https://docs.google.com/spreadsheets/d/1RsMlXXropyEFMFTaA9N_XeYiu77InRXPjpmlpMLsuc8/edit?usp=sharing
References
1. Khatri RB, Mishra SR, Khanal VJFiph. Female community health volunteers in community-based health programs of Nepal: future perspective. 2017;5:181.
2. Gopalan SS, Mohanty S, Das AJBo. Assessing community health workers’ performance motivation: a mixed-methods approach on India's Accredited Social Health Activists (ASHA) programme. 2012;2(5):e001557.
3. Kebriaei A, Moteghedi M. Job satisfaction among community health workers in Zahedan District, Islamic Republic of Iran. 2009.
4. Dixit J, Goel S, Sharma VJJofm, care p. A comparative study on the level of satisfaction among regular and contractual health-care workers in a Northern city of India. 2017;6(2):416.
5. Tripathy JP, Goel S, Kumar AMJBhsr. Measuring and understanding motivation among community health workers in rural health facilities in India-a mixed method study. 2016;16(1):366.
6. Mishra SR, Neupane D, Preen D, Kallestrup P, Perry HBJG, health. Mitigation of non-communicable diseases in developing countries with community health workers. 2015;11(1):43.
7. Neupane D, McLachlan CS, Mishra SR, Kallestrup PJGh. Understanding and motivations of female community health volunteers about blood pressure control: a prerequisite for developing community-based hypertension interventions in Nepal. 2017;12(3):227-32.
8. Panday S, Bissell P, Van Teijlingen E, Simkhada PJBhsr. The contribution of female community health volunteers (FCHVs) to maternity care in Nepal: a qualitative study. 2017;17(1):623.
9. Ministry of Health and Population. Female Community Health Volunteer National Survey Report 2014 Kathmandu: MOHP/JSI; 2014 [Available from: https://www.advancingpartners.org/sites/default/files/sites/default/files/resources/fchv_2014_national_survey_report_a4_final_508_0.pdf.
1 note
·
View note
Text
IT and Non IT Training in Nepal
If you are ready to build your career in IT and Non-IT training, enroll in any of various training in Nepal!
According to my research, I found best HR training provided by UpSkills Nepal with many different IT and Non It courses!
Most Of top Non IT courses are:
Digital marketing training in Nepal
HR training in Nepal
SEO training in Nepal
Accounting training in Nepal
Graphics design training in Nepal
Diploma in digital marketing in Nepal
Most important IT courses are:
Cybersecurity courses in Nepal
Data science traning in Nepal
AI training in Nepal
DevOps training in Nepal
Python traning in Nepal
UI/UX training in Nepal
#professional hr training#hr training#digital marketing company#digital marketing#digital marketing training#seo training#seo marketing#diploma courses#devops#devops training#cybersecurity#cybersecurity training#data science training#ui ux design#python course#python tutorial#accounting tips
0 notes
Text
Data science is a field of study that works with enormous amounts of data utilizing contemporary technologies and methodologies to uncover hidden patterns, obtain valuable information, and make business decisions. Datamites provides data science courses in the Nepal along with artificial intelligence, python, data analytics, machine learning etc.
0 notes
Text
Data Management and Visualization - Peer-graded Assignment: Making Data Management Decisions Week 3
Week 3 Script
# -*- coding: utf-8 -*-
"""
Created on Thu Dec 17 16:55:49 2020
@author: Rebecca Watson - Data Management and Visualization Course
"""
# Import the libraries
import pandas
import numpy
# Import the dataset
data = pandas.read_csv('CombinedData2.csv', low_memory=False)
#upper-case all DataFrame column names - place afer code for loading data aboave
data.columns = list(map(str.upper, data.columns))
# bug fix for display formats to avoid run time errors - put after code for loading data above
#pandas.set_option('display.float_format', lambda x:'%f'%x)
print ('!!!! Demonstrating displaying columns and rows of dataset !!!!')
print (len(data.columns)) # number of variables (columns)
print (len(data)) #number of observations (rows)
#print("\ntypes of data:\n", data.dtypes, sep="")
# setting variables to numeric
data['10YRAVERAGEEDU'] = pandas.to_numeric(data['10YRAVERAGEEDU'])
data['10YRAVEBIRTHATT'] = pandas.to_numeric(data['10YRAVEBIRTHATT'])
data['10YRAVEINFMORT'] = pandas.to_numeric(data['10YRAVEINFMORT'])
#Set missing data to NAN
data['GROUPVALUE10YRAVEBIRTHATT2']=data['GROUPVALUE10YRAVEBIRTHATT2'].replace(9, numpy.nan)
print ('')
print ('+++++++++++++++++++++++++++++++++++++++++++++++++++++++++++++++++++++')
print ('')
print ('+++++++++++++++++++++ Demonstrating Grouping Data - Identifying Missing Data +++++++++++++++++++++')
print ('')
print ('# of Countries Average number of Live Births Attended by Health Professionals from 2000-2009')
ct3 = data.groupby('GROUPVALUE10YRAVEBIRTHATT').size()
print(ct3)
print (len(data['GROUPVALUE10YRAVEBIRTHATT'])) # add number of observations (rows)
print ('')
print ('% of Countries Average number of Live Births Attended by Health Professionals from 2000-2009')
pt3 = data.groupby('GROUPVALUE10YRAVEBIRTHATT').size() * 100 / len(data)
print(pt3)
print (len(data['GROUPVALUE10YRAVEBIRTHATT'])) # add number of observations (rows)
print ('+++++++++++++++++++++++++++++++++++++++++++++++++++++++++++++++++++++')
print ('')
print ('+++++++++++++++++++++ Demonstrating Subset Data - Removing Missing Data +++++++++++++++++++++')
print ('')
sub1 = data[["COUNTRY", "10YRAVERAGEEDU", "10YRAVEINFMORT", "10YRAVEBIRTHATT"]]
#make a copy of my new subsetted data
sub2 = sub1.copy()
print(sub2)
# remove rows with missing values
sub9 = sub2.dropna()
subclean = sub9.copy()
# print data summary (of numeric variables)
print(subclean.describe())
print ('')
print ('+++++++++++++++++++++++++++++++++++++++++++++++++++++++++++++++++++++')
print ('')
print ('+++++++++++++++++++++ Demonstrating Binning +++++++++++++++++++++')
print ('')
# # create six equal-sized groups per variable
subclean['GroupEducation'] = pandas.qcut(subclean['10YRAVERAGEEDU'], 6)
subclean['GroupMortality'] = pandas.qcut(subclean['10YRAVEINFMORT'], 6)
subclean['GroupBirthAtt'] = pandas.qcut(subclean['10YRAVEBIRTHATT'], 6)
# print the first five rows of the data
print("First five rows of the data:\n", subclean.head())
print ('')
print ('+++++++++++++++++++++++++++++++++++++++++++++++++++++++++++++++++++++')
print ('')
print ('+++++++++++ Demonstrating Grouping ++++++++++++')
print ('')
#ADDING MORE DESCRIPTIVE TITLES
print('/GROUPVALUE10YRAVEEDU/ Total Count of Countries By Average Years of Education females 14-44 from YRS 2000-2009')
c1 = data['GROUPVALUE10YRAVEEDU'].value_counts(sort=True)
print (c1)
print (len(data['GROUPVALUE10YRAVEEDU'])) # add number of observations (rows)
print ('')
print('/GROUPVALUE10YRAVEEDU/ Percentages of Countries By Average Years of Education females 14-44 from YRS 2000-2009')
p1 = data['GROUPVALUE10YRAVEEDU'].value_counts(sort=True, normalize=True)
print (p1)
print ('')
print ('/GROUPVALUE10YRAVEMORT/ Total Count of Countries By Average Infant Mortality Rates from YRS 2000-2009')
c2 = data["GROUPVALUE10YRAVEMORT"].value_counts(sort=True)
print (c2)
print (len(data['GROUPVALUE10YRAVEMORT'])) # adding number of observations (rows)
print ('')
print ('/GROUPVALUE10YRAVEMORT/ Percentages of Countries By Average Infant Mortality Rates from YRS 2000-2009')
p2 = data["GROUPVALUE10YRAVEMORT"].value_counts(sort=True, normalize=True)
print (p2)
print ('')
print ('/GROUPVALUE10YRAVEBIRTHATT/ Total Count of Countries By Average number of Live Births Attended by Health Professionals from YRS 2000-2009')
c3 = data["GROUPVALUE10YRAVEBIRTHATT"].value_counts(sort=True)
print (c3)
print (len(data['GROUPVALUE10YRAVEBIRTHATT'])) # add number of observations (rows)
print ('')
print ('/GROUPVALUE10YRAVEBIRTHATT/ Percentages of Countries By Average number of Live Births Attended by Health Professionals from YRS 2000-2009 ')
p3 = data["GROUPVALUE10YRAVEBIRTHATT"].value_counts(sort=True, normalize=True)
print (p3)
print ('')
print ('+++++++++++ END OF Running Week 3 Program Assignment ++++++++++++')
@@@@@@@@@@@@@@@@@@@@@@@@@@
OUTPUT FROM CODE
runfile('C:/Users/Rebecca/Desktop/Data Course/Python Files/Week3Script.py', wdir='C:/Users/Rebecca/Desktop/Data Course/Python Files') !!!! Demonstrating displaying columns and rows of dataset !!!! 8 174
+++++++++++++++++++++++++++++++++++++++++++++++++++++++++++++++++++++
+++++++++++++++++++++ Demonstrating Grouping Data - Identifying Missing Data +++++++++++++++++++++
# of Countries Average number of Live Births Attended by Health Professionals from 2000-2009 GROUPVALUE10YRAVEBIRTHATT 1 (0-25 Percent) 10 2 (25-50 Percent) 25 3 (50-75 Percent) 25 4 (75-100 Percent) 103 9 Unknown 11 dtype: int64 174
% of Countries Average number of Live Births Attended by Health Professionals from 2000-2009 GROUPVALUE10YRAVEBIRTHATT 1 (0-25 Percent) 5.747126 2 (25-50 Percent) 14.367816 3 (50-75 Percent) 14.367816 4 (75-100 Percent) 59.195402 9 Unknown 6.321839 dtype: float64 174 +++++++++++++++++++++++++++++++++++++++++++++++++++++++++++++++++++++
+++++++++++++++++++++ Demonstrating Subset Data - Removing Missing Data +++++++++++++++++++++
COUNTRY 10YRAVERAGEEDU 10YRAVEINFMORT 10YRAVEBIRTHATT 0 Ethiopia 1.73 71.73 0.059000 1 Chad 1.26 100.63 0.140500 2 Nepal 2.61 48.05 0.143250 3 Bangladesh 4.08 52.37 0.162429 4 Niger 1.07 84.62 0.167000 .. ... ... ... ... 169 Belgium 12.19 4.17 NaN 170 Israel 12.86 4.64 NaN 171 Spain 10.33 4.81 NaN 172 United Kingdom 12.83 5.11 NaN 173 Greece 11.82 5.24 NaN
[174 rows x 4 columns] 10YRAVERAGEEDU 10YRAVEINFMORT 10YRAVEBIRTHATT count 163.000000 163.000000 163.000000 mean 8.095153 37.579509 0.769883 std 3.587864 30.809262 0.268889 min 0.620000 2.470000 0.059000 25% 4.980000 12.410000 0.558375 50% 8.590000 24.520000 0.922333 75% 11.230000 57.890000 0.987821 max 14.380000 129.000000 0.999100
+++++++++++++++++++++++++++++++++++++++++++++++++++++++++++++++++++++
+++++++++++++++++++++ Demonstrating Binning +++++++++++++++++++
First five rows of the data: COUNTRY 10YRAVERAGEEDU ... GroupMortality GroupBirthAtt 0 Ethiopia 1.73 ... (50.25, 71.93] (0.057999999999999996, 0.448] 1 Chad 1.26 ... (71.93, 129.0] (0.057999999999999996, 0.448] 2 Nepal 2.61 ... (24.52, 50.25] (0.057999999999999996, 0.448] 3 Bangladesh 4.08 ... (50.25, 71.93] (0.057999999999999996, 0.448] 4 Niger 1.07 ... (71.93, 129.0] (0.057999999999999996, 0.448]
[5 rows x 7 columns]
+++++++++++++++++++++++++++++++++++++++++++++++++++++++++++++++++++++
+++++++++++ Demonstrating Grouping ++++++++++++
/GROUPVALUE10YRAVEEDU/ Total Count of Countries By Average Years of Education females 14-44 from YRS 2000-2009 7 (10-12 years) 45 8 (12-15 years) 29 6 (8-10 years) 27 5 (6-8 years) 23 4 (4-6 years) 21 3 (2-4 years) 19 2 (1-2 years) 9 1 (0-1 years) 1 Name: GROUPVALUE10YRAVEEDU, dtype: int64 174
/GROUPVALUE10YRAVEEDU/ Percentages of Countries By Average Years of Education females 14-44 from YRS 2000-2009 7 (10-12 years) 0.258621 8 (12-15 years) 0.166667 6 (8-10 years) 0.155172 5 (6-8 years) 0.132184 4 (4-6 years) 0.120690 3 (2-4 years) 0.109195 2 (1-2 years) 0.051724 1 (0-1 years) 0.005747 Name: GROUPVALUE10YRAVEEDU, dtype: float64
/GROUPVALUE10YRAVEMORT/ Total Count of Countries By Average Infant Mortality Rates from YRS 2000-2009 1 (0-10 per 1000) 45 2 (10-20 per 1000) 30 3 (20-30 per 1000) 26 7 (60-80 per 1000) 18 6 (50-60 per 1000) 16 8 (80-100 per 1000) 16 4 (30-40 per 1000) 10 5 (40-50 per 1000) 8 9 (100-130 per 1000) 5 Name: GROUPVALUE10YRAVEMORT, dtype: int64 174
/GROUPVALUE10YRAVEMORT/ Percentages of Countries By Average Infant Mortality Rates from YRS 2000-2009 1 (0-10 per 1000) 0.258621 2 (10-20 per 1000) 0.172414 3 (20-30 per 1000) 0.149425 7 (60-80 per 1000) 0.103448 6 (50-60 per 1000) 0.091954 8 (80-100 per 1000) 0.091954 4 (30-40 per 1000) 0.057471 5 (40-50 per 1000) 0.045977 9 (100-130 per 1000) 0.028736 Name: GROUPVALUE10YRAVEMORT, dtype: float64
/GROUPVALUE10YRAVEBIRTHATT/ Total Count of Countries By Average number of Live Births Attended by Health Professionals from YRS 2000-2009 4 (75-100 Percent) 103 3 (50-75 Percent) 25 2 (25-50 Percent) 25 9 Unknown 11 1 (0-25 Percent) 10 Name: GROUPVALUE10YRAVEBIRTHATT, dtype: int64 174
/GROUPVALUE10YRAVEBIRTHATT/ Percentages of Countries By Average number of Live Births Attended by Health Professionals from YRS 2000-2009 4 (75-100 Percent) 0.591954 3 (50-75 Percent) 0.143678 2 (25-50 Percent) 0.143678 9 Unknown 0.063218 1 (0-25 Percent) 0.057471 Name: GROUPVALUE10YRAVEBIRTHATT, dtype: float64
+++++++++++ END OF Running Week 3 Program Assignment ++++++++++++
@@@@@@@@@@@@@@@@@@@@@@@@@@
Questions -
· Does female education level affect child mortality (0-5 years)?
· Is female education level associated with higher births attended by qualified health professional thus decreasing child mortality?
· Is female education associated with a change in total fertility rate?
Hypothesis (revised 20DEC2020) -
From 2000-2009, countries with higher female education level have a lower child (0-5 years) mortality rate than countries with lower female education level.
VARIABLES
10YRAVERAGEEDU 10YRAVEINFMORT 10YRAVEBIRTHATT
Data from Countries Average number of Live Births Attended by Health Professionals from 2000-2009 had missing data which I eliminated with this week’s script.
I binned each of my variables into six (6) equal sized groups.
The data was sub-set to the lowest 5 educated countries to begin supporting my hypothesis.


0 notes
Text
How to Launch an IT Career from Scratch in 2025: A Practical Guide
Considering an IT career in 2025 but starting with no experience? It’s more achievable than you think. At TechAxis, we’ve guided countless beginners in Nepal—and beyond—into the industry. Here’s a straightforward plan to get you started.
1. Choose Your Path IT offers diverse fields: coding (e.g., Python), web development (e.g., MERN Stack), or system automation (e.g., DevOps). Python is ideal for beginners due to its versatility—think apps or data analysis. MERN Stack suits those interested in building websites. Select a focus that aligns with your goals.
2. Master the Fundamentals Begin with accessible resources—online tutorials or free coding platforms. Experiment with a small project, like a basic calculator in Python. Early mistakes are part of the process; they build your confidence. Consistency here is key.
3. Develop Marketable Skills Concentrate on one area. Create a practical project—a to-do app or a simple webpage—to showcase your progress. Daily practice, even briefly, sharpens your abilities. At TechAxis, our hands-on training accelerates this, but self-study works too with discipline.
4. Secure Your First Role Compile your projects into a portfolio. Apply for entry-level positions or internships—Nepal’s IT sector is growing, with opportunities aplenty. Our JobAxle platform connects learners to jobs, though any local listing can be a start. Initial roles may involve basic tasks, but they pave the way forward.
The Takeaway Breaking into IT requires effort, not prerequisites. Start small, stay committed, and results follow. For structured support, explore our professional courses at techaxis.com.np. Ready to take the first step?
#ITCareer #TechTraining #NepalIT #ProfessionalDevelopment #LearnIT
1 note
·
View note
Text
Week 2
Upon learning both SAS and python, I have decided to use SAS to run my codes.
My codes:
LIBNAME mydata "/courses/d1406ae5ba27fe300" access=readonly;
DATA new; set mydata.gapminder;
LABEL
country="Country"
incomeperperson="Income (per person)"
suicideper100th="Suicide Rate"
relectricperperson="Electricity (per person)";
Income_Category=" ";
Electricity_Category=" ";
Suicide_Category=" ";
/* Asian Countries */
IF country="China" or country="India" or country="Indonesia" or country="Pakistan" or country="Bangladesh" or country="Japan" or country="Philippines" or country="Vietnam" or country="Turkey" or country="Iran" or country="Thailand" or country="Myanmar" or country="Korea, Rep." or country="Iraq" or country="Afghanistan" or country="Saudi Arabia" or country="Uzbekistan" or country="Malaysia" or country="Yemen" or country="Nepal" or country="Korea, Dem. Rep." or country="Sri Lanka" or country="Kazakhstan" or country="Syria" or country="Cambodia" or country="Jordan" or country="Azerbaijan" or country="United Arab Emirates" or country="Tajikistan" or country="Israel" or country="Laos" or country="Lebanon" or country="Krygyzstan" or country="Turkmenistan" or country="Singapore" or country="Oman" or country="State of Palestine" or country="Kuwait" or country="Georgia" or country="Mongolia" or country="Armenia" or country="Qatar" or country="Bahrain" or country="Timor-Leste" or country="Cyprus" or country="Bhutan" or country="Maldives" or country="Brunei";
/* Income Category */
if incomeperperson LE 1035 then Income_Category= "1. $0 - $1,035";
else if incomeperperson LE 4045 then Income_Category= "2. $1,036 - $4,045 ";
else if incomeperperson LE 12535 then Income_Category= "3. $4,046 - $12,535";
else if incomeperperson GT 12535 then Income_Category= "4. Over $12,536";
/* Suicide Category */
if suicideper100th LE 10 then Suicide_Category="1. Low";
else if suicideper100th LE 20 then Suicide_Category="2. Moderate";
else if suicideper100th GT 20 then Suicide_Category="3. High";
/* Electricity_Category */
if relectricperperson LE 2000 then Electricity_Category="1. Very Low";
else if relectricperperson LE 4000 then Electricity_Category="2. Low";
else if relectricperperson LE 6000 then Electricity_Category="3. Moderate";
else if relectricperperson LE 8000 then Electricity_Category="4. High";
else if relectricperperson GT 8000 then Electricity_Category="5. Very High";
PROC SORT; by country;
PROC SORT; by Income_Category;
PROC SORT; by Suicide_Category;
PROC SORT; by Electricity_Category;
PROC FREQ; TABLES country Income_Category Suicide_Category Electricity_Category;
RUN;
LOG: No Error
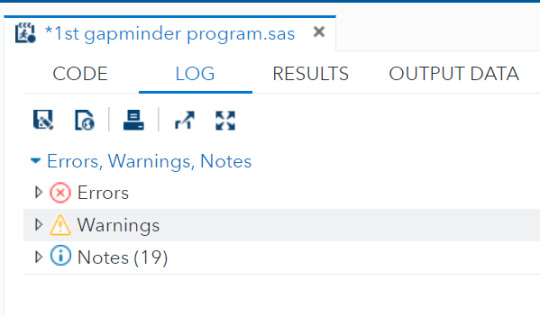
Asian Countries
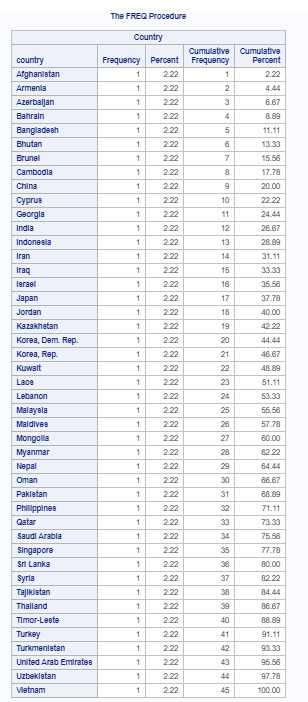
Officially, there are actually 48 countries in Asia, therefore I defined all 48 countries in my code. However, only 45 countries were shown in the results, which indicate that there are 3 Asian countries that did not participate in the survey.
Income (per person)
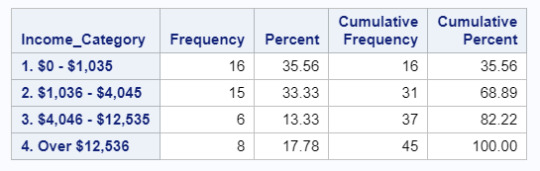
As displayed in the table above, there are 16 countries (35.56%) with an income per person of less than $1,035 while 15 countries have an income per person of less than $4,045. According to World Bank, these countries are classified as low income economy and lower-middle income economy respectively. On the other hand, 14 countries have better economy conditions where 6 of them are of upper-middle income economy and 8 of them with high income economy.
Suicide Rate
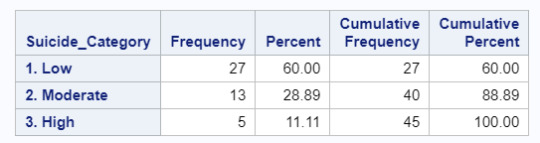
Based on the table, majority of the Asian countries have a low suicide rate, 27 countries (60%) to be specific. Meanwhile, another 13 countries (28.89%) have moderate suicide rate and only 5 countries (11.11%) have high suicide rate.
Electricity Consumption (per person)
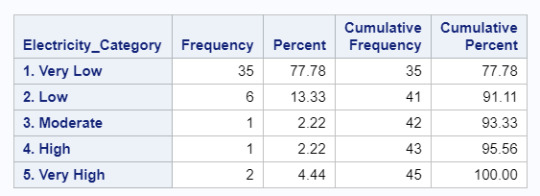
As seen in the table, a vast majority (77.78%) of the Asian countries have very low electricity consumption. There are 6 countries (13.33%) with low electricity consumption, 1 country (2.22%) with moderate electricity consumption, 1 country (2.22%) with high electricity consumption and 2 countries (4.44%) with very high electricity consumption.
0 notes