#satellite image distribution
Text

Ways NASA Studies the Ocean
We live on a water planet. The ocean covers a huge part of the Earth's surface – earning it the name Blue Marble.
The ocean is one of Earth’s largest ecosystems and helps moderate Earth’s climate. NASA scientists spend a lot of time studying the ocean and how it is changing as Earth’s climate changes.
In the last few years, NASA has launched an array of missions dedicated to studying this precious part of our planet, with more to come. For World Oceans Month, which starts in June, here are new ways NASA studies the ocean.
youtube
1. Seeing the colors of the ocean 🎨
A new NASA mission called PACE will see Earth’s oceans in more color than ever before. The color of the ocean is determined by the interaction of sunlight with substances or particles present in seawater.
Scheduled to launch in 2024, PACE will help scientists assess ocean health by measuring the distribution of phytoplankton, tiny plants and algae that sustain the marine food web. PACE will also continue measuring key atmospheric variables associated with air quality and Earth's climate.
2. Surveying surface water around the globe 💧
The SWOT satellite, launched in late 2022, is studying Earth’s freshwater – from oceans and coasts to rivers, lakes and more – to create the first global survey of Earth’s surface water.
SWOT is able to measure the elevation of water, observing how major bodies of water are changing and detecting ocean features. The data SWOT collects will help scientists assess water resources, track regional sea level changes, monitor changing coastlines, and observe small ocean currents and eddies.
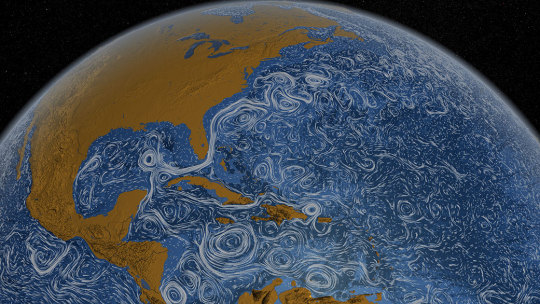
3. Setting sail to understand interactions between the ocean and atmosphere 🚢
With research aircraft, a research ship, and autonomous ocean instruments like gliders, NASA’s S-MODE mission is setting sail to study Earth’s oceans up close. Their goal? To understand ocean whirlpools, eddies and currents.
These swirling ocean features drive the give-and-take of nutrients and energy between the ocean and atmosphere and, ultimately, help shape Earth’s climate.
4. Building ocean satellites the size of a shoebox 📦
NASA’s HawkEye instrument collects ocean color data and captures gorgeous images of Earth from its orbit just over 355 miles (575 kilometers) above Earth’s surface. It’s also aboard a tiny satellite measuring just 10cm x 10 cm x 30 cm – about the size of a shoebox!

5. Designing new missions to study Earth’s oceans! 🌊
NASA is currently designing a new space-based instrument called GLIMR that will help scientists observe and monitor oceans throughout the Gulf of Mexico, the southeastern U.S. coastline and the Amazon River plume that stretches to the Atlantic Ocean. GLIMR will also provide important information about oil spills, harmful algae blooms, water quality and more to local agencies.
6. Taking the ocean to new heights ⬆️
The U.S.-European Sentinel-6 Michael Freilich satellite is helping researchers measure the height of the ocean - a key component in understanding how Earth’s climate is changing.
This mission, which launched in 2020, has a serious job to do. It’s not only helping meteorologists improve their weather forecasts, but it’s helping researchers understand how climate change is changing Earth’s coastlines in real time.
Make sure to follow us on Tumblr for your regular dose of space!
2K notes
·
View notes
Text
✨ Pre-Birthday Preparations Timeline for Xavier: A Global Celebration of Our Star Prince ✨
As Xavier's birthday draws near, the fandom is buzzing with excitement across the globe! Our community has been hard at work since May, creating memorable ways to celebrate our beloved Prince of Philos. From our CN Star Sisters to Xavier’s Little Stars, the love for our Light has transcended borders, uniting us in preparing for his special day.
Aside from our international cupsleeve events, here’s a sneak peek of some of the highlights of our preparations:
⭐️CN Star Sisters and Global Little Stars gathered heartfelt written and audio messages to be sent to a satellite in honor of Xavier.
⭐️Collaboration with the elemeo food app, where fans could collect points (wishing stars) to help fund Xavier’s birthday.
⭐️Announcement of personally-sponsored 100K boarding passes with Xavier’s image at Beijing Capital International Airport.
⭐️Donation of 2 solar street lights to rural areas.
⭐️Xavier’s Little Stars symbolically purchased and named twin stars in the sky “Starhunter and Moonchaser” in Xavier’s honor.
⭐️Another symbolic buying and naming of a star in the sky "Xavier-Lumiere" with its own star website and virtual reality access (personal project).
⭐️10+ shopping malls were rented for Xavier's birthday with giant LED screens, interactive photo walls, and decorations.
⭐️The Stellaris fan site was launched to unite Xavier’s global fanbase.
⭐️Milk tea collaboration kicked off, distributing 6,000 custom cup sleeves across 20 stores.
⭐️A personally-funded tree-planting project in Sabah, Borneo.
⭐️300+ Xavier billboards across the globe, including LED light shows, giant screen previews, sky curtain screens, LED office buildings, and LED screens on one of the most crowded subway tunnels in China.
⭐️The “Seeds of Hope” (tree-planting) and “Nourishing Hearts” (food for the needy) fundraising campaigns were launched by Xavier's Little Stars.
⭐️A personally-rented yacht where 6 other Xavier stans were invited to celebrate.
⭐️Ferris Wheel collaboration
⭐️52 movie theaters to broadcast Xavier videos before every movie on October 16th.
…and more!
This celebration is more than just a birthday party— it’s a symbol of the unity, passion, and light that Xavier has brought to all of us. Swipe through the supporting graphics for a full timeline of events and stay tuned for even more projects, events, and surprises that will make this celebration truly unforgettable! Let’s keep shining our light for Xavier. 🌟
The real countdown starts on September 16, leading up to Xavier’s birthday on October 16. Celebrate with us!
Thank you to every Star Sister, Little Star, and Global Stan for making this celebration shine as bright as Xavier himself! 🌟
Disclaimer: these projects and events are fan-hosted and not affiliated with the official Love and Deepspace game.


#xavier love and deepspace#lumiere love and deepspace#love and deepspace#zayne love and deepspace#rafayel love and deepspace#lnds xavier#lnds sylus#sylus#lnds zayne#lnds rafayel#lnds#love and deepspace smut#lads xavier#lads rafayel#lads sylus#lads zayne#love and deepspace fanart#lads mc#misty invasion#sylus love and deepspace#lads
37 notes
·
View notes
Text


Hubble captures unique ultraviolet view of a spectacular star cluster
Roughly 210,000 light-years away, the Small Magellanic Cloud (SMC) is one of our Milky Way galaxy's closest neighbors. In fact, this small galaxy is one of the Milky Way's "satellite" galaxies, which orbit our home spiral galaxy.
Nested within the SMC is this spectacular star cluster, known as NGC 346. Its hot stars unleash a torrent of radiation and energetic outflows, which erode the denser portions of gas and dust in the surrounding nebula, N66. Dozens of hot, blue, and high-mass stars shine within NGC 346, and astronomers believe this cluster contains more than half of the known high-mass stars in the whole SMC.
The NASA/ESA Hubble Space Telescope has observed this cluster before, but its new view shows NGC 346 in ultraviolet light, along with some visible-light data. Ultraviolet light helps scientists understand more about star formation and evolution, and Hubble—with its combined sharp resolution and position above our UV-blocking atmosphere—is the only telescope with the ability to make sensitive, ultraviolet observations.
These specific observations were gathered to learn more about how star formation shapes the interstellar medium, which is the gas distributed throughout seemingly empty space, in a low-metallicity galaxy like the SMC. Astronomers call elements heavier than hydrogen and helium "metals," and the SMC contains fewer metals when compared to most parts of our Milky Way. This condition helps make it an excellent example of a galaxy similar to those that existed in our early universe, when very few heavy elements were around to incorporate.
TOP IMAGE: NGC 346 is nestled within the Small Magellanic Cloud, a small satellite galaxy to our Milky Way. Credit: NASA, ESA, and C. Murray (Space Telescope Science Institute); Image Processing: Gladys Kober (NASA/Catholic University of America)
CENTRE IMAGE: This inset image shows the location of NGC 346 within the Small Magellanic Cloud. Credit: NASA, ESA, C. Murray (Space Telescope Science Institute), and ESO/VISTA VMC; Image Processing: Gladys Kober (NASA/Catholic University of America)
LOWER IMAGE: These two Hubble images of NGC 346 show the star cluster in visible and ultraviolet wavelengths of light. Credit: NASA, ESA, A. James (STScI), and C. Murray (Space Telescope Science Institute); Image Processing: Gladys Kober (NASA/Catholic University of America)
22 notes
·
View notes
Text
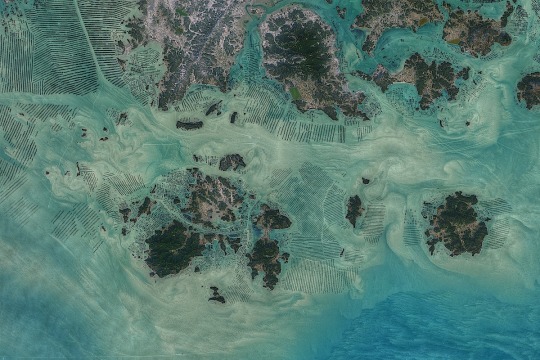
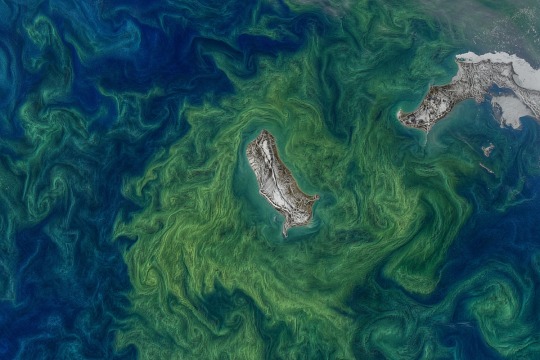
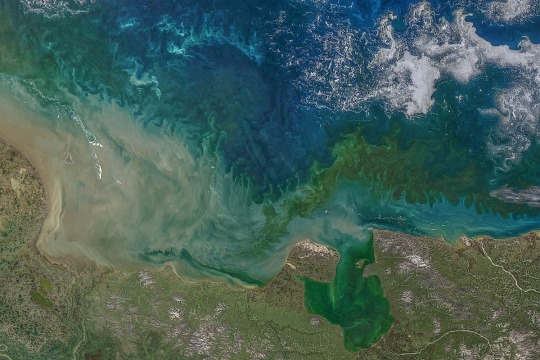
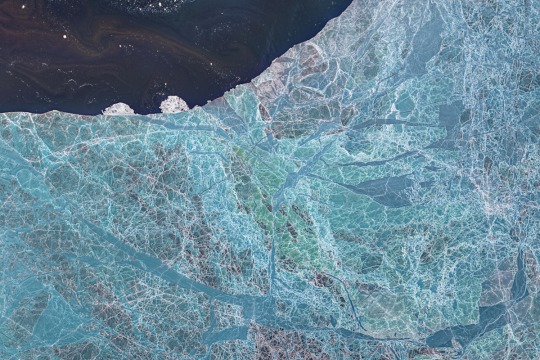
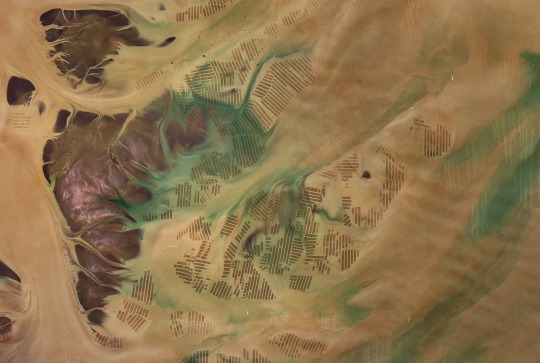
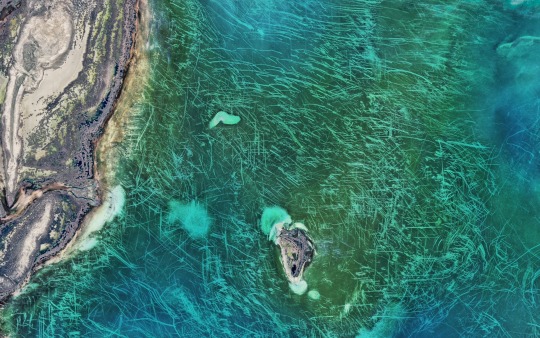
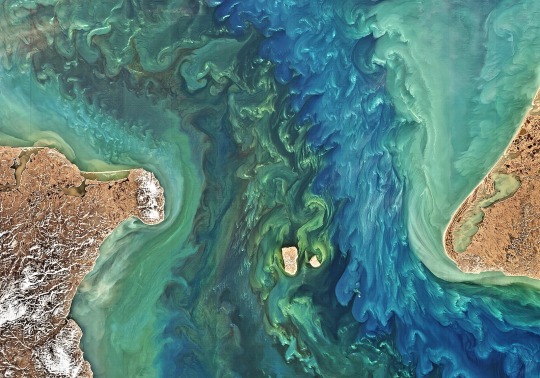
Some cool satellite imagery I collected for something at work. All images are taken from NASA's Ocean Color Web at the Ocean Biology Distributed Active Archive Center (OB.DAAC).
Info about each image under cut.
1. South Korean Aquaculture - Aquaculture operations off the southern end of the Korean Peninsula, featuring tide-drive swirls of suspended sediment and phytoplankton (captured by Landsat 8 on Feb. 19, 2021)
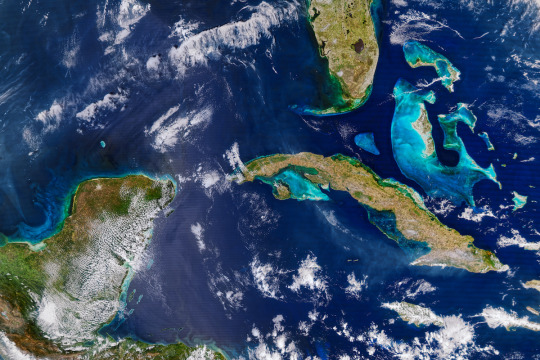
2. Smoke on Blue Waters - Coastal waters of the SE Gulf of Mexico, Western Caribbean Sea, and Lucayan Archipelago. Smoke plumes from forest fires in Cuba can also be seen (captured by Aqua-MODIS sensor on March 1, 2023)
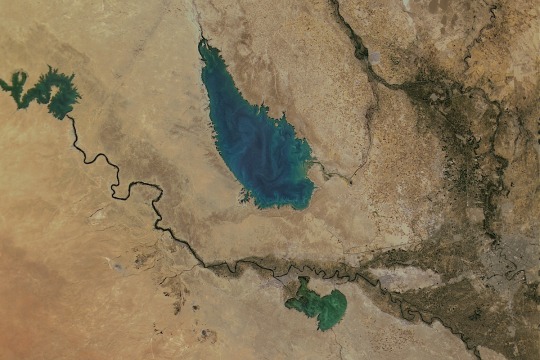
3. Mesopotamia- The artificial Lake Tharthar near Baghdad and the Tigris and Euphrates Rivers (captured by SeaHawk/HawkEye on September 11, 2021)
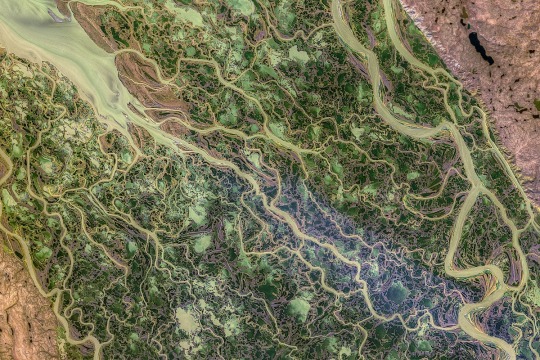
4. Mackenzie River Delta - A heavy sediment load delivered by Canada's Mackenzie River to its delta by the Beaufort Sea (collected by Landsat 8 on September 9, 2021)
5. Svenskøya - Dense blooms of phytoplankton around the island of Svenskøya in the Svalbard Archipelago (captured by Landsat 8 on July 6, 2021)
6. East Siberian Sea - Color from phytoplankton, suspended sediments, and colored dissolved organic matter from sea ice (captured by Aqua/MODIS on July 20, 2020)
7. Laptev Sea Ice - Thin sea ice in the southern Laptev Sea transmitting colors of water, algae, sediment, colored dissolved organic matter, and the ice itself (captured by Landsat 8 on June 12, 2020)
8. Chinese Aquaculture - Aquaculture in the Yellow Sea off the coast of Jiangsu Province (captured by Landsat 8 on March 8, 2017)
9. Ice Gouges in the Caspian Sea - Lines on the floor of the Caspian Sea in the Tyuleniy Archipelago that were gouged out by ice (captured by Landsat 8/OLI on April 6, 2016)
10. The Bering Strait - The Bering Strait joining the Bering (south) and Chukchi (north) seas. It is the only connection between the Pacific and Arctic Oceans (captured by Landsat-8/OLI on June 17, 2015)
32 notes
·
View notes
Text

COBE Hotspots: The Oldest Structures Known - February 6th, 1996.
"Above are two microwave images of the sky, looking north and south of our galaxy's equator, based on data from NASA's COBE satellite. After computer processing to remove contributions from nearby objects, and the effects of the earth's motion, they show "spots". These spots are the oldest structures known - probably the oldest structures humanity will ever know. They are also the most distant. As our Universe expanded and cooled, conglomerations of mass formed - these are some of the first. They confirm that only a million years after the big-bang - which occurred roughly 15 billion years ago - parts of the Universe were visibly hotter than other parts. By studying the size and distribution of the spots found with COBE and future missions, astronomers hope to learn what matter and processes caused the spots to form - and hence determine the composition, density, and future of our Universe."
37 notes
·
View notes
Text
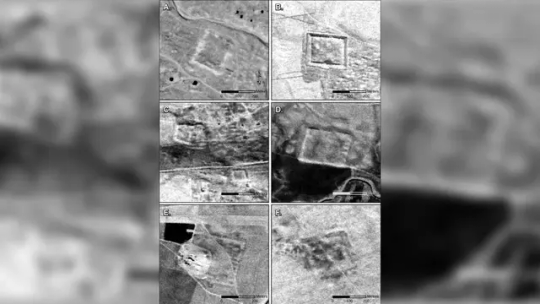
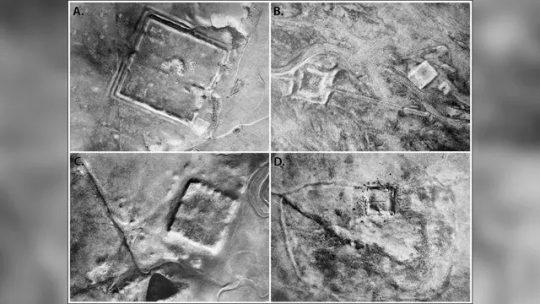
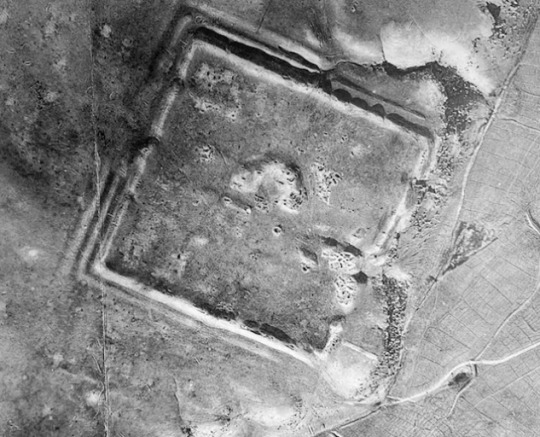
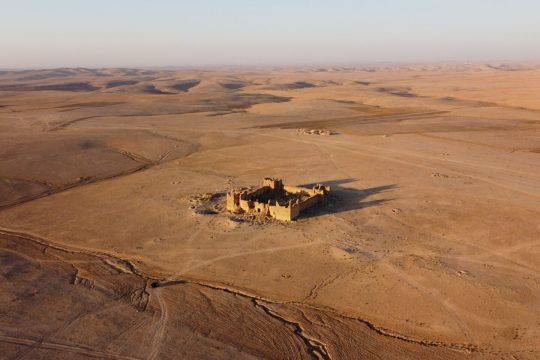
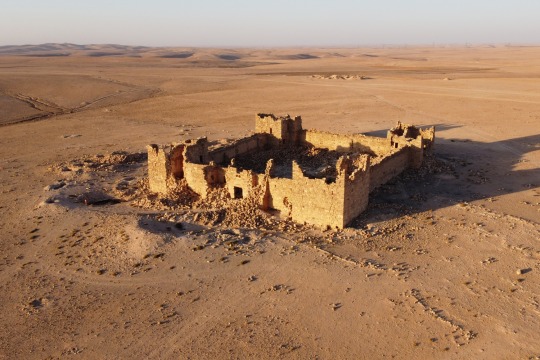
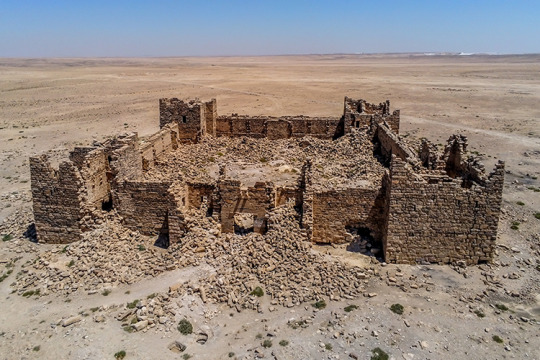
Spy Satellite Photos Reveal Hundreds of Long-Lost Roman Forts
Declassified photos captured by United States spy satellites launched during the Cold War have revealed an archaeological treasure trove: hundreds of previously unknown Roman-era forts, in what is now Iraq and Syria.
Many of those long-lost structures may be gone forever at this point, destroyed or damaged over recent decades due to agricultural expansion, urban development and war. Nevertheless, the discovery of the forts’ existence challenges a popular hypothesis established in the 1930s about the role of such fortifications along the ancient Roman Empire’s eastern border, researchers reported Wednesday in the journal Antiquity.
Based on the satellite views, the high number of forts and their widespread distribution hints that the forts may not have been erected to keep enemies out, as the decades-old theory suggested. Rather, the structures were likely built to ensure safe passage for caravans and travelers along routes that saw plenty of nonmilitary traffic. These forts, according to the study authors, were outposts and havens, not hostile barriers.
High-resolution images analyzed in the new study were taken during flyovers by multiple satellites belonging to two US military programs: the Corona Project (1960 to 1972) and Hexagon (1971 to 1986). Corona’s images were declassified in 1995, and Hexagon’s photos were released to the public in 2011.
Images from Hexagon and Corona are invaluable for archaeologists because they preserve snapshots of landscapes that have since undergone significant disruption, said lead study author Jesse Casana, an archaeologist and professor in the department of anthropology at Dartmouth College in New Hampshire.
“Agriculture and urbanization have destroyed a lot of archaeological sites and features to a shocking degree,” Casana said. “This old imagery allows us to see things that are often either obscured or no longer extant today.”
Spy satellite photos vs. the Poidebard survey
Satellite images are especially helpful for searches across the northern part of the Fertile Crescent in the Middle East — from the eastern coast of the Mediterranean to western Iran — because of the area’s archaeological importance and high visibility of the ground in photos, Casana added.
The research team pored over the images for signs of Roman forts, which have a distinctive square shape and walls that usually measure about 164 to 262 feet (50 to 80 meters) long. The scientists began their search using reference maps from an aerial survey of the region conducted in the 1920s and 1930s by French archaeologist and Jesuit missionary Father Antoine Poidebard. That survey was among the first to photograph archaeological sites from the air, and in 1934 Poidebard reported finding 116 Roman forts.
It was an unprecedented achievement. But nearly a century later, mapping Poidebard’s forts to satellite photos was challenging. Because his map wasn’t large-scale, it contained numerous spatial errors, Casana said. Poidebard also did not provide names or numbers for most of the forts he found, identifying them instead by their proximity to geologic features.
Those forts were aligned north to south along what was once the easternmost boundary of the Roman Empire, according to Poidebard. This arrangement, he claimed, was surely intended to guard against invaders from the east.
But Poidebard’s survey provided only a partial view of Rome’s ancient infrastructure, the researchers found. What he overlooked — and what the satellite photos revealed — was that the north-to-south line of 116 forts was actually only a narrow sliver of a cluster spreading from east to west and containing 396 fortified structures.
The forts spanned approximately 116,000 square miles (300,000 square kilometers), “extending from Mosul, on the Tigris River in Iraq, through Ninawa province, across the Khabur and the Balikh valleys, continuing to the semi-arid plains west of the Euphrates River, leading to western Syria and the Mediterranean,” according to the study.

Oases of safety for ancient Rome
When the archaeologists performed a second survey of an image subset, they found 106 more fortlike structures, hinting that further investigations will yield many more Roman forts. Based on excavations of other Roman sites in the region, the scientists estimated that the forts were built between the second and sixth centuries.
While Poidebard’s row of forts along the Roman Empire’s eastern front looked like a military fortification, this new evidence suggested that the forts collectively served a different purpose. Rather than presenting an impassable wall on a violent frontier, they provided oases of safety and order along well-traveled Roman roads.
Borders in this world “were places of dynamic cultural exchange and movement of goods and ideas,” not barriers, Casana said. And perhaps that perspective holds a lesson for the modern era, he added.
“Historically, as an archaeologist, I can say that there have been many attempts by ancient states to build walls across borders and it has been a universal failure,” Casana said. “If there’s any way that archaeology contributes to modern discourse, I would hope it is that building giant walls to keep people out is a bad plan.”
By Mindy Weisberger.
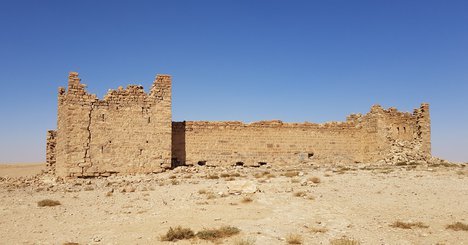
#Spy Satellite Photos Reveal Hundreds of Long-Lost Roman Forts#unknown Roman-era forts#iraq#syria#Roman Empire’s eastern border#ancient artifacts#archeology#archeolgst#history#history news#ancient history#ancient culture#ancient civilizations#roman history#roman empire#Qasr Bshi
49 notes
·
View notes
Note
What jobs have you had?
(I'm not trying to dox but your life seems super cool and I hope that's okay to ask 🥺)
Working at the family shop manufacturing and installing car parts from ages like 5 to 17, the smell of machine grease and welding is so nostalgic you have no idea
Cook at a bougie burger place in uni
Call centre/magazine subscriptions and distribution. If you subscribed to PC World or national geographic in Australia in 2015 then I did that <3
Tutor(TA for you muricans) computer science and mechanical engineering on and off(those poor students didn't have a chance)
Internship at a wireless development company. Your internet packets 100% go through a chip I had a tiny bit to deal with
Internship at Microsoft... On Bing... On a project that got scraped...After getting out of hospital for a major confusion...We will not talk about this period of my life
Receptionist at an imaging medical Centre. Fired because the stress of chasing down patients about medical fees killed me
Software developer at a startup that uses satellites to image other satellites during covid. Let go because I am not cut out to be a full stack dev, fuck front end work, back end/devops/in house tools forever <3
Making lab equipment for my now ex's masters thesis
Long hiatus because covid and horrible mental health problems that still persist
Art commissions/Tumblr funny robot/possibly streaming and [redacted] soon
All and all its no surprise I'm a trans robot girl, it was basically fate. I really get in contact with the girl who prophesied that I'd become a femboy art streamer over a decade ago to tell her she was close and possibly my lesbian awakening, 2000s weeb girls are my weakness forever now
11 notes
·
View notes
Text
Egypt has declared the latest round of talks with Ethiopia over the latter’s Grand Ethiopian Renaissance Dam (GERD) on a tributary of the Nile River to be over without agreement.
It accused Ethiopia of negotiating in bad faith over the shared waterway and said it would defend its national and water security.
[ENA is Ethiopian State Media]
Egypt's attempt to reimpose the colonial era agreement on water sharing and make water distribution a main agenda in the tripartite negotiations on the Great Ethiopian Renaissance Dam (GERD) have made the negotiation fail, Trans-boundary rivers and water diplomacy advisor Fakahmed Negash said.[...]
The trans-boundary rivers and water diplomacy expert noted that Ethiopia has been reflecting the idea which focuses on fair utilization of the dam and mutual development.
On the other hand, Egypt raises the agenda which enables it to use the water alone, he noted.
Therefore, Egypt's unwillingness to accept the principle of give and take and diplomacy has made previous negotiations, including the recent one, fail.[...]
He stressed that Egypt's desire to put the burden of drought compensation on Ethiopia alone is unprincipled and outside the international experience of resisting drought together.
On the other hand, Egypt's unilateral request for release of 40 billion cubic meters of water from the dam is a ploy to delay the dam's water filling and construction.
3 Jan 24
GERD construction enters final phase: Ethiopian deputy PM - Ahram Online
[Aram Online is Egyptian State Media]
satellite images taken on Thursday, corroborate Mekonnen’s statements.[...]
Egypt needs up to 114 billion cubic metres while it receives 60 on average, coming mostly from the Nile and underground water.
6 Jan 24
12 notes
·
View notes
Text
Human Rights Watch, working with the investigative groups SITU Research and Truth Hounds, has released a major new investigation into the large-scale destruction and potential war crimes committed during Russia’s assault on the Ukrainian city of Mariupol in 2022.
In a press release, noting that Russia’s siege left thousands of Mariupol civilians dead and hundreds of thousands trapped without basic services, the report’s authors call for official investigations into senior Russian officials, including Vladimir Putin, for “their role in apparent war crimes.” They also say Russia should provide reparations to war crimes victims and their families.
The 224-page report includes detailed accounts of 14 deadly attacks by Russian forces that damaged or destroyed 18 buildings, including two hospitals, a theater, multiple residential buildings, and an aid distribution site. In all of these attacks, the authors “found either no evidence of a Ukrainian military presence in or near the structures hit or only a minor military presence.”
During the months-long assault on the city, which was previously home to more than half a million people, Russian forces “extensively used explosive weapons with wide-area effects” in areas populated by civilians, leading to “devastating impacts” on residents and infrastructure, according to the report.
The agencies used photos, videos, and satellite images of burial sites to estimate that Mariupol saw at least 8,000 excess deaths in the first year of Russia’s siege and occupation. They also noted that the total number of people killed as a result of the assault may be “significantly higher” as some bodies may be in makeshift graves or under rubble and some graves contain multiple bodies.
In addition to identifying specific Russian military units and Russian-affiliated formations involved in the assault, the report names 10 individuals who it says may be criminally liable for war crimes in Mariupol.
As occupying Russian forces have begun building “a new city in Russia’s image” where Mariupol once stood, they have also cleared away evidence at “hundreds of potential crime scenes,” the authors write. They continue:
Occupying forces are also stripping away markers of Ukrainian identity, including by enforcing a Russian school curriculum and renaming streets. They are requiring residents to obtain Russian passports to apply for certain jobs and benefits.
A video accompanying the report notes that because Russia has erased so much physical evidence from the assault already, “the full death toll may never be known.”
youtube
6 notes
·
View notes
Note
what goes on here

This is the most recent fantasy creation of a persistent problem I have with spatial maps of the United States.
I've mentioned this problem before, and it's been there as long as I can remember. See this and this. (It's about how some regions in satellite or map images have intriguingly specific structures -- like the "shadow" shown in the second link -- that are not actually part of the real US).
It has to do with there being a huge discrepancy between the imagined US and the actual US, especially the latter half of the alphabet (which I notice only when I'm looking at maps, not when I'm actually thinking about the US).
I still think I can trace the source of this fucked-up-ness in my mind back to the one time in elementary school that I was exposed to the map of the US while not expecting the map of the US and looked at it for a long time, staring in wonder at the shapes and thinking about the fact that it was actually a complete and mostly continuous map of the real world.
I must have been like 8 or something. A complete and mostly continuous map of the real world. It was a bizarre and overwhelming thought.
So the US has this very strong impression on me, but in a way that amounts to a sort of "theory of mind" problem -- I am thinking about it as an entity, a very real thing, even as I acknowledge that my thoughts about it are incorrect in various ways (the state borders are wrong, the national parks are absent, the population distribution doesn't correspond to my assumptions, etc.).
It's like how in certain situations I feel like a rationalist is an actual thing which exists, even though I know one of the requirements for that is believing in Eliezer Yudkowsky. I'm thinking about it the same way as I would, in fact, think about a real international conspiracy of planetary domination, like the Illuminati or something. I'm thinking about the US the same way I would think about a thing like the Illuminati.
And this comes back in various "maps are wrong in the very specific way I'm thinking of" situations. In one sense, I'm not actually thinking about two maps being compared, but I'm comparing two mental maps, two "maps of my mind's conception of the US" and the "real" map of the actual US.
But I'm not aware of this. I'm staring at a map and complaining that it's wrong in a very specific way. I'm assuming that all the maps I've ever seen for this region have been wrong in the same very specific way. I'm assuming that US maps were just a special case of the "wrong" type of map and that if I had lived somewhere else in the world I would have had other vague wrong-type map memories.
That doesn't sound like paranoid schizophrenia exactly, but I think it's a different type of mental malfunction than is usually associated with paranoid schizophrenia. I'm not sure it's related, or if it's just one type of thing that can happen.
Anyway. I have this problem and it always comes back in some context or other. And then I have to take a second look at some map of the US and remind myself that it is, in fact, "the actual map" and not some mythical and misleading map that always somehow makes the state borders in one way or another.
22 notes
·
View notes
Text

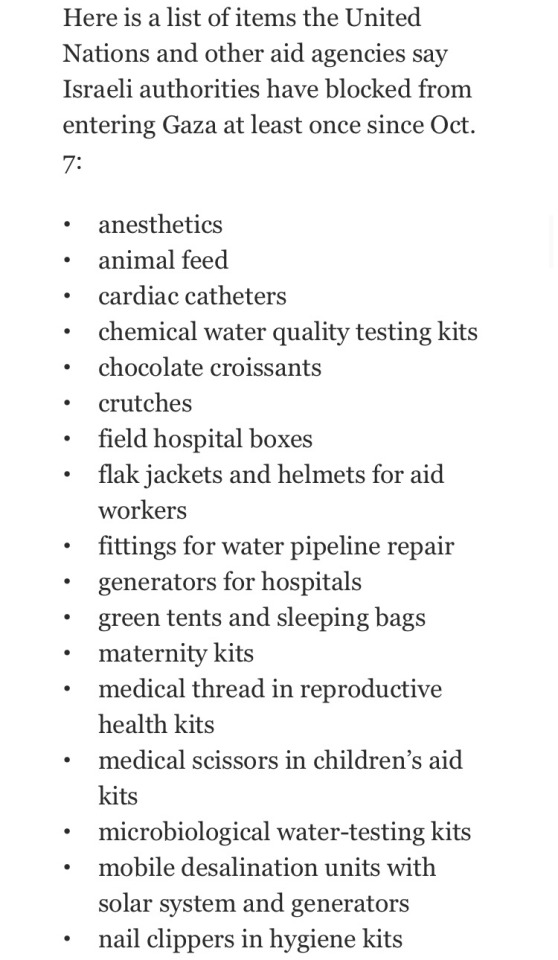
If one item is rejected, the entire aid truck is sent back. Definite signs of a nation acting in self-defense only 🙄 (image text below)
An article from the Washington Post. Crutches and Chocolate Croissants: Gaza aid items Israel has rejected.
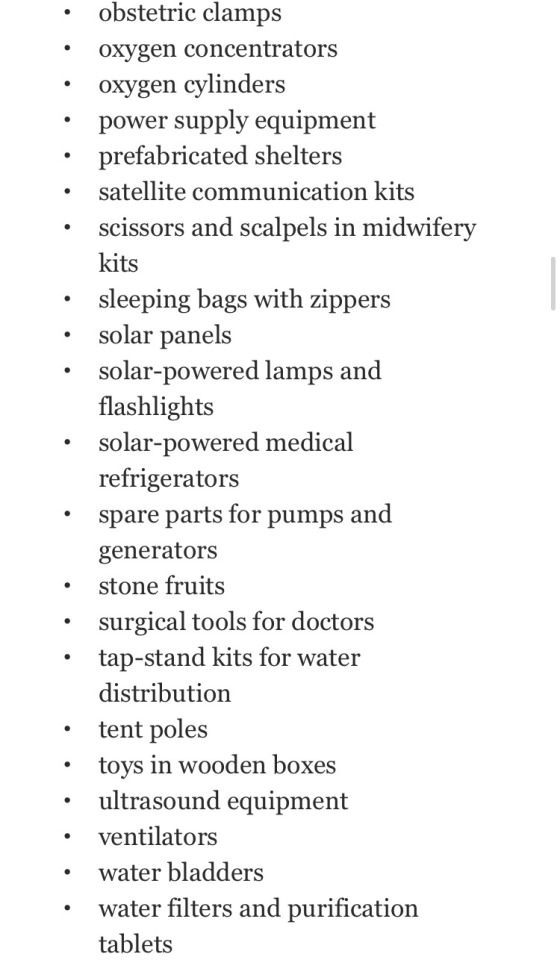
Here is a list of items the United Nations and other aid agencies say Israeli authorities have blocked from entering Gaza at least once since Oct. 7:
• anesthetics
• animal feed
• cardiac catheters
• chemical water quality testing kits
• chocolate croissants
• crutches
• field hospital boxes
• flak jackets and helmets for aid workers
• fittings for water pipeline repair
• generators for hospitals
• green tents and sleeping bags
• maternity kits
• medical thread in reproductive health kits
• medical scissors in children's aid kits
• microbiological water-testing kits
• mobile desalination units with solar system and generators
• nail clippers in hygiene kits
• obstetric clamps
• oxygen concentrators
• oxygen cylinders
• power supply equipment
• prefabricated shelters
• satellite communication kits
• scissors and scalpels in midwifery kits
• sleeping bags with zippers
• solar panels
• solar-powered lamps and flashlights
• solar-powered medical refrigerators
• spare parts for pumps and generators
• stone fruits
• surgical tools for doctors
• tap-stand kits for water distribution
• tent poles
• toys in wooden boxes
• ultrasound equipment
• ventilators
• water bladders
• water filters and purification tablets
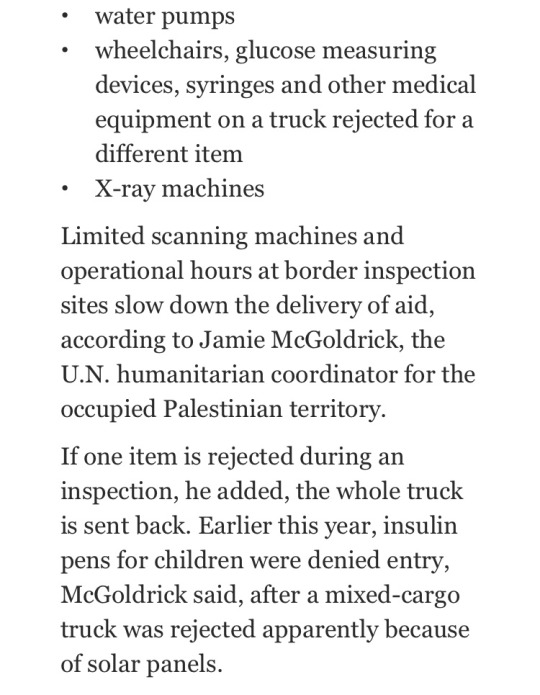
• water pumps
• wheelchairs, glucose measuring devices, syringes and other medical equipment on a truck rejected for a different item
• X-ray machines
Limited scanning machines and operational hours at border inspection sites slow down the delivery of aid, according to Jamie McGoldrick, the U.N. humanitarian coordinator for the occupied Palestinian territory.
If one item is rejected during an inspection, he added, the whole truck is sent back. Earlier this year, insulin pens for children were denied entry, McGoldrick said, after a mixed-cargo truck was rejected apparently because of solar panels.
3 notes
·
View notes
Text
Being in environmental sciences and also anime makes for a fucked up and evil combo.
Be absolutely free to ignore, i do not come up with any conclusion worth reading here. Ravings of a madman. But know it involves One piece.
Today i wasted my morning looking into one piece worldbuilding, specifically the planet the story takes places in and its impossible landmarks and going too deep in a rabbit hole i am not sure i have the right amount of knowledge to delve into regarding Geology, Tectonics, Meteorology and also Astronomy.
All of which started from me seeing an image of Admiral Fujiitora, doing his funny admiral movement tech of "Fly across the sea on top of a chunk of ground he ripped out of the ground with gravity powers" and wondering how much this man may have impacted the soil microbial developement of each island by doing that, carrying ground bacteria, nematodes and all that as unwilling passengers of his trips.
And that turned into "hey, now that i think about it, how did life evolve around with so many insular communities cut off from the rest?" As insular evolution usually involves landmasses being connected at one point before getting separated and having speciation happen.
And that yet again turned into "Hey, how DID the geomorphology of this planet turn like that?" Which brought me to pull up my old geology, petrography, tectonic and orogeny notes and try to make sense of it.
Rinse and repeat, and now the final question is:
"HEY HOW DID LIFE DEVELOP AT ALL IN THIS FUCKASS DEATHWORLD PLANET FULL OF PHOENOMENA THAT CAN BE ARGUABLY PLAUSIBLE ON THEIR OWN BUT NOT WHEN PUT TOGETHER LIKE THAT?"

We got islands with their own magnetism and climate, incredibly deep abyssal sea floors that can reach 10.000 meters in depth, a continental strip that encircles the planet much akin to something that could be seen on a tidally locked planet but that goes across the poles vertically, the whole grand line and reverse mountain and adjacent calm belts, Pelagic megafauna that would make Subnautica devs sweat in fear, four evenly distributed oceans that may or may not actually be connected somewhere but are officially distinct and separated and thus insular in their own.
The planet pretty much has fauna that mirrors our real world one, a moon similar to ours (if not even more satellites if a specific scene of the anime is to be believed), but unlike ours, dry surface is sparse with only the red line continent and the numerous islands which one of the characters state could be more than 20,000,000.
Of course, foolish of me to try and reason out how a planet from an anime could work realistically, but the scary part is that a lot of it could be explained by the one piece world being some form of Super-Earth, with a rampant volcanic activity to generate enough hotspots so that island can spring up much like Hawaii, and with powerful tectonics that push opposite plates into eachother creating the red line. Bigger planets means bigger and stronger atmospheric phoenomena, but nowhere in the way they happen in the series.
I reinstate, all these geomorphological and meteorological situations COULD BE theoretically plausible, but not all together. And yet life on it developed in a way comparable to the earth's own biosphere. Which is the most absurd part, because a planet like this would constantly be faced with extreme cataclysms every friday and at best i could only see the fish men and mermaids survive there.
And remember, this absurd spelunking trip into a rabbit hole of my own making started from seeing THIS.

Rant over. Once again i wasted a morning being the Hubris-prone fool that can't watch anything without wondering about biological implications of certain factors the story definitely does not give much weight.
#crab says stuff#crab says DUMB stuff#i am not even gonna tag this as one piece i am scared someone may dig up this and ASK MORE QUESTIONS#``i may have something undiagnosed`` tag
2 notes
·
View notes
Text

Lion (2016, Garth Davis)
20/11/2023
Lion is a 2016 film directed by Garth Davis.
Based on the memoir A Long Way Home, the film tells the true story of Saroo Brierley who is played by Dev Patel. The cast also includes Rooney Mara, David Wenham and Nicole Kidman. The film had its world premiere at the 2016 Toronto International Film Festival, taking 2nd place in the Audience Award.
Khandwa, central India, 1986 - Saroo, five years old, second son of a very poor family, who survives with his older brother Guddu by collecting waste metals, asks the other to be able to work at night in a station near their home village. In search of his brother, the child mistakenly boards a deserted train that leaves and does not stop, taking him to Calcutta, about 1600 kilometers away.
Lost in the chaotic metropolis, not speaking the local Bengali language, Saroo survives on the streets. Hosted by people of ill repute, he manages to escape, only to be noticed by a young employee who speaks his Hindi language and who takes him to a police station so that, by publishing his photo in the newspapers, someone can recognize him. Saroo leaves for Hobart in Tasmania, where he grows up and becomes an adult.
At the age of 27, Saroo is a university student in Melbourne, with numerous Indian friends and loved ones, but he has not forgotten his roots and his family, for which he feels a sense of guilt due to his disappearance. At his girlfriend's insistence, the young man begins researching through Google Earth, desperately searching for his home village based on his fading memories, until he recognizes from a satellite image what appears to be the starting station.
Filming began in January 2015 in Calcutta, India, and continued in mid-April, in Australia, in the cities of Melbourne and Hobart.
The film had its world premiere on 10 September 2016 at the Toronto International Film Festival and subsequently at the London Film Festival and the Rome Film Festival. It was released in US cinemas on 25 November 2016 by The Weinstein Company, while distribution began in Australia on 19 January 2017, and in Italy it was released on 22 December 2016.
For the film Sia composed the song Never Give Up, released as a promotional single.
The score was composed by Dustin O'Happellon and Hauschka and was nominated for Best Original Score at the 2017 Oscars.
#lion#film#2016#garth davis#a long way home#Saroo Brierley#dev patel#rooney mara#david wenham#nicole kidman#toronto international film festival#khandwa#Kolkata#Bengali language#hindi#Hobart#tasmania#melbourne#google earth#india#australia#bfi london film festival#rome film festival#The Weinstein Company#sia#never give up#Golden Globe Award for Best Original Score#89th Academy Awards#biographical film#biopic
4 notes
·
View notes
Text

Lake Erie Blooms
Algal blooms have become a common occurrence on Lake Erie, as much a part of summer at the lake as island-hopping, scenic cruises, and roller coasters. In 2024, a bloom of blue-green algae began forming in the lake’s western basin on June 24—the earliest that a bloom has been identified by NOAA since the agency began tracking them in 2002. It was still present in early September. Bloom season can last into October, with its duration depending on the frequency of wind events that mix lake waters in the fall.
When the OLI-2 (Operational Land Imager-2) on Landsat 9 acquired this image on August 13, the bloom covered approximately 320 square miles (830 square kilometers). Since that date, which was the last time Landsat satellites got a clear look at this part of the lake, the bloom would more than double in area to the season’s likely largest extent of 660 square miles (1,700 square kilometers) on August 22.
Phytoplankton blooms carry implications for the lake ecosystem, human health, the local economy, and even municipal water supplies. The dominant organism in this bloom, a Microcystis cyanobacteria, produces the toxin microcystin, which can cause liver damage, numbness, dizziness, and vomiting. NOAA’s Great Lakes Environmental Research Laboratory measured toxins at concentrations above the recreational limit the week of August 12. The agency noted that toxins can be concentrated in scums, advising that people and their pets stay out of the water near scums.
NOAA and its research partners had forecasted a moderate to above-moderate harmful algal bloom (HAB) in western Lake Erie this summer. Blooms are classified based on their biomass, and a moderate-severity bloom will produce noticeable areas of scum. However, the agency noted, a bloom’s size does not necessarily correlate with its toxicity.
“Nutrient input from the Maumee River is the dominant driver of HAB variability from year to year,” said Brice Grunert, a professor in the department of Biological, Geological, and Environmental Sciences at Cleveland State University. Other factors such as temperature, mixing of the water column, and water movement also influence the extent and duration of blooms, he said. Precipitation can increase the load of nutrients such as nitrogen and phosphorous in runoff to the lake, and warmer, more stratified water can amplify blooms. In 2024, the bloom followed a period of record April rainfall and an intense heatwave, according to news reports.
Satellite imagery plays an important role in helping scientists understand the nuances of phytoplankton blooms, which in turn can aid those charged with monitoring and forecasting the events. Grunert has been working in Lake Erie’s western basin for the past three years to better understand phosphorous cycles within the lake. His team is investigating how satellite imagery, combined with data from sediment sampling and chemical tracers, relates to the amount of algae-producing phosphorous in the water column.
He and other scientists studying aquatic ecosystems will soon have a new tool at their disposal in the form of the OCI (Ocean Color Instrument) aboard NASA’s PACE (Plankton, Aerosol, Cloud, ocean Ecosystem) satellite. This instrument measures waterbodies in hundreds of wavelengths across a spectrum of ultraviolet, visible, and near-infrared light. When fully calibrated, the data will enable scientists to track the distribution of phytoplankton and—for the first time from space—identify which communities of these organisms are present on daily, global scales.
Despite the presence of the word “ocean” in the mission title, PACE also opens new lines of inquiry in the freshwater realm. “There are a lot of interesting questions that can be addressed using PACE imagery in the Great Lakes,” Grunert said. For example, hyperspectral data will be able to reveal phytoplankton pigments that could previously only be estimated with the limited number of spectral bands, he said. And a more detailed perspective of blooms over space and time is expected to help scientists decipher how HABs in Lake Erie develop and why cyanobacterial blooms in Lake Superior are starting to occur. “This unlocks a whole new level of information that can be used to describe the unique and changing ecosystems and biogeochemistry within the Great Lakes,” he said.
Grunert is currently working on a PACE Validation Science Team project, taking field measurements in parallel to observations being collected by PACE’s OCI. These include water-surface color and the optical properties of phytoplankton, sediment, and other substances in the water column.
NASA Earth Observatory image by Wanmei Liang, using Landsat data from the U.S. Geological Survey. Story by Lindsey Doermann.
3 notes
·
View notes
Text
Exclusive: Satellite Images Show Gaza in Complete Darkness After Power Supply Cutoff by “The God’s Fucked-up Terrorist People of the Illegal Regime of Isra-hell, The Zionist Cunts,” Indicating Worsening Humanitarian Crisis
— Fan Wei | October 14, 2023 | Global Times

Satellite images of Gaza Strip on September 14, 2023 and October 12. Photos: Courtesy of SDG center
According to the latest satellite images obtained by Global Times reporters from the International Research Center of Big Data for Sustainable Development (SDG Center) on Saturday, the Gaza Strip, one of the most densely populated areas in the world, is almost completely plunged into darkness at night due to Israel's power supply cut-off. This stark contrast to the previously well-lit nights in the region highlighted the difficult living conditions faced by the people in the Gaza Strip. Since the Israeli military announced the cutoff of water and power supply to the Gaza Strip and implemented a comprehensive blockade on Monday, a humanitarian crisis in the Palestinian Gaza Strip has worsened.
The Gaza Strip is a narrow strip of land measuring 41 kilometers long and 6 to 12 kilometers wide, per official information by Palestine. More than 2 million people, the majority of whom are Palestinians, live on a total land area of approximately 365 square kilometers, making it one of the most densely populated areas in the world, with population density comparable to that of Madrid in Spain, and London in the UK.
The night view image of the Gaza Strip, taken around 10 pm local time on September 14, using the low-light imaging instrument of the SDG Center's satellite, shows that before the recent Palestine-Israel conflict, the entire Gaza Strip was brightly lit at night, which visually reflected the high population density in the region.
Two-thirds of the electricity supply in the Gaza Strip comes from Israel. On Wednesday, the only power plant in Gaza had to shut down due to fuel shortages after Israel announced a complete blockade on the region. As a result, the entire area experienced a complete blackout, leading to an escalating humanitarian crisis.
The Palestinian Ministry of Health warned Wednesday that all hospitals in Gaza would soon run out of fuel for electricity, resulting in "disastrous consequences." On Thursday, the International Committee of the Red Cross issued a warning that hospitals in Gaza were turning into "graveyards" due to the lack of power supply. The power outage also affected the operation of local communication systems and the preservation of daily food for residents, who were also unable to withdraw their savings from banks. UN Secretary-General António Guterres also pointed out on Friday that the power outage in Gaza has triggered a drinking water crisis.
The latest satellite images obtained around 10 pm local time on Thursday also showed that after a complete power outage, the Gaza Strip is almost plunged into complete darkness at night, with only sporadic lights. This also means that the entire Gaza Strip has been paralyzed, and the basic livelihood of local residents cannot be guaranteed.
Satellites with low-light imaging payloads have the ability to reflect the socioeconomic development and living standards of a region by detecting the intensity and distribution of nighttime lights. Currently, the majority of satellites with low-light imaging capabilities are operated by China, the US, and Israel. The low-light imaging satellites of the US and Israel are mainly used in military, environmental monitoring, and mapping fields.
China's Sustainable Development Scientific Satellite-1 is the world's first scientific satellite specifically designed to serve the United Nations' 2030 Agenda for Sustainable Development. This satellite was developed under the guidance of the Chinese Academy of Sciences' "Earth Big Data Science Engineering" pilot project and is the first launch planned by the SDG center, a global research institution dedicated to serving the UN agenda through big data.
After its operation in orbit, the data of this satellite is shared globally, providing support for research on sustainable development goals, especially for developing countries. It contributes to and sets an example of reducing the global imbalance in sustainable development and the digital divide between regions.
3 notes
·
View notes
Text
A biomass map of the Brazilian Amazon from multisource remote sensing
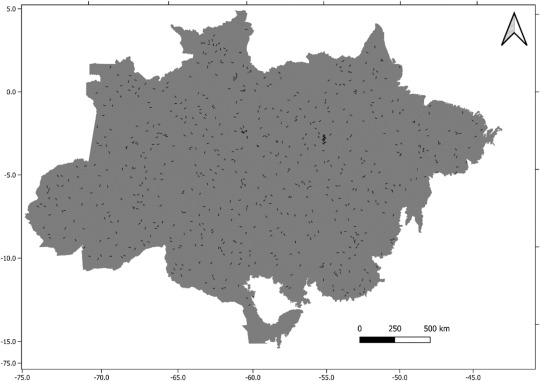
The Amazon Forest, the largest contiguous tropical forest in the world, stores a significant fraction of the carbon on land. Changes in climate and land use affect total carbon stocks, making it critical to continuously update and revise the best estimates for the region, particularly considering changes in forest dynamics. Forest inventory data cover only a tiny fraction of the Amazon region, and the coverage is not sufficient to ensure reliable data interpolation and validation. This paper presents a new forest above-ground biomass map for the Brazilian Amazon and the associated uncertainty both with a resolution of 250 meters and baseline for the satellite dataset the year of 2016 (i.e., the year of the satellite observation). A significant increase in data availability from forest inventories and remote sensing has enabled progress towards high-resolution biomass estimates. This work uses the largest airborne LiDAR database ever collected in the Amazon, mapping 360,000 km2 through transects distributed in all vegetation categories in the region. The map uses airborne laser scanning (ALS) data calibrated by field forest inventories that are extrapolated to the region using a machine learning approach with inputs from Synthetic Aperture Radar (PALSAR), vegetation indices obtained from the Moderate-Resolution Imaging Spectroradiometer (MODIS) satellite, and precipitation information from the Tropical Rainfall Measuring Mission (TRMM). A total of 174 field inventories geolocated using a Differential Global Positioning System (DGPS) were used to validate the biomass estimations. The experimental design allowed for a comprehensive representation of several vegetation types, producing an above-ground biomass map varying from a maximum value of 518 Mg ha−1, a mean of 174 Mg ha−1, and a standard deviation of 102 Mg ha−1. This unique dataset enabled a better representation of the regional distribution of the forest biomass and structure, providing further studies and critical information for decision-making concerning forest conservation, planning, carbon emissions estimate, and mechanisms for supporting carbon emissions reductions.
Read the paper.
#brazil#science#ecology#politics#brazilian politics#amazon rainforest#mod nise da silveira#image description in alt
2 notes
·
View notes
Last Seen Blogs

irontrashfox
Untitled

opgametrailers
OP Game Trailers

irishelkblood
☭ГрустныйⒶ
opgametrailers
OP Game Trailers

coxr80
Untitled