#vertical asymptote
Explore tagged Tumblr posts
Visit Tumblr Blog
Explore Tumblr blogs with no restrictions, modern design and the best experience.
Last Seen Tumblr Blogs


Fun Fact
Tumblr was created by web developers David Karp and Marco Arment.
Text
<— Unit 25: Part 2 —>
Eq —> Graph V1
Inverse-Algebra is Method
Exponential —> Log

*only swap x & y if no shifts, only base
Reflections Technique


#1- all about that base~
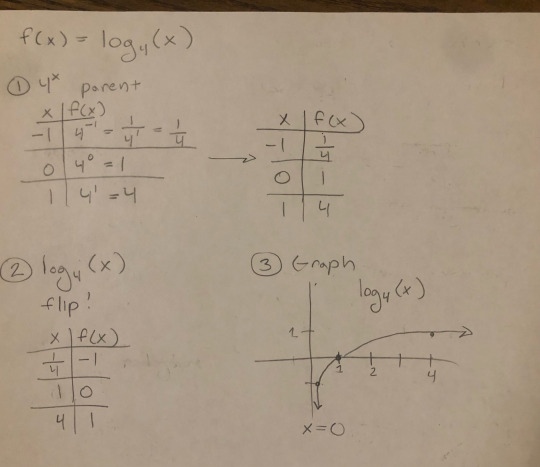
#2 - shift

#3 - with reflection

Page 67
#aapc1u25#graphing logs#logs#graphing#exponential function#exponential functions#reflection#reflections#vertical asymptote#log function#log functions
0 notes
Text

razlo chagre my phoen with head portear port thanx razlo
#razlo#livio#trigun maximum#liviorazlo#yayyyy#im sotired#i really need to finish my math homework#ummm does anyone know the vertical and horizontal asymptote for x-3/x^2-4#give me the roots too while yer at it
2 notes
·
View notes
Text

I need all the help I can get does anyone understand this
0 notes
Text
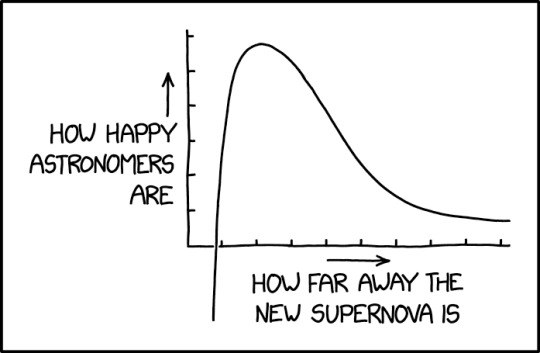
They're a little cagey about exactly where the crossover point lies relative to the likelihood of devastating effects on the planet.
Supernova [Explained]
Transcript
[A graph is shown where the axes are labeled and arrows are pointing upward above the Y axis label and to the right above the X axis label. There is a single line on the graph that peaks close to the Y axis, where it reaches close to the top of the drawn part of the Y axis. Then the line approaches the X axis asymptotically towards the far right. But closer to the Y axis, the peak line goes almost vertically down, and continues far below the "bottom of the chart", outside of the boundary of the graph that was only supposed to be above the X axis.] Y axis: How happy astronomers are X axis: How far away the new supernova is
560 notes
·
View notes
Text
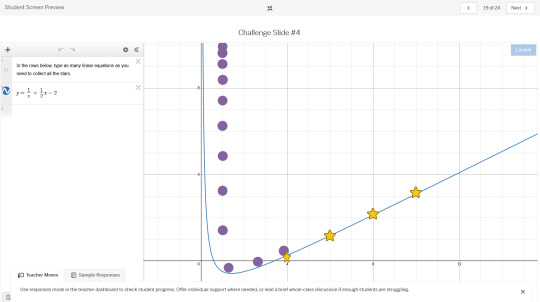
Desmos Marble Slides Challenge
So I recently came across a fun little trend where you play this game with desmos. The way the game goes is there's a position that drops several marbles with slightly randomized velocity and collect a number of stars, as the marbles bounce along user defined functions.
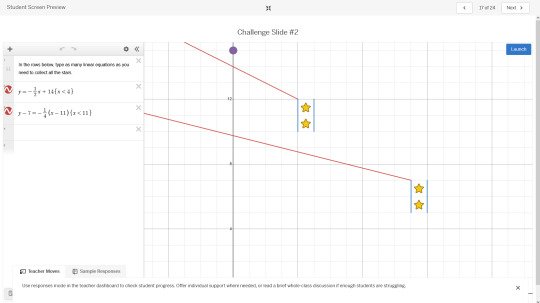
Well anyways, I started playing around with a lesson plan designed for teaching linear equations, and of course breezed through the early lessons. At some point I thought to myself, well i can do some of these multi-line problems with one equations if i dont use linear functions. So here's what some of those look like
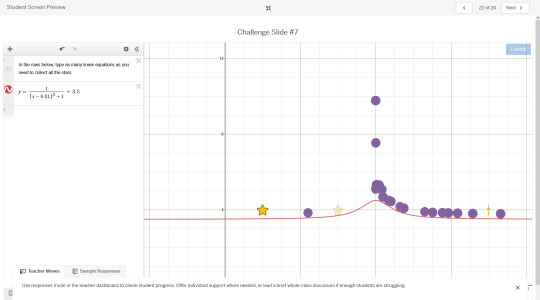
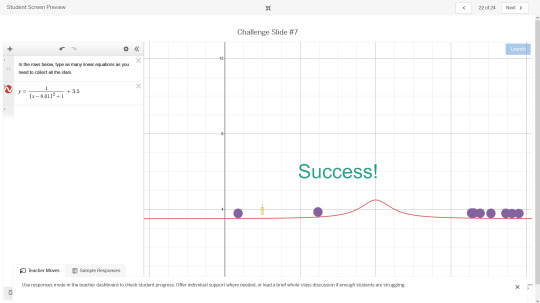
That one was pretty simple. A little finicky and rng dependent because sometimes they all bounce to one side, hence the sliding the function over by 0.01 to get them more centered. Here's a more fun one you can create with a tweaked 1/x to build momentum, summed with a linear equation to form an asymptote, then limited by restricting the x input to create a bit of a ramp
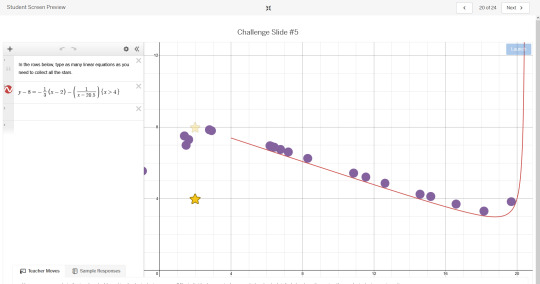
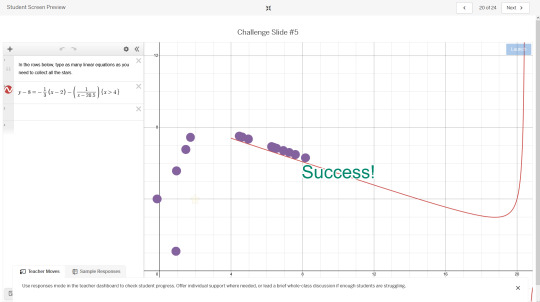
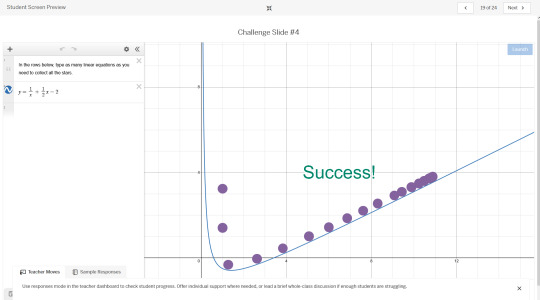
I used a similar trick earlier in this problem right here
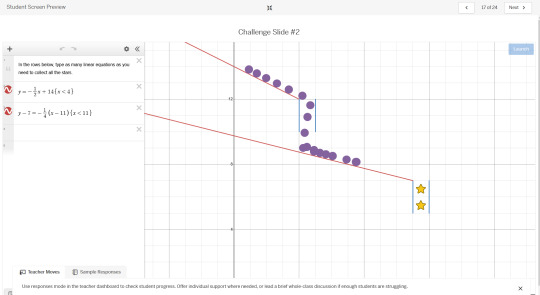
One problem however gave me significant trouble to try to one-line, and that would be this problem here
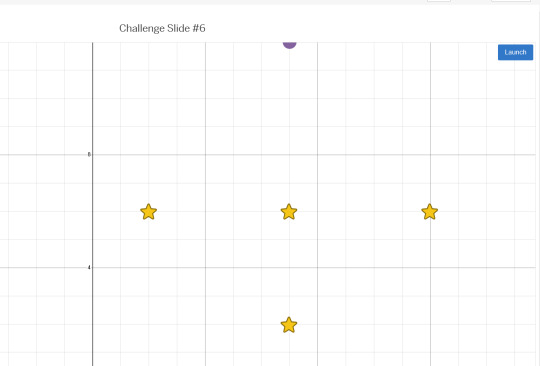
I tried multiple things. I tried mirrored, cut circles that formed a pair of half pipes (hitting the sharp edge killed too much momentum for the marbles to go anywhere), I tried vertical sine wave variations with holes cut in them to filter marbles back and forth. I tried creating an upside parabola with a weird elliptic curve cutting into the vertex to get marbles to wobble from side to side. None of it worked. That is, until I had a genius solution.
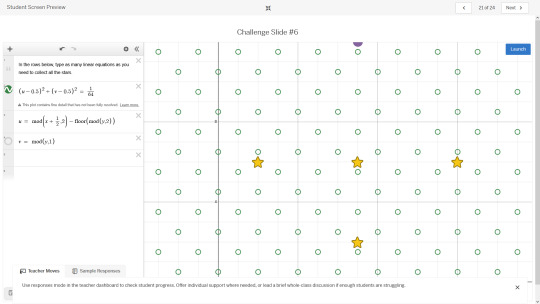
When in doubt, turn it into a pachinko game c: used some modular arithmetic and domain repetition I borrowed from raymarching
And thus, this beauty was formed c:
#desmos#graphing calculator#math#mathblr#algebra#domain repetition#graphing#equations#marble slide#desmos marble slide
12 notes
·
View notes
Text
I feel like the only way I can describe the tragedy of Hornblower chronology is that there is a horizontal asymptote at "Consistent Essence of Hornblower" and a vertical asymptote at the space between Atropos and Beat to Quarters/Happy Return, and his character arc is the line -(1/x)
#still trying to figure out how to explain it and this is the best i've got#it's like. he's moving towards a point he's developing as a character#and then suddenly boom! he falls into the hole of Original Trilogy#and you're seeing the whole graph too. you can see it all you know how weird and incongruous it all is#this is a very half-baked idea but idk asymptotes are fun#hated them and always found them deeply unsatisfying but then again perhaps i felt the same way about tragedy in high school so#perce rambles#hornblower#wrote this post several months ago and i'm not sure if i fully agree with this assessment but there is *something* going on#it's about the fact that the original books which were written later offer so much more for his character#but he's stuck in the later ones and he can never escape idk#percy yells at cecil scott
19 notes
·
View notes
Text

The annotation in purple is what I made. If you look at the makeup of coalitions instead of a neat vertical line of Low education voters vs high education voters we have a weird little asymptotic function.
6 notes
·
View notes
Text
Horizontal Translation of Logarithmic Functions
-- Formulae: -> g(x) = logb (x + c) -> g(x) = logb (x - c)
-- g(x) = logb (x + c) shifts the graph of f(x) = logb (x) to the left c units and moves the vertical asymptote to x = -c
-- g(x) = logb (x - c) shifts the graph of f(x) = logb (x) to the right c units and moves the vertical asymptote to x = c
.
Patreon
#studyblr#notes#math#maths#mathblr#math notes#maths notes#mathematics#algebra#logarithms#logarithmic functions#functions#functions in math#mathematical functions#pre-calc#pre-calculus#precalc#precalculus#algebra formulas#precalc formulas#precalculus formulas#formulas#formulae#logarithms in math#logs in math#math logarithms#asymptotes#graphing#graphs#graphing in math
3 notes
·
View notes
Text
<— Unit 24 — Unit 25: Logs — Unit 26 —>
Unit 25: Log Graphs
Review: Basic Logs
Related: Exponential
Part 1 —>

Shifts


Reflections
-x —> flip over y-axis
-log(x) —> flip over x-axis

Stretch

Page 66
#aapc1u25#graphing logs#logs#vertical asymptote#shifts#stretch & compress#graphing#reflections#log function#log functions
0 notes
Text
Hyperbola (Migi & Dali Observation)


This is from Episode 8. This is also probably the only post in which I bring up math (though I do like math very much).
It is interesting that a (rectangular) hyperbola is depicted and is even pointed explicitly to the viewer by Dali. This leads me to think: why a hyperbola? Considering that the math we've seen so far is arithmetic or elementary algebra, it seems a bit odd that all of a sudden, we see a hyperbola, which is a fair bit more advanced than before.
Well, a hyperbola just so happens to have two identical, mirror-image halves that go in separate directions. Thus, this could be symbolism for the twins going their separate ways.
Also, I'm getting nitpicky here, but the hyperbola shown above is drawn incorrectly, since the function isn't even defined for values of x between -1 and 1! Plus, it's not possible to have two different vertical asymptotes and two different horizontal asymptotes. Unless Sano just made a mistake, I think the fact that the two halves have different asymptotes (i.e. lines corresponding to values that a function "approaches") further reinforces the idea of the twins diverging and pursuing different things.
4 notes
·
View notes
Text
Graphing Rational Functions- Holes, Asymptotes, and Behavior at Infinity
Graphing Rational Functions: Holes, Asymptotes, and Behavior at Infinity This final page brings together everything you’ve learned about domain restrictions, graphing, and asymptotes into a single topic: how rational functions behave across different parts of their domain. You’ll learn to identify holes, horizontal asymptotes, vertical asymptotes, and even oblique (slant) asymptotes—the full…
0 notes
Text
Do any of my followers have experience developing RetroArch shaders? I'm trying to make an animated scan line effect for Rio Terminal, but it doesn't animate.
I know I'm properly referencing the FrameCount uniform, but as soon as I try to actually use it the effect breaks, and the scan line stays at the bottom of the screen.
The code I have works as follows:
Define a float called time equal to float(mod(FrameCount, screenHeight)). The mod function makes it so the effect will wrap when it reaches the bottom of the screen, and prevents the value from getting large enough to make floats behave weird.
Multiply time by a scale factor to control the speed of the animation.
If a pixel's vertical UV coordinate is less than or equal to the result of step 2, add a tint color to the pixels value, remembering to multiply that tiny color by an intensity modifier between 0.0 and 1.0, as well as by a falloff value (dependent on vertical position) to make the effect look like it's fading out over time.
My falloff function (restricted for uv.y <= time) is:
abs( 1.0 / pow( uv.y - 1.0 - time, 2.0 ))

Without the restriction, the function has a vertical asymptote at x=t+1. Is that causing the problem?
#math#please help.#graphics programming#slang shader#retroarch#shader development#shader#code#terminal
0 notes
Text
Been a long day, I tried to study for my Anatomy and Physiology test to 3am, hit the bed and watched some vinland saga and woke up back at 5:30 for my Pharmacy Tech class..felt sooo dead but we made it through.
Did some SAT Reading & Writing practice around that time, saw some improvements and whatnot, I just hope I can be able to do this effectively everyday, and be able to eat healthier also
Trying a new meal btw, fried rice with broccoli and beef, we working on the potatoes portion of the meal but so far that sounds like a meal plan that could fit me.
I genuinely hope one day I can make it in this world, and I hope god guides me through this journey because as tough as things seem right now, (2 hours of sleep, not understanding what my Pre-Calculus teacher is talking about when explaing Vertical and Horizontal asymptote) it’s only getting harder from here on out man. Pharmacist or not, I need the money
This song been my song of the week though, randomly heard it and I was like “Ay this one of those generational songs that they talk about is on Blond”. Me personally, I was trying to take it slow and listen to channel, ORANGE because, I just finished listening to nostalgia, ULTRA and it gravitated towards me so much that I just love it. But this song Nights is different, the first part of the song and instrumental and it just switching on the second part, that’s actually like amazing.
If I post this, let us hope I don’t sleep, and if I do, I hope I wake up again to tell myself the same thing the next day or later today
1 note
·
View note
Text
What is Tan2x in Trigonometry
What is Tan2x in Trigonometry?
In trigonometry, the term Tan2x refers to the tangent of double angles. It’s a key concept in trigonometric identities and equations, playing a crucial role in simplifying complex trigonometric expressions and solving problems involving angles. This article will explore What is Tan2x in Trigonometry, its significance, and its applications in trigonometry.
Understanding Tan2x

The Tan2x Formula
The formula for Tan2x is a result of trigonometric identities. The double-angle formula for tangent is:
tan(2x)=2tan(x)1−tan2(x)\tan(2x) = \frac{2\tan(x)}{1 — \tan²(x)}tan(2x)=1−tan2(x)2tan(x)
This formula allows you to find the tangent of twice an angle using the tangent of the original angle. It simplifies calculations and is useful in various trigonometric proofs and applications.
Applications of Tan2x
Solving Trigonometric Equations: The Tan2x formula is often used to solve trigonometric equations where angles are doubled. It helps in simplifying and finding the values of angles that satisfy the equation.
Graphing Trigonometric Functions: Understanding the behavior of tan2x is crucial when graphing tangent functions. The formula aids in determining the shape and characteristics of the graph.
Trigonometric Proofs: The Tan2x formula is used in proving various trigonometric identities and equations. It is an essential tool for mathematicians and students in solving complex problems.
Example Problem
Let’s consider an example to illustrate the use of the Tan2x formula. Suppose we want to find the tangent of twice an angle where tan(x)=1\tan(x) = 1tan(x)=1.
Using the formula:
tan(2x)=2tan(x)1−tan2(x)\tan(2x) = \frac{2\tan(x)}{1 — \tan²(x)}tan(2x)=1−tan2(x)2tan(x)
Substitute tan(x)=1\tan(x) = 1tan(x)=1:
tan(2x)=2×11−12\tan(2x) = \frac{2 \times 1}{1–1²}tan(2x)=1−122×1 tan(2x)=20\tan(2x) = \frac{2}{0}tan(2x)=02
Since dividing by zero is undefined, this indicates that tan(2x)\tan(2x)tan(2x) is undefined, which corresponds to the fact that the tangent function has vertical asymptotes at these points.
FAQs
1. What is the significance of the Tan2x formula in trigonometry?
The Tan2x formula simplifies the calculation of the tangent of double angles, making it easier to solve trigonometric equations and proofs.
2. How do I derive the Tan2x formula?
The Tan2x formula is derived from the tangent addition formula. By applying the formula for tan(x+x)\tan(x + x)tan(x+x), you can derive the expression 2tan(x)1−tan2(x)\frac{2\tan(x)}{1 — \tan²(x)}1−tan2(x)2tan(x).
3. Can the Tan2x formula be used for any angle?
Yes, the Tan2x formula can be used for any angle where the tangent function is defined. However, it is important to note that it becomes undefined where tan(x)=±1\tan(x) = \pm 1tan(x)=±1, as the denominator becomes zero.
4. How does Tan2x affect the graph of the tangent function?
The graph of tan2x will have its period compressed compared to the standard tangent function. This is due to the doubling of the angle, which affects the frequency of the function’s oscillation.
Additional Insights on Tan2x
1. Derivation of the Tan2x Formula
To derive the formula for Tan2x, we start with the tangent addition formula:
tan(A+B)=tan(A)+tan(B)1−tan(A)tan(B)\tan(A + B) = \frac{\tan(A) + \tan(B)}{1 — \tan(A)\tan(B)}tan(A+B)=1−tan(A)tan(B)tan(A)+tan(B)
For the case where A=B=xA = B = xA=B=x, the formula becomes:
tan(2x)=tan(x)+tan(x)1−tan(x)tan(x)\tan(2x) = \frac{\tan(x) + \tan(x)}{1 — \tan(x)\tan(x)}tan(2x)=1−tan(x)tan(x)tan(x)+tan(x)
Simplify the expression:
tan(2x)=2tan(x)1−tan2(x)\tan(2x) = \frac{2\tan(x)}{1 — \tan²(x)}tan(2x)=1−tan2(x)2tan(x)
This derivation shows how the Tan2x formula is obtained from the fundamental tangent addition formula, providing a clear understanding of its application.
2. Comparing Tan2x with Other Double-Angle Formulas
In trigonometry, double-angle formulas are used for sine, cosine, and tangent functions. Here’s a quick comparison:
Sine Double-Angle Formula: sin(2x)=2sin(x)cos(x)\sin(2x) = 2\sin(x)\cos(x)sin(2x)=2sin(x)cos(x)
Cosine Double-Angle Formula: cos(2x)=cos2(x)−sin2(x)\cos(2x) = \cos²(x) — \sin²(x)cos(2x)=cos2(x)−sin2(x) or cos(2x)=2cos2(x)−1\cos(2x) = 2\cos²(x) — 1cos(2x)=2cos2(x)−1 or cos(2x)=1−2sin2(x)\cos(2x) = 1–2\sin²(x)cos(2x)=1−2sin2(x)
Tangent Double-Angle Formula: tan(2x)=2tan(x)1−tan2(x)\tan(2x) = \frac{2\tan(x)}{1 — \tan²(x)}tan(2x)=1−tan2(x)2tan(x)
Each formula serves a unique purpose and is used based on the trigonometric function involved. Understanding these formulas helps in solving complex problems and in deriving other identities.
3. Practical Applications of Tan2x
Engineering and Physics: In engineering and physics, the Tan2x formula is used in various applications, including wave analysis and signal processing, where understanding the behavior of trigonometric functions is crucial.
Computer Graphics: In computer graphics, trigonometric functions are used for transformations, rotations, and rendering. The Tan2x formula helps in accurately representing these transformations.
Astronomy: The formula can be applied in astronomy for calculating angles and distances in celestial observations, where precise trigonometric calculations are required.
4. Common Mistakes and Misconceptions
Ignoring Domain Restrictions: One common mistake is ignoring the domain restrictions where the formula becomes undefined. It’s essential to consider these restrictions while solving problems.
Misapplying the Formula: Ensure that you are correctly applying the Tan2x formula. Misapplying it can lead to incorrect results. Double-check the angle and its tangent value before using the formula.
FAQs:
5. How can I use the Tan2x formula in real-life situations?
The Tan2x formula can be applied in fields such as engineering, computer graphics, and astronomy, where precise trigonometric calculations are required for various applications.
6. Are there any visual tools to help understand Tan2x?
Yes, graphing calculators and software can visually represent the behavior of the Tan2x function. These tools help in understanding the function’s characteristics and how it compares to the standard tangent function.
7. What should I do if I encounter an undefined value while using the Tan2x formula?
If the formula results in an undefined value, it typically means that the tangent of the angle is such that the denominator becomes zero. In such cases, review the problem context and consider the periodic nature of the tangent function to interpret the results correctly.
8. Can I apply the Tan2x formula to angles larger than 360 degrees?
Yes, the formula can be applied to angles larger than 360 degrees by considering the periodic nature of the tangent function. The tangent function repeats every 180 degrees, so angles can be reduced to their corresponding values within one period.
Conclusion
The Tan2x formula is a fundamental tool in trigonometry that simplifies the calculation of the tangent of double angles. Its derivation from the tangent addition formula and its various applications make it a critical concept for students and professionals alike. By understanding and applying the Tan2x formula correctly, you can solve complex trigonometric problems with ease.
0 notes
Text
Marching Cubes 33 background
Marching Cubes algorithms are used for creating (sometimes referred to as "extracting") a three-dimensional polygon mesh from a grid of three-dimensional coordinates with corresponding values (also known as a three-dimensional scalar field). They serve as methods for constructing geometric surfaces from numerical data (such as volumetric datasets obtained from MRI scans) (Polygonising a scalar field (Marching Cubes) (paulbourke.net)). By dividing a three-dimensional grid into cubes, polygon arrangements can be created within each cube (by attaching vertices to cube edges) to 'isolate' some corners of each cube from others within the same cube. The set of corners chosen to be isolated and the edge points for polygon vertex attachment depend upon the values of cube corner points, with the specific values originating from the dataset or function initially used to create the original grid/scalar field. Polygon arrangements are precalculated — there are a set number of configurations (14 unique cases and 256 in total with symmetries in the original algorithm) for isolating different groupings of corners — and stored in a lookup table which is accessed when processing each cube in the grid. Once every cube has been processed, the polygons that have been created form a mesh.
The original Marching Cubes algorithm was created in 1984 by two scientists working in research and development for General Electric — William Lorensen (Computer Systems and Services department) and Harvey Cline (Electronic Materials Lab department) — who were inspired to work on the problem after attending a seminar about a (not yet built) rendering engine envisioned as being applicable to the task of three-dimensional medical surface display. The seminar speaker challenged the attendees to think of a solution for replacing a cuberille-based technology (representing three-dimensional pixels as cubes) with a polygon-based one. The Marching Cubes solution was formulated by Lorensen and Cline after the seminar on the same day, with Lorensen able to implement a working algorithm by the following day (History of the Marching Cubes Algorithm (computer.org)).
In 1991, ambiguities in the original algorithm were identified (The asymptotic decider: resolving the ambiguity in marching cubes | IEEE Conference Publication | IEEE Xplore). Those ambiguities being:
Certain pairs of polygon configurations may result in small holes in the mesh on shared faces of neighbouring cubes.
There can be more than one polygon configuration that isolates the same corners and the configuration that results in a hole-free mesh cannot be known without checking the configurations of cubes that share faces with the cube currently being processed.
(Chernyaev, 1995) proposed a new algorithm, Marching Cubes 33, that increases the number of topologically distinct polygon configurations from 15 to 33, and introduces new test cases for when to use each configuration, resolving the ambiguities (although only partially). Lewiner, 2003 completed and enhanced the method by Chernayaev and implemented a C++ solution that utilises a complete lookup table based on the configurations in the original Marching Cubes 33 paper. It is the implementation by Lewiner that forms the basis of the algorithm used in the novel method that has been developed.
0 notes
Text
I remember some aside being given in one of my physics classes that early philosophers believed velocity would "run out." Something about how ballistic arcs ended when something ran out of energy, I don't remember the specifics. It's not super important, it's just what this post reminded me about.
Anyway, for a long time I thought all ballistic arcs must be parabolic. But that's not true -- for something experiencing drag, especially a lot of drag, its flight will not look like a parabola (EDIT: it will, just...it'll look just slightly off. Unless it's leaves or paper, then it won't look like a parabola).
And, in fact, with quadratic drag, something that starts with horizontal velocity will have the "far end" (i.e. the part when it's falling down from its peak) approach an asymptote on the y-axis. In other words, its horizontal speed approaches zero. (EDIT: this takes a while. Many dense objects never get all that close to this kind of phenomenon)
Intuitively, this makes sense. Something under the influence of friction or drag will come to a stop. And since the only propelling force a projectile experiences is in the vertical direction, it in essence "comes to a stop" in the horizontal direction, approaching a vertical line in its flight.
This explanation probably misses some key points (for example, the flight path can do something different when the projectile has wings (see: airplanes) and/or is spinning (see: the Magnus effect)) but I thought I'd toss something out while this post is fresh in my mind.
EDIT: And this flight path is actually pretty much a parabola! Most ballistic arcs are. It's only slightly non-parabolic. The main reason this looks like one side is steeper than the other is the angle the image is taken at.

In case you need it for your D&D games or siege actions— here's what the ballistic trajectory of a flaming pumpkin fired out of a trebuchet looks like.
38K notes
·
View notes